
Abstract
There is a substantial amount of carbon stored in the permafrost soils of boreal forest ecosystems, where it is currently protected from decomposition. The surface organic horizons insulate the deeper soil from variations in atmospheric temperature. The removal of these insulating horizons through consumption by fire increases the vulnerability of permafrost to thaw, and the carbon stored in permafrost to decomposition. In this study we ask how warming and fire regime may influence spatial and temporal changes in active layer and carbon dynamics across a boreal forest landscape in interior Alaska. To address this question, we (1) developed and tested a predictive model of the effect of fire severity on soil organic horizons that depends on landscape-level conditions and (2) used this model to evaluate the long-term consequences of warming and changes in fire regime on active layer and soil carbon dynamics of black spruce forests across interior Alaska. The predictive model of fire severity, designed from the analysis of field observations, reproduces the effect of local topography (landform category, the slope angle and aspect and flow accumulation), weather conditions (drought index, soil moisture) and fire characteristics (day of year and size of the fire) on the reduction of the organic layer caused by fire. The integration of the fire severity model into an ecosystem process-based model allowed us to document the relative importance and interactions among local topography, fire regime and climate warming on active layer and soil carbon dynamics. Lowlands were more resistant to severe fires and climate warming, showing smaller increases in active layer thickness and soil carbon loss compared to drier flat uplands and slopes. In simulations that included the effects of both warming and fire at the regional scale, fire was primarily responsible for a reduction in organic layer thickness of 0.06 m on average by 2100 that led to an increase in active layer thickness of 1.1 m on average by 2100. The combination of warming and fire led to a simulated cumulative loss of 9.6 kgC m−2 on average by 2100. Our analysis suggests that ecosystem carbon storage in boreal forests in interior Alaska is particularly vulnerable, primarily due to the combustion of organic layer thickness in fire and the related increase in active layer thickness that exposes previously protected permafrost soil carbon to decomposition.
Export citation and abstract BibTeX RIS

Content from this work may be used under the terms of the Creative Commons Attribution 3.0 licence. Any further distribution of this work must maintain attribution to the author(s) and the title of the work, journal citation and DOI.
1. Introduction
Boreal ecosystems represent the largest reservoir of carbon among terrestrial biomes (Dixon et al 1994, McGuire et al 2002, Lal 2005). Most of this carbon is stored deep in the soil in permafrost where frozen organic matter is protected from decomposition (Zimov et al 2006, Schuur et al 2008). Locally, the stability of permafrost is largely controlled by the surface organic layer (OL), which insulates the soil from variations in atmospheric temperature (Viereck 1982, Hinzman et al 1991, Shur and Jorgenson 2007, O'Donnell et al 2009a). This insulation reduces the penetration of heat to the soil during summer and the loss of heat from the soil in winter. The efficiency of the OL to insulate the soil depends on its physical properties, including thickness (Kasischke and Johnstone 2005, Kane et al 2007) and moisture content (Gavriliev 2004).
The global increase in surface air temperature that started in early twentieth century (IPCC 2007) has been shown to be amplified at high latitudes (Chapman and Walsh 1993, Serreze et al 2000, Overland et al 2004, Serreze and Francis 2006). In interior Alaska, air temperature increased by 1.4 ° C during the twentieth century, which is about twice the global average (Wendler and Shulski 2009). Permafrost is particularly vulnerable to thaw in response to warming in regions where average annual temperature is close to the freezing point (Osterkamp and Romanovsky 1999, Romanovsky and Osterkamp 2000, Euskirchen et al 2006). Permafrost thaw driven by climate warming exposes deep soil carbon to warmer temperatures, that stimulate decomposition, and ultimately release soil organic carbon to the atmosphere in the form of methane or carbon dioxide, depending on the local drainage conditions (O'Donnell et al 2009b, Schuur et al 2009, Harden et al 2012a, Hugelius 2012). A number of modeling studies indicate that there will be substantial losses of near-surface permafrost in northern high latitudes, including Alaska, by 2100 (Euskirchen et al 2006, Lawrence et al 2008, Koven et al 2012, Lawrence et al 2012).
Climate warming is also thought to be responsible for recent changes in fire regime in northern high latitude regions (Gillett et al 2004). Annual area burned has increased in Alaska (Kasischke and Turetsky 2006, Kasischke et al 2010) and Canada (Gillett et al 2004), and is hypothesized to have increased in Eurasia in recent decades (Hayes et al 2011, Kharuk et al 2013). Several studies indicate that this increase is predicted to be maintained at least during the first half of the 21st century (Balshi et al 2009b, Mann et al 2012). Greater burned area and fire severity have substantial implications for permafrost, as increased severity leads to greater consumption of the OL that may increase active layer thickness (Dyrness and Norum 1983, Yoshikawa et al 2002, Burn et al 2009) and may potentially cause thermokarst disturbance in ice-rich soils (Jorgenson et al 2001, Myers-Smith et al 2008).
To forecast future changes in active layer thickness (ALT, maximum seasonal thaw depth) in response to warming and changes in fire regime, ecosystem models need to accurately reproduce the relationship between the OL and the thermal and hydrologic regimes in the soil by representing (1) the thermal and hydrological properties of the surface OL and mineral soil horizons, (2) the re-accumulation of OL horizons after fire, and (3) the spatial and temporal variability in the removal of organic horizons by fire. Several models are now capable of representing the thermal and hydrologic properties of the OL in boreal forests (i.e. Bonan 1989, Zhang et al 2003, Yi et al 2006, Lawrence et al 2008). The re-accumulation of the OL after a fire has been the subject of a number of site-specific studies (Wirth et al 2002, O'Donnell et al 2011, Harden et al 2012b), and process-based models have recently begun to simulate the biogeochemical and physical accumulation of OL thickness and how those dynamics affect post-fire soil temperature and moisture regimes (Yi et al 2009b, 2010). Recent model developments have also begun to represent the spatial and temporal variability of fire severity on the OL, primarily implementing coarse-scale look-up table approaches. For example, spatial variability of fire severity effects have been represented at the ecozone level (Balshi et al 2007) and for various classes of drainage (lowlands and uplands, Yi et al 2010). The effects of early versus late fire season and large, medium and small fires have also been considered to account for temporal variability of fire severity effects (Yi et al 2010, Yuan et al 2012). Recent empirical studies have more comprehensively documented the effects of topography, weather and vegetation on organic layer loss in black spruce forests of interior Alaska (Turetsky et al 2011b), and provide the opportunity to move from a look-up table approach toward a much finer representation of continuous variation in fire severity effects across the landscape in ecosystem models. Some recent remote sensing studies have demonstrated the possibility of using this data to estimate fire severity at the regional scale (Barrett et al 2011).
The objectives of this study are to (1) develop a predictive model of landscape-level effects of fire severity on soil organic horizons for black spruce forests using a recent large database of observations collected in interior Alaska, and (2) use this model to evaluate the long-term consequences of warming and changes in fire regime on active layer thickness and soil carbon stocks of black spruce forests across the landscape in interior Alaska. We used existing observations of post-fire organic layer loss to develop a predictive model that reproduces the spatial and temporal variability of fire severity. We then used the terrestrial ecosystem model with dynamic organic soil layers (DOS-TEM; Yi et al 2010; Yuan et al 2012), an ecosystem process-based model coupled with our predictive model of fire severity to assess the relative importance of warming, fire regime and local topography on future active layer thickness and soil carbon stocks across a boreal landscape in interior Alaska.
2. Material and methods
2.1. Development of a predictive model of post-fire reduction of organic layer (OL) thickness
We used existing observations of the OL thickness in recently burned black spruce forests of interior Alaska (figure 1) along with information about topography, weather and fire history to develop a predictive model of the relative loss of OL (ROL) due to fire. In this study, ROL refers to the ratio between the loss of OL thickness and the pre-fire OL thickness:

where OLTpre and OLTpost are the pre-fire and post-fire organic layer thickness, respectively. The data used for this analysis are from 178 black spruce dominated stands in interior Alaska. Data were stratified into three landscape categories representing different drainage conditions: flat lowland (poorly drained), flat uplands (well drained), and slopes (very well drained, depending on slope angle and aspect, for the influence of runoff and light regime). These landscape categories were assessed from field observations of local topography. The sampled sites covered 31 fire events that occurred between 1983 and 2005 (Turetsky et al 2011b). For each site, the database contained the coordinates of the sites, the measured pre-fire and post-fire OL thickness, the name, date and size of the fire event, and the landscape category. The loss of OL was quantified using adventitious roots as a marker for pre-fire OL thickness (Kasischke et al 2008), combustion rods (Ottmar and Sandberg 2003), or comparison of OL thickness in paired burned versus unburned stands (Kasischke and Johnstone 2005, Harden et al 2006). Further details on the database can be found in Turetsky et al (2011b) and the data used in the present analysis have been archived in the Bonanza Creek Long Term Ecological Research database (Kasischke 2013).
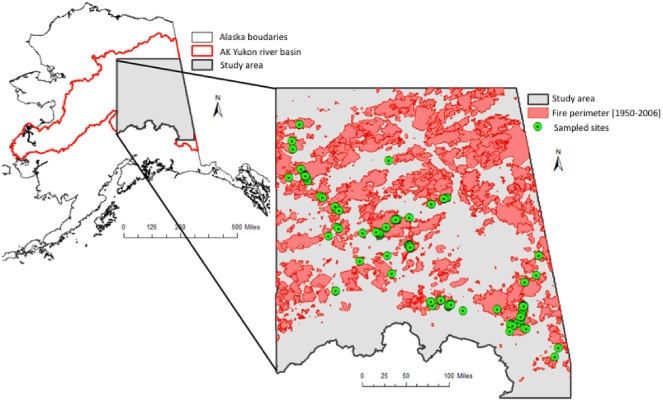
Figure 1. Location of the sampled sites and the area of simulation in interior Alaska.
Download figure:
Standard image High-resolution imageWe used the database information to then assess the effects of topography and hydrology on ROL using the National Elevation Dataset of the USGS at 60-m resolution (NED, http://ned.usgs.gov/). The topographic descriptors tested included slope, aspect, log-transformed flow accumulation, compound topographic index, curvature, and relief index. The aspect was split into two gradients: the north/south gradient equal to the sine of the aspect and the east/west gradient equal to the cosine of the aspect. The flow accumulation is derived from a cumulative count of the number of pixels that naturally drain into outlets. Sites with high flow accumulation may represent stream channels and cells with accumulation of 0 are local topographic highs. The compound topographic index, which is a steady state indicator of wetness, is a function of slope and flow accumulation (Gessler et al 1995). The curvature is the second derivative of the surface geometry. Positive curvature indicates a convex surface or divergence of flow. Negative curvature indicates a concave surface or a convergence of flow. The relief index was the standard deviation of elevation estimated for each grid cell and its eight direct neighbors. The effect of weather characteristics on ROL was represented using estimates of monthly mean temperature, summer precipitation, mean vapor pressure, and mean surface downwelling shortwave radiation from 1901 to 2009 at 1 km × 1 km spatial resolution, all of which were downscaled using the delta method (Fowler et al 2007) by the Scenarios Network for Alaska and Arctic Planning (SNAP, www.snap.uaf.edu/), from 0.5° × 0.5° resolution data of the Climatic Research Unit (CRU, www.cru.uea.ac.uk/). Additional weather characteristics were estimated from DOS-TEM simulations (DOS-TEM is described in more detail below in section 2.2): the maximum ratio between real and potential evaporation of the year prior to fire (ET and PET respectively), the vapor pressure deficit, and soil temperature and soil moisture in the OL. The ratio between the maximum monthly ET and PET (ET/PET) of the previous year was used as an indicator of water stress that occurred the year prior to fire. Information on fire history from 1950 to 2006 (annual area burned, date of burn) was obtained from the Alaska Interagency Coordination Center Large Fire Scar database (AICC, http://fire.ak.blm.gov/; see Kasischke et al 2002).
Because a number of observations were collected within the same fire scar and in the same landscape category, the observations of ROL were averaged per landscape category within every fire event to avoid pseudo-replication bias, and this reduced the total number of observations from 178 to 49. Additionally, predictor variables were numerous (eight variables related to topographic conditions, seven variables related to weather conditions and two variables related to fire characteristics) and inter-related. For instance, the Pearson correlation between the date of burn and the area burned were significant and equal to 0.401. Similarly, the correlation between soil temperature and soil moisture was −0.406. Therefore, the predictive model of ROL was estimated using partial least square regression (PLS, Tenenhaus et al 2005), a statistical technique particularly well suited to analyze a large array of related predictor variables, with a limited sample size (Carrascal et al 2009). PLS summarizes in a few new latent variables the information contained in X, the predictor variables, and Y, the response variables, to develop a relationship between them. The selection of the predictors to eliminate from the analysis was based on the regression coefficient of the centered and scaled data and on the predictor's importance. The data were centered and scaled to have a null mean and a standard deviation of 1 to ensure that each variable had the same weight and the selection of the predictors was based on how much variation of the response a predictor explains. The predictor's importance summarizes its contribution to the whole model (its capacity in fitting the model for both X the predictors and Y the response), weighing the contribution of each predictor according to the variance explained by each PLS component. If a predictor has a relatively small regression coefficient and a small value of importance (less than 0.8, see Wold 1994), then it is a prime candidate for deletion.
The predictive model of ROL identified the landscape category as the primary driver of the relative amount of OL burned during fire. The 60-m resolution descriptors that we used to assess topography and hydrological conditions were not completely successful in reproducing the effect of the field-assessed landscape category on ROL. However, landscape category had a significant effect on explaining ROL residuals of the model using only the topographic descriptors at a 60-m resolution (F = 3.64; p = 0.034). Therefore, we developed separate continuous predictive models of ROL for each landscape category. All analyses were performed using the SAS statistical package (SAS 9.1, SAS Institute Inc., Cary, NC, USA). The assumptions of normality and homoscedasticity were verified by examining residual plots. Effects were considered highly significant at the 0.05 level and marginally significant at 0.10.
2.2. Integration of the predictive model of ROL in the terrestrial ecosystem model
The predictive model of ROL was integrated into the disturbance module of the dynamic organic soil version of the terrestrial ecosystem model (DOS-TEM). The TEM family of process-based ecosystem models has been designed to simulate carbon and nitrogen pools of the vegetation and the soil, and carbon and nitrogen fluxes among vegetation, soil, and the atmosphere (Raich et al 1991, McGuire et al 1992). Previous regional applications of TEM in northern high latitudes have investigated how biogeochemical dynamics of terrestrial ecosystems in these regions are affected at seasonal to century scales by processes like soil thermal dynamics (Zhuang et al 2001, 2002, 2003), snow cover (Euskirchen et al 2006, 2007), and fire (Balshi et al 2007, Yuan et al 2012). DOS-TEM has been primarily developed to represent how changes in organic horizon thickness affect ecosystem processes immediately following fire and during stand succession. During stand succession, soil organic thickness is computed after soil carbon pools are altered by ecological processes (i.e. litterfall, decomposition) based on the relationships between soil carbon content and soil organic thickness of different organic horizons in black spruce stands in Manitoba, Canada (Manies et al 2005, 2006, Yi et al 2009a, 2009b):

where C and x are C content (gC cm−2) and thickness (cm) of the OL, and a and b are fitted parameters (see Yi et al 2009a for details). The vertical distribution of soil carbon in the mineral layers is determined from a combined exponential relationship between depth and carbon density:

where Cdens is the carbon density (kg m−3), depth is the soil depth (cm) from the boundary between the mineral and organic layer and a,b and c are fixed parameters (10.056, 6.147, −0.0662 respectively). This relationship has been parameterized using observations from study sites in interior Alaska (Harden et al 2012a, Johnson et al 2011). The predictive model of ROL has been added into the disturbance module of DOS-TEM, which calculates the proportion of organic layer thickness and vegetation biomass that is burned, the proportion of vegetation biomass that died from the fire, and the carbon and nitrogen lost in combustion emissions. This module is called each year a fire occurs. In the previous version of DOS-TEM, the ROL was estimated using a look-up table for two classes of drainage (lowlands and uplands, Yi et al 2010). We replaced this look-up table by the continuous algorithms developed from the PLS analysis. The post-fire OL thickness is then calculated from the pre-fire thickness and the estimated ROL. The post-fire carbon content in the OL is then updated using a power relationship between OL thickness and carbon content from equation (2) (see Yi et al 2009a, 2009b for details). The calibration of DOS-TEM makes use of (1) soil carbon observations from study sites in interior Alaska (Harden et al 2012a; see Yi et al 2010) and from the National Soil Carbon Database for interior Alaska (Johnson et al 2011, see Yuan et al 2012), and (2) vegetation carbon and nitrogen pools and carbon fluxes from studies conducted by the Bonanza Creek Long Term Ecological Research (LTER) program (Ruess et al 1996 for lowland black spruce forest and Vogel et al 2005 for upland black spruce forest; see Yi et al 2010; Yuan et al 2012). In this study, the integration of the predictive model of fire severity into DOS-TEM was verified by running DOS-TEM for each of the ROL observation sites used to develop the predictive models of fire severity.
2.3. Evaluation of the effects of local topography, fire regime, and climate warming on active layer and soil carbon dynamics
We used DOS-TEM with the integrated predictive model of fire severity to assess the relative importance of climate warming, fire regime and local topography on organic layer, active layer thickness, and soil carbon dynamics across the landscape in interior Alaska. The area of simulation overlaps all the fire events where field observations of organic layer reduction had been collected. This study area covers about 240 000 km2 in the eastern part of the Yukon River Basin within Alaska (figure 1). The distribution of landform categories over the area of simulation was assessed from topographic information (see the supplemental material, available at stacks.iop.org/ERL/8/045016/mmedia). Based on DOS-TEM outputs, active layer dynamics were analyzed by quantifying the changes in the active layer thickness in relation to changes in the OL thickness over time. Changes in soil carbon stocks from DOS-TEM were evaluated by quantifying changes in total soil carbon stocks over time. To evaluate the effects of climate warming and changing fire regime, we conducted a factorial analysis combining a scenario with and without warming (figure 2(a)) and a scenario with changing or constant fire regime (figure 2(b)). The warming scenario combined (1) historical climate variability from 1901 to 2009 with (2) climate variability from 2010 to 2100 projected by the coupled general circulation model version 3.1-t47 developed by the Canadian Centre for Climate Modeling and Analysis (CCMA, www.cccma.ec.gc.ca/data/cgcm3/) for the mid-range emission scenario A1B. The climate data were bias corrected, downscaled and re-sampled by the SNAP using the same methods as for the historical climate data for site-specific simulations (see section 2.1). For the no-warming scenario, a smoothing cubic spline with an amplitude of frequency response of 0.5 and a periodicity of 50 years was fitted to the time series of mean air temperatures. The detrended air temperatures were then computed for each 1-km grid cell as a function of the mean air temperature from 1901 to 1930 (T(1901–1930)), and the difference between the current (Tcurr) and predicted air temperature (Tpred) from the smoothing spline:

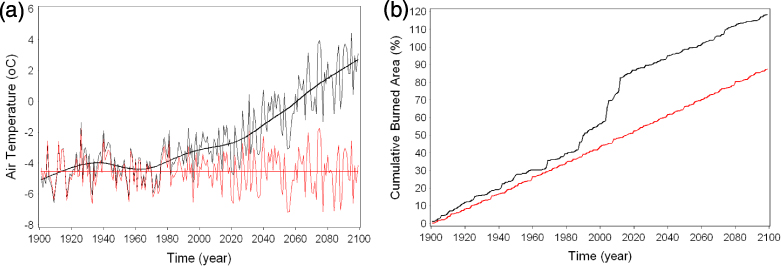
Figure 2. Time series of (a) the CCCMA warming and (b) the CCCMA-ALFRESCO fire scenarios: the red lines represent no warming and no fire intensification scenarios and the black represent warming and fire intensification scenarios.
Download figure:
Standard image High-resolution imageThe detrending procedure was applied to the time series of air temperature for each 1-km grid cell for every month of the year. The scenario with changing fire regime combined (1) historical records from 1950 to 2009 and (2) projected scenarios from the ALaska FRame-based EcoSystem Code (ALFRESCO1.0, Rupp et al 2001, 2002). This scenario represents the changes in fire frequency in response to climate change and changes in vegetation composition over time. The normalized fire regime dataset was generated by using a fire return interval (FRI) dataset that was developed from the 1960–1989 fire data (Yuan et al 2012). This scenario represents a constant fire frequency over time that reflects conditions prior to the significant increase of annual area burned observed in Alaska after the 1990s. For each 1-km grid cell, the first fire year of the normalized fire regime dataset was randomly chosen between 1900 and 1900 + FRI. The next fire years then occurred at regular FRI.
The effects of warming, fire regime and local topography and their interactions with the dynamics of active layer thickness and soil carbon balance were statistically analyzed for the sampled sites (Turetsky et al 2011a, 2011b), using an analysis of variance. The absence of spatial autocorrelations for the observed ROL was checked prior to the analysis based on two indices (Moran's I =− 7.53 × 10⁻⁴,p = 0.375 and Geary's c = 1.009, p = 0.624). The effects of warming, fire and topography were tested by examining the changes in organic layer thickness, active layer thickness and soil carbon stocks, between the early 20th century and the late 21st century. We computed the means of these variables for the beginning of the 20th century (1901–1930) and the end of the 21st century (2071–2100), and then took the difference between these two periods to compare pre-industrial conditions with changes that occurred during the entire period studied.
3. Results
3.1. Predictive model of ROL
Among all the descriptors, the landscape category was the best predictor of ROL, accounting for 24.8% of the variability. ROL was lower in flat lowlands (0.467 ± 0.177 cm cm−1, mean ± standard deviation) and higher on slopes (0.712 ± 0.174 cm cm−1) and flat uplands (0.605 ± 0.140 cm cm−1). ROL in flat uplands and slopes were marginally significantly different from each other (figure 3, p = 0.052).

Figure 3. ROL for different landscape categories based on field observations (FL = flat lowland, FU = flat upland and S = slopes). The length of the box represents the inter-quartile range, the dot and the horizontal line in the box represents the group mean and median, respectively. The vertical lines extend to the minimum and maximum values. The different letters below the boxes indicate significant differences in ROL among landscape categories.
Download figure:
Standard image High-resolution imageTo take into account the importance of the landscape categories in predicting ROL, an initial predictive model was developed using continuous descriptors of topography (from a 60-m resolution DEM) as surrogates of discontinuous landscape categories (estimated in the field), as well as descriptors of weather conditions, and fire characteristics as independent variables (table 1). ROL increased with the slope, relief index, ET/PET ratio, date of the burn and area burned. ROL was negatively related to northern aspects, flow accumulation, compound topographic index and the volumetric water content (VWC) of the OL. Despite their importance in the model, the 60-m resolution descriptors used to assess topography and hydrological conditions were not completely successful in reproducing the effect of the field-assessed landscape categories on ROL. The landscape category still had a significant effect on the residuals of this model (F = 5.49, p = 0.002). Therefore we developed a predictive model of ROL for each of the three landscape categories (table 2). ROL was reduced on sites with a northern exposure for both flat lowlands and slopes. In flat lowlands, ROL was also reduced in sites with high flow accumulation (wetter sites). ROL was reduced by high OL volumetric water content and increased with the date of burn and the size of the area burned in the models for both flat uplands and slopes. In flat uplands, ROL increased with the slope and the ET/PET ratio. These three models explained 49.6% of the observed variability of ROL (figure 4). There was no significant difference between observed and simulated ROL (paired t-test: t = 0.01, p = 0.992) and the effect of landform categories on ROL was faithfully reproduced (F = 16.82, p < 0.001, figure 4). The parent version of DOS-TEM, which used a look-up table approach, significantly underestimated observed ROL (paired t-test: t = 7.67, p < 0.001) and the difference of ROL between landform categories was not significant (F = 0.13, p = 0.878; figure 4). The effect of landform categories and fire on the OL thickness impacted the active layer thickness. In general, the relative organic layer loss after fire induced an increase of the relative active layer thickness, defined as the increase of ALT after fire divided by the pre-fire ALT (F = 52.82, p < 0.001; figure 5). The relationship is significant in flat uplands (F = 16.40, p < 0.001) and slopes (F = 37.95, p < 0.001), but not in flat lowlands (F = 2.61, p = 0.135).
Table 1. Importance and regression coefficient of the parameters selected to predict relative organic layer Loss (ROL) from the partial least square analysis. ET/PET (n − 1) is the ratio between real and potential evapotranspiration for the year prior to the fire, as simulated by TEM. VWC is the volumetric water content in the OL at the date the fire occurs, as simulated by TEM. The regression coefficients are for the centered scaled data (see section 2.1).
| Parameters | Importance | Regression coefficient |
|---|---|---|
| Slope (deg) | 1.071 | 0.098 |
| N/S gradient | 0.813 | −0.074 |
| Flow accumulation (log-transformed) | 0.881 | −0.080 |
| Wetness index | 1.325 | −0.121 |
| Relief index | 1.058 | 0.096 |
| ET/PET (n − 1) | 0.858 | 0.078 |
| VWC | 0.816 | −0.065 |
| Date of burn | 0.992 | 0.090 |
| Area burned (km2) | 1.143 | 0.104 |
Table 2. Importance and regression coefficient of the parameters selected to predict ROL from the partial least square analysis. See the legend in table 1 for the descriptions of the acronyms. The regression coefficients are for the centered scaled data (see section 2.1).
| Parameters | Flat lowlands | Flat uplands | Slopes | |||
|---|---|---|---|---|---|---|
| Importance | Regression coefficient | Importance | Regression coefficient | Importance | Regression coefficient | |
| Slope (deg) | 0.970 | 0.139 | ||||
| N/S gradient | 0.830 | −0.201 | 0.909 | −0.256 | ||
| Flow accumulation (log-transformed) | 1.211 | −0.334 | ||||
| ET/PET (n − 1) | 0.853 | 0.108 | ||||
| VWC | 1.287 | −0.184 | 0.882 | −0.248 | ||
| Date of burn | 1.019 | 0.146 | 1.277 | 0.359 | ||
| Area burned (km2) | 0.893 | 0.128 | 0.875 | 0.246 | ||
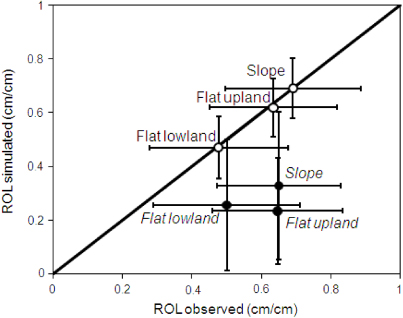
Figure 4. Model verification: comparison of the ROL computed from observations and from simulated by DOS-TEM with the original version of the model (closed circle) and with the modified fire module (open circle). The vertical lines represent standard deviation of the simulated ROL, the horizontal line represent standard deviation of the observed ROL for each landscape categories. The oblique line represents the [1:1] slope.
Download figure:
Standard image High-resolution image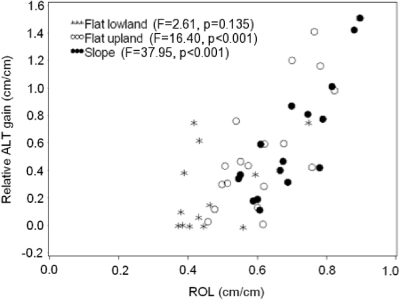
Figure 5. Relation between relative gain of ALT and relative loss of organic layer in response to fire.
Download figure:
Standard image High-resolution image3.2. Effects of local topography, fire intensification and climate warming on permafrost degradation and the carbon balance
DOS-TEM simulated changes in OL thickness, active layer thickness, and soil carbon stocks for the sampled sites between (1901–1930) and (2071–2100) across landscape categories and the factorial warming and fire scenarios (table 3). The dynamics of OL thickness, active layer thickness, and soil carbon pools were significantly influenced by fire regime and warming. While the effect of topography was significant on the dynamic of OL and active layer thicknesses, it was only marginally significant (p = 0.06) on changes in soil carbon pools. There were marginally significant and significant interactions between local topography and warming effects on changes in OL thickness and ALT respectively, suggesting a weaker effect of warming in flat lowlands compared to flat uplands and slopes. Warming decreased OL thickness by 2.46, 4.19 and 4.98 cm and increased ALT by 46.3, 76.3 and 84.6 cm for flat lowlands, flat uplands and slopes, respectively. The interaction between topography and fire severity was significantly related to OL thickness (table 3), and soil carbon stocks (marginally significant, p = 0.06), with a general pattern of weaker effects of fire in flat lowlands compared to flat uplands and slopes. The interaction between fire regime and warming was significant for changes in OL thickness and soil carbon stocks, suggesting that the effect of fire was intensified with warming climate. This interaction, which was significant at the plot level (table 3), was reduced at the regional level (figure 6), because warming affected the entire landscape while only 44.7% of the landscape was estimated to have burned between 2010 and 2100.
Table 3. Results of the analysis of variance testing the effect of local topography, warming and fire intensification on changes in averaged OL thickness, active layer thickness, soil carbon stocks from (1901–1930) and (2071–2100) in the sites where observations have been collected. DF =degree of freedom, F =Fisher value, p = probability.
| Source | DF | Change in OL thickness | Change in ALT | Change in soil carbon stock | |||
|---|---|---|---|---|---|---|---|
| F | p | F | p | F | p | ||
| Local topography | 2 | 9.80 | <0.01 | 21.05 | <0.01 | 2.98 | 0.06 |
| Warming | 1 | 19.54 | <0.01 | 97.08 | <0.01 | 15.81 | <0.01 |
| Local topography × warming | 2 | 2.58 | 0.08 | 4.38 | 0.01 | 0.28 | 0.76 |
| Fire | 1 | 359.76 | <0.01 | 6.4 | 0.01 | 272.65 | <0.01 |
| Local topography × fire | 2 | 35.27 | <0.01 | 1.90 | 0.16 | 2.88 | 0.06 |
| warming×fire | 1 | 12.62 | <0.01 | 1.13 | 0.29 | 3.80 | 0.05 |
| Local topography × warming × fire | 2 | 0.16 | 0.85 | 0.08 | 0.93 | 0.07 | 0.93 |

Figure 6. Time series of changes in (a) organic layer thickness, (b) active layer thickness and (c) soil carbon content from 1901 to 2100 for the equilibrium scenario (gray solid line), warming only scenario (gray dotted line), for the fire intensification only scenario (black dotted line), for the warming and fire intensification scenario (black solid line).
Download figure:
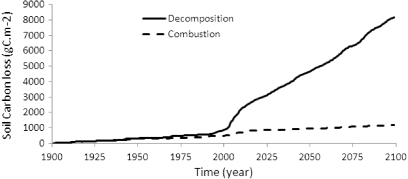
Standard image High-resolution imageOur simulation for historical warming and change in fire regime over the entire study area (figure 1) indicates that during the course of the 20th and 21st centuries, the OL thickness decreased, active layer thickness increased, and soil carbon decreased (figure 6). Warming alone caused a decrease of 5.4 cm in OL thickness and 7579 gC m−2 soil organic carbon loss by 2100. The addition of changes in fire regime decreased OL thickness by 6.5 cm and soil carbon stocks by 9817 gC m−2 by 2100 compared to the simulation with no change in fire and no warming. Changes in fire regime only induced a loss of 8792 gC m−2 of soil carbon stocks by 2100. This loss was due to 1102 gC m−2 from soil carbon combustion and 7690 gC m−2 from soil carbon decomposition (figure 7). The increase in active layer thickness by 2100 was similar (about 1.1 m) in response to warming alone, changes in fire regime alone, and the combination of warming and changes in fire regime. However, the change in active layer thickness from the warming alone had a different trajectory than the other two scenarios, indicating that changes in fire regime exposed more soil carbon to decomposition during the 21st century than did warming.
Figure 7. Amount of soil carbon lost from fire only partitioned between decomposition of organic matter (solid black line) versus combustion during fire (dotted black line).
Download figure:
Standard image High-resolution image
4. Discussion
Recent changes in fire regime toward larger fire years and later fire seasons in interior Alaska are estimated to have increased total carbon emissions in Alaskan black spruce forest, due to increased soil organic layer combustion (Turetsky et al 2011b). These increased emissions may cause the boreal forest in interior Alaska to shift from being a net carbon sink to a potential source (Hayes et al 2011, Yuan et al 2012). Fire severity in the boreal forest region is affected by vegetation composition (Hély et al 2001), drainage and permafrost (Kane et al 2007, Turetsky et al 2011b, Kasischke et al 2012), and weather conditions (Clark 1988, Duffy et al 2005). Because of projected increases in area burned in boreal regions (Gillett et al 2004, Flannigan et al 2005, Balshi et al 2009a), it is essential that ecosystem models represent the drivers of fire severity to forecast how changes in fire severity will influence OL thickness, active layer thickness, and total soil carbon stocks. The goal of this study was to develop a predictive model that reproduces the spatial and temporal variations of fire severity that can then be used to estimate the effects of fire severity on changes in active layer thickness and carbon stocks of black spruce forests across the landscape in interior Alaska.
4.1. Representation of the spatial and temporal variability of fire severity
We defined fire severity as the relative loss of organic layer thickness after fire. Our analysis succeeded in reproducing the observed effects of local topography and weather on fire severity. Local topographic effects considered in our analysis included landscape category, slope and aspect, flow accumulation, and the compound topographic index. ROL was lower in flat lowlands characterized by elevated compound topographic index and large flow accumulation than on slopes and flat uplands because moist conditions prevent deep burning of soil organic horizons (Miyanishi and Johnson 2002). Soil moisture is more variable in drier flat uplands and slopes, and it therefore has a larger influence on fire severity in these landscapes compared to lowlands. Among slopes, north facing aspects experience lower evapotranspiration because of lower insolation and higher soil moisture and more protection from deep burning compared to other aspects. The effect of ET/PET of the year prior to fire on ROL in flat uplands suggests that water availability may influence fire intensity over more than a single season by increasing the amount of fuel available through an increase of leaf litter and by reducing soil moisture (Forkel et al 2012). The positive effect of late-season fire and fire size on ROL is consistent with previous studies that link increased fuel consumption with increased soil drainage and drier soils late in the growing season (Kasischke and Johnstone 2005).
4.2. The effect of drainage on the response of the active layer thickness and the soil carbon stocks to warming and fire regime
The integration of our fire severity model into an ecosystem process-based model helped us to document the relative importance and interactions among local topography, fire regime and climate warming on changes in active layer thickness and soil carbon stocks. Local topography, related to drainage conditions, affects the level of consumption of the surface soil OL, which in turn has consequences for the active layer dynamics. In contrast to an upland site, a poorly drained site will prevent deep burning and conserve a thick residual OL, which may not significantly change insulation properties, protecting the soil from heat penetration and from drying during the summer (Kasischke and Johnstone 2005). Furthermore, permafrost in wetter lowland black spruce forest has a higher ice content and is cooler than in uplands (Jorgenson et al 2010). The high latent heat content of ice-rich soil impedes the rate of thawing and, compared to uplands, permafrost in lowland black spruce forest might thus be more resistant to thawing as a result of fire and/or warming. Our simulations show that the higher fire severity in well-drained sites (flat uplands and slopes) caused larger changes in the active layer thickness than lower fire severity occurring in poorly drained sites (flat lowlands). The site-specific simulations of soil carbon stocks revealed that the overall decrease of soil carbon over time and the response to fire was lower in poorly drained sites compare to well-drained sites. Poor drainage in lowlands influence soil carbon stocks through the effects of high soil moisture levels in reducing decomposition rates (Flanagan and Veum 1974, Hobbie et al 2000). This effect might be enhanced by the temporary increase of soil moisture and water level after a fire (Jorgenson et al 2001). In addition to differences in hydrological conditions, thicker snow cover and a longer snow-covered period in lowland sites, which are less exposed to radiation and wind than upland sites, may enhance the thermal insulation of the soil in winter. This effect of local topography on snow cover is not reproduced in the present simulations.
This study contributed, with previous work (Turetsky et al 2011b, Kasischke et al 2012), in demonstrating the importance of considering landscape heterogeneity—drainage condition in the present case—when assessing the fate of permafrost and carbon cycle in response to climate change and fire regime at a regional scale (Jorgenson et al 2013). Several lines of evidence suggest that although lowlands seem more resistant to changes in response to fire and climate disturbances than uplands (i.e. Swanson 1996; Jafarov et al 2013), the magnitude of their response to severe disturbance can substantially affect vegetation, local drainage, and soil carbon storage. For instance, the degradation of ice-rich permafrost in response to warming may induce soil subsidence and the transition from lowland permafrost plateau forests to wetlands with deep permafrost, water impoundment and shallow water tables (i.e. thermokarst, Jorgenson et al 2001). These wetlands are hydrologically different from permafrost plateau forests that results in the accumulation of thicker organic horizons (Johnson et al 2013) and anoxic decomposition of soil organic matter (Schuur et al 2008). In regions with lower ice content, the increase of active layer thickness in response to warming might increase runoff and contribute to drying of the soils, promoting productivity, aerobic decomposition, and possibly an increase in the vulnerability to fire disturbance. A long-term drainage experiment in a boreal fen shown that the two-fold increase of soil organic matter accumulation induced by soil drainage was compensated by a nine-fold increase in carbon losses during fire (Turetsky et al 2011a). Therefore landscape heterogeneity plays an important role in the trajectory and the magnitude of the effect of fire and climate changes on permafrost and soil carbon (Jorgenson et al 2013). These interactions are thus critical to represent in terrestrial ecosystem models.
4.3. Regional fate of the active layer thickness and the soil carbon stocks from 1901 to 2100
The study area experienced significant warming since the late 1980s, and is projected to experience substantial warming over the 21st century according the CCCMA projections under the conservative A1B emission scenario (figure 2(a)), especially during wintertime. Additionally, the study area has experienced an increase of annual area burned since the early 1990s, particularly between 2000 and 2009, where about 34% of the area burned between 1950 and 2009 burned after 2000. After a sharp increase before 2020, the projection over the 21st century using ALFRESCO shows a stabilization of the area burned (figure 2(b)), which contrasts with other studies predicting an increase of area burned over the 21st century (Flannigan et al 2005, Balshi et al 2009a, Balshi et al 2009b). This stabilization is mainly related to the version of ALFRESCO used in the present study that takes into account the effect of fire severity on vegetation composition (Rupp et al 2002, Johnstone et al 2011), its feedback effect on fire regime, and changes in vegetation flammability that occur during succession (Chapin et al 2003, Rupp et al 2007). These processes were not well represented in previous studies. Specifically, changes in ROL affect the regeneration potential of conifer and evergreen shrubs versus deciduous trees and herbaceous vegetation, leading to dominance by deciduous species after severe fire (Johnstone and Kasischke 2005, Johnstone et al 2010). The stabilization of the area burned after 2020 is related to the replacement of black spruce forest that severely burned from 1990 to 2010 by less flammable deciduous stands. Furthermore, the CCMA model forecasts an increase in precipitation over the 21st century, compared to the historical records, especially in late summer and early fall (data not shown), when fires are often the most severe (see present study, Turetsky et al 2011b). This change in climate also contributes to the stabilization of the simulated area burned over the 21st century.
The reduction of OL thickness (6.5 cm) related to warming and changes in fire regime contributes to a substantial thickening of the active layer by 2100. Although the changes in active layer reach comparable levels by 2100 among the various scenarios of warming and fire regime, our results show that an increase of fire extent and severity induces a more rapid increase in active layer thickness than that seen with climate warming alone. Finally, our results suggest that climate warming through the 21st century may exacerbate soil carbon loss from wildfires. The loss of soil carbon in response to warming and changes in fire regime is related to the increase of decomposition rate in response to increased temperature (Komarov and Shanin 2012), the increase of carbon available for decomposition in response to permafrost thaw, and an increase in carbon emissions through combustion. With the integration of our new fire severity model in DOS-TEM, we estimated that a fire event combusted 1989.2 gC m−2 on average, of which 58.2% originated from the combustion of soil organic carbon and 41.8% from the vegetation. This amount is in accordance with previous estimates in boreal black spruce forest in Alaska and Canada (Randerson et al 2006, Boby et al 2010, Turetsky et al 2011b). The proportion of carbon lost from vegetation concerns the combustion of the aboveground and belowground biomass. Therefore this proportion is higher than previous estimates considering aboveground combustion only (25.1% in Randerson et al 2006; 30.6% in Boby et al 2010). Changes in fire regime solely induced a reduction of soil carbon stocks by 8.8 kgC m−2 by 2100, mostly due to loss by post-fire decomposition of soil carbon within and below the pre-fire active layer: 12.5% of the soil carbon lost from changes in fire regime was related to the combustion of the organic layer and 87.5% was related to post-fire decomposition of the soil organic carbon. The proportion of soil carbon loss from decomposition became greater than the combustion losses starting in the early 2000s. With warming added to changes in fire regime, we projected a reduction of the soil carbon stocks by 9.8 kgC m−2 by 2100, compared to the equilibrium conditions (no warming, no change in fire regime). Although shifts in vegetation related to fire regime are well represented in ALFRESCO, vegetation composition in DOS-TEM was static in our simulations. Therefore, the effect of potential shifts in vegetation composition on the biogeochemical and physical processes still needs to be quantified. A key question remaining is the degree to which increased productivity (Mack et al 2008) and lower flammability of deciduous forest could offset the carbon loss related to combustion and active layer thickening. This question will be the focus of further development of DOS-TEM coupled with a biogeochemical dynamic vegetation model (Euskirchen et al 2009). Furthermore, the present study suggests that warming, fire regime and drainage conditions not only influence the individual dynamics of the organic layer, the active layer and soil carbon but also the strength of the relationship among these three structural components of the ecosystems. For instance, we have shown that drainage conditions influence the relationship between organic layer and active layer thicknesses and their response to fire regime. Similarly, the relationship between active layer thickness and soil carbon storage in response to warming may be related to the depth of the permafrost. In sites where permafrost is shallow, the increase of active layer in response to warming or changes in fire regime may have greater influence on soil carbon loss by decomposition in the surface layers of the soil than in sites where permafrost is deeper and decomposition rates are lower. Yet, changes in the relationships among these three components are poorly documented.
Acknowledgments
This research was support from (1) the Department of Defense Strategic Environmental Research and Development Program (RC-2109), (2) the US Geological Survey and the Arctic, Western Alaska, and Northwest Boreal Landscape Conservation Cooperatives in Alaska through the Integrated Ecosystem Model for Alaska and Northwest Canada project, and (3) the National Science Foundation and the USDA Forest Service through the Bonanza Creek Long Term Ecological Research Program. Any use of trade, firm, or product names is for descriptive purposes only and does not imply endorsement by the US Government.