

Abstract
Thermokarst lakes accelerate deep permafrost thaw and the mobilization of previously frozen soil organic carbon. This leads to microbial decomposition and large releases of carbon dioxide (CO2) and methane (CH4) that enhance climate warming. However, the time scale of permafrost-carbon emissions following thaw is not well known but is important for understanding how abrupt permafrost thaw impacts climate feedback. We combined field measurements and radiocarbon dating of CH4 ebullition with (a) an assessment of lake area changes delineated from high-resolution (1–2.5 m) optical imagery and (b) geophysical measurements of thaw bulbs (taliks) to determine the spatiotemporal dynamics of hotspot-seep CH4 ebullition in interior Alaska thermokarst lakes. Hotspot seeps are characterized as point-sources of high ebullition that release 14C-depleted CH4 from deep (up to tens of meters) within lake thaw bulbs year-round. Thermokarst lakes, initiated by a variety of factors, doubled in number and increased 37.5% in area from 1949 to 2009 as climate warmed. Approximately 80% of contemporary CH4 hotspot seeps were associated with this recent thermokarst activity, occurring where 60 years of abrupt thaw took place as a result of new and expanded lake areas. Hotspot occurrence diminished with distance from thermokarst lake margins. We attribute older 14C ages of CH4 released from hotspot seeps in older, expanding thermokarst lakes (14CCH4 20 079 ± 1227 years BP, mean ± standard error (s.e.m.) years) to deeper taliks (thaw bulbs) compared to younger 14CCH4 in new lakes (14CCH4 8526 ± 741 years BP) with shallower taliks. We find that smaller, non-hotspot ebullition seeps have younger 14C ages (expanding lakes 7473 ± 1762 years; new lakes 4742 ± 803 years) and that their emissions span a larger historic range. These observations provide a first-order constraint on the magnitude and decadal-scale duration of CH4-hotspot seep emissions following formation of thermokarst lakes as climate warms.
Export citation and abstract BibTeX RIS

Original content from this work may be used under the terms of the Creative Commons Attribution 4.0 license. Any further distribution of this work must maintain attribution to the author(s) and the title of the work, journal citation and DOI.
1. Introduction
Thermokarst lakes are the most widespread form of abrupt permafrost thaw (Olefeldt et al 2016, Turetsky et al 2020). They form when soil warming melts excess ground ice, causing land surface subsidence (Jorgenson et al 2006, Liljedahl et al 2016, Nitzbon et al 2020). Water pools in these sinks forming ponds (perennial water bodies <1 ha). Ponding enhances heat transfer into the ground which in turn forms taliks (perennially unfrozen thaw bulbs) beneath and adjacent to the ponds. Enhanced heat transfer continues over decades, deepening and expanding the ponds to full-size lakes (>1 ha; Jones et al 2011, Kessler et al 2012). Talik formation beneath lakes accelerates deep permafrost thaw beyond rates predicted from changes in air temperature alone (Kessler et al 2012, Arp et al 2016, Langer et al 2016, Roy-Léveillée and Burn 2017): while top-down thaw by active layer deepening degrades centimeters of permafrost soils over decades, thermokarst lakes can degrade many meters of permafrost soil in just a few years (Grosse et al 2011, Kessler et al 2012).
As permafrost thaws beneath radially expanding lakes, it exposes previously frozen soil organic carbon to microbial metabolism. The resulting methane (CH4) and carbon dioxide (CO2) escape lakes via ebullition (bubbling) and diffusion. Thermokarst lakes, particularly those formed in yedoma permafrost, are known landscape-scale hotspots of 14C-depleted CH4 release (Zimov et al 1997, Walter Anthony et al 2018, Turetsky et al 2020, Estop-Aragonés et al 2020), reflecting the importance of old (ancient) permafrost carbon in these emissions. Methane emissions hotspots are also observed at the scale of individual lakes, where ebullition seeps form specific emissions hotspots in response to abrupt thaw around lake margins and rapid talik growth. However, little is known about the rates of permafrost carbon release from thermokarst lakes and whether or not their CH4 emissions are accelerating. A better understanding of spatiotemporal thermokarst-lake carbon dynamics is important since thermokarst lakes are projected to release approximately 40% (sim16 Pg C-CO2e) of ancient permafrost soil carbon emissions this century under RCP8.5 (Koven et al 2015, Schneider von Deimling et al 2015, Walter Anthony et al 2018).
An acceleration of permafrost CH4-C release from thermokarst lakes requires faster rates of abrupt thaw via lake formation and expansion. Thermokarst lake development is widespread in the Arctic (Nitze et al 2017, 2018). It is also a long-term process, which paleoenvironmental studies have shown is driven by climate, vegetation and fire feedbacks as well as by region-specific ground-ice distributions (Edwards et al 2016, Anderson et al 2019). In some regions, hydrologic connection between surface and sub-permafrost groundwater impacts thermokarst lake development (Yoshikawa and Hinzman 2003, Wellman et al 2013, Anderson et al 2019). Syntheses of Alaska-regional and circumarctic thermokarst-lake basal and drainage ages show that thermokarst lakes have been forming, expanding, draining and forming anew for the past 14 000 years (Bockheim et al 2004, Kaplina 2009, Jones et al 2012, Walter Anthony et al 2014). This study investigates whether recent rates of thermokarst-lake development and their associated CH4 emissions have accelerated in response to climate warming.
Specific objectives of this study were to (a) quantify recent, multitemporal thermokarst-lake area dynamics in an interior Alaska yedoma study region and (b) relate these lake changes to spatial patterns of within-lake hotspot CH4 ebullition seeps in order to constrain the time scale of permafrost-derived ebullition in newly formed and expanding thermokarst lakes. To this end, we utilized remote-sensing records of thermokarst-lake formation and expansion in interior Alaska since 1949, recent geophysical measurements of talik geometry, the detection of permafrost-carbon derived CH4 seeps in aerial photographs of early winter lake ice, and field work.
2. Study area
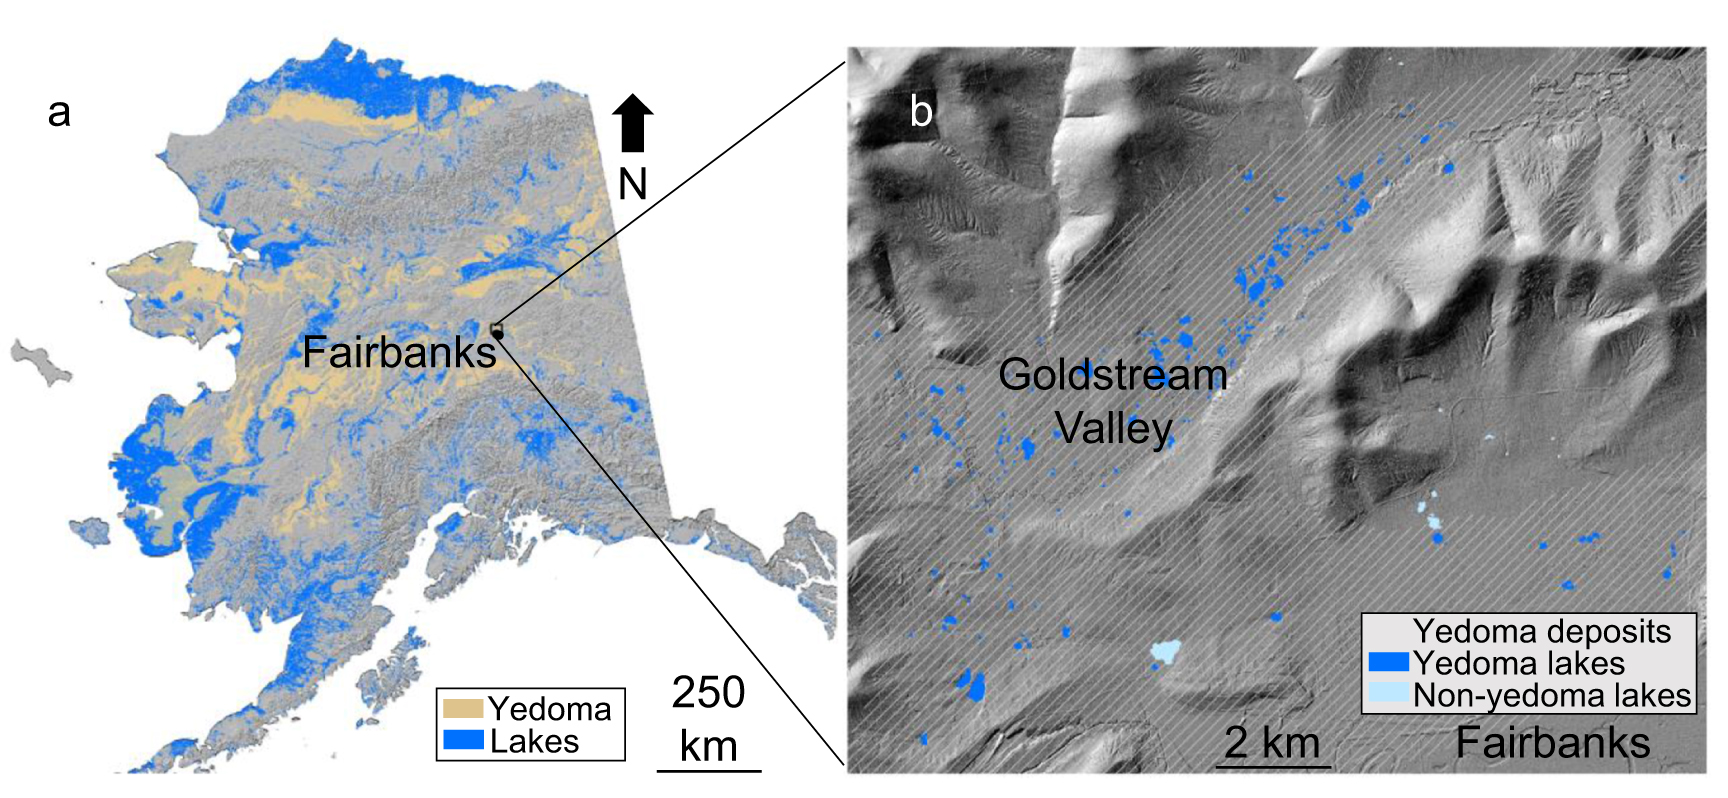
Our 214 km2 study area encompasses thermokarst lakes in the discontinuous permafrost region northwest of Fairbanks, Alaska (figure 1). This landscape is characterized by permafrost and ice wedges covering the valley bottom and north facing slopes, thermokarst lakes at toe-slopes and the valley floor, large differences in microclimates between high- and low-elevation areas, and an abundance of wetlands despite relatively low precipitation.
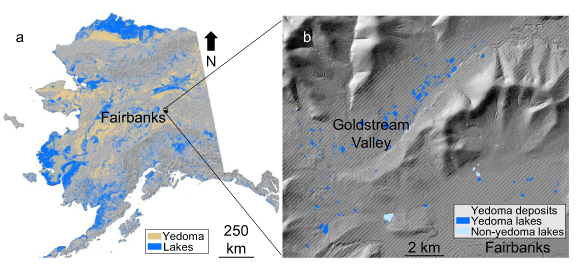
Figure 1. Map of our interior Alaska study site. Yedoma permafrost distribution is from Strauss et al (2016). Lakes >1 ha are from the USGS National Hydrography Dataset (U.S. Geological Survey 2018a). Panel (b) is a zoom to our 214 km2 study site in interior Alaska, north of Fairbanks. In (b), non-anthropogenic lakes are shown on top of the Alaska LiDAR Dataset (DGGS Staff 2013, U.S. Geological Survey 2018b).
Download figure:
Standard image High-resolution imageThe majority of thermokarst lakes in our study area formed in Pleistocene-aged yedoma permafrost soils (Kanevskiy et al 2011, 2012). Like other yedoma landscapes (Zimov et al 2006, Murton et al 2015), interior Alaska remained unglaciated during the Last Glacial Maximum (Kaufman and Manley 2004). It was dominated by graminoid-herb tundra with a cold, dry climate (Guthrie 1968, Matthews 1970). These soils formed syngenetically during the late Pleistocene; however, colluvial forces and frost action gradually retransported the late-Quaternary aeolian silt down slope during the late Pleistocene and early Holocene, forming icy, organic-rich (0.38%–6.8% C), silt-dominated permafrost deposits that are frequently 10 s to sim100 meters thick in valley bottoms (Péwé 1975, Hamilton et al 1988, Muhs and Budahn 2006, Reyes et al 2010, Kanevskiy et al 2011). Generally, silt overlies fluvial deposits, which in turn cover partially weathered, fractured schistose bedrock (Newberry et al 1996). Massive ice wedges, 2 to 4 m wide at their tops, are common (Hamilton et al 1988). Melting of ground ice commonly leads to distinct thermokarst landforms, such as gullies and thermokarst lakes.
As landscape variability has a strong impact on biogeochemical cycling (Tank et al 2020), we included some thermokarst lakes which permafrost coring (Walter Anthony et al 2016) and geologic maps (Strauss et al 2016) revealed formed in non-yedoma permafrost soils, such as thick Holocene peats (>2–3 m) or wetland deposits. Areas mined for gold and gravel since 1902 occur northeast of our study extent and in the vicinity of Fairbanks itself. We excluded anthropogenic lakes, which we define as those that were actually dug by humans. We did not differentiate between disturbance mechanisms of development of non-anthropogenic thermokarst lakes. We acknowledge that disturbances associated with early 20th century population growth (supplementary figure 1 (available online at stacks.iop.org/ERL/16/035010/mmedia)) and beavers likely changed energy balance and hydrology, leading to ground-ice melt that initiated of some of these lakes (supplementary information 2).
3. Methods
3.1. Remote sensing assessment of lake area changes
We mapped historic lake margins using high-resolution (1 m) aerial photos from 1949, 1967, and 1985 and 2009 lake margins from 2.5 m resolution Satellite Pour l'Observation de la Terre (SPOT) imagery to quantify lake area change and thermokarst shoreline expansion rates (supplementary information 1.2 and 1.3). To relate lake area changes to CH4 fluxes, we classified lakes in which one or more shoreline had retreated as 'expanded lakes' and lakes that had formed entirely since 1949 as 'new lakes.'
3.2. Field-based and remote-sensing estimation of lake ebullition
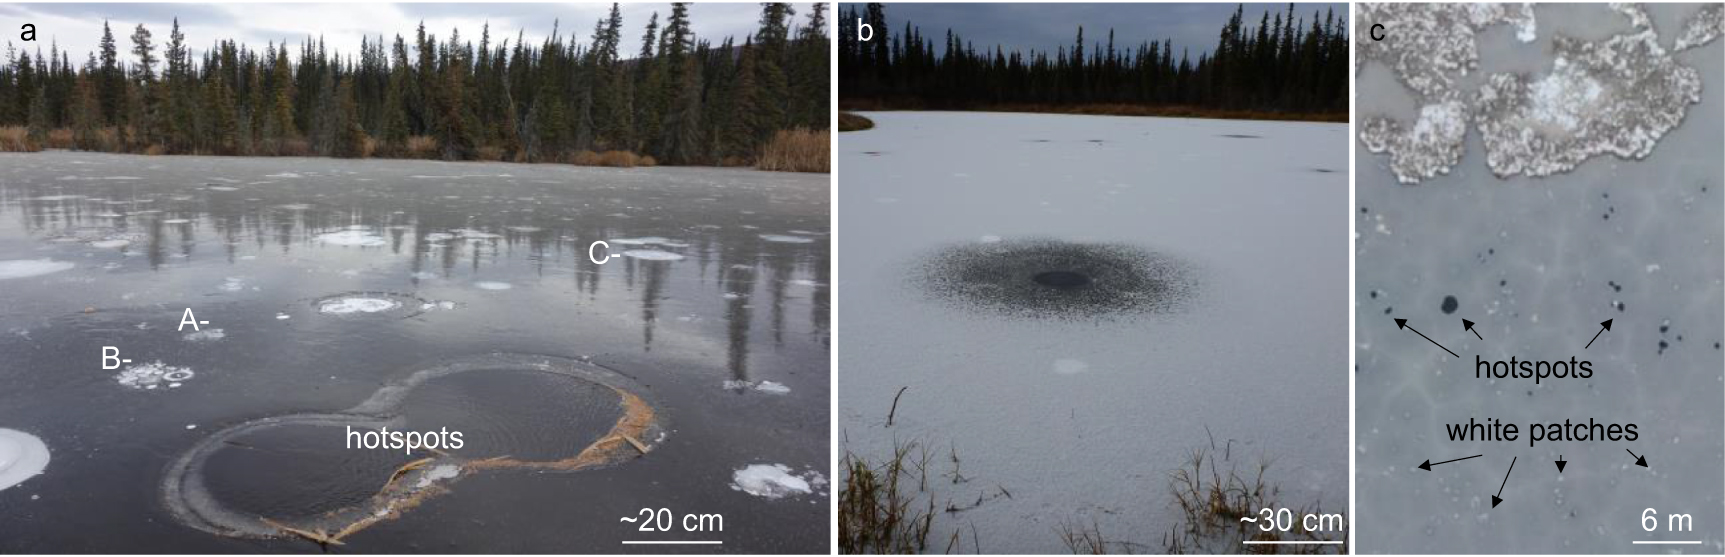
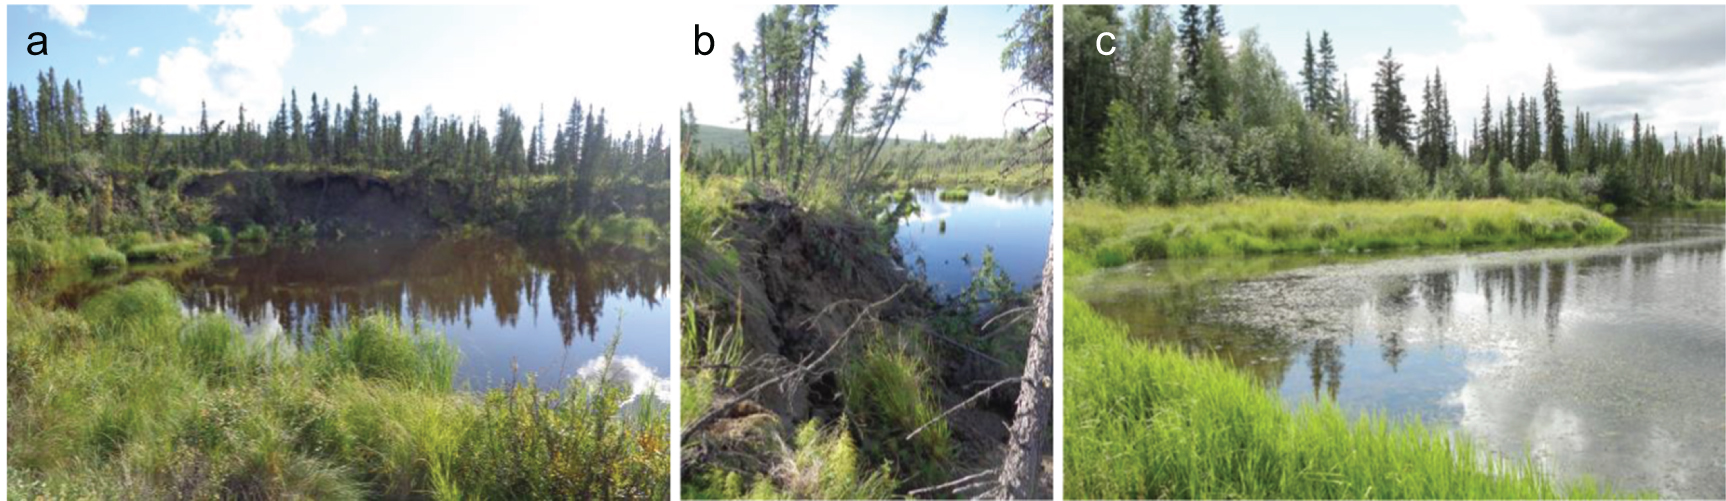
We used a combination of field measurements and remote sensing to estimate CH4 ebullition in lakes. In the field, we took advantage of seasonal ice cover on lakes to map discrete points of re-occurring ebullition (i.e. seeps) that have been shown to dominate annual CH4 emissions in yedoma thermokarst lakes (64% to 72% of total lake CH4 emissions in Siberia and Alaska; Walter et al 2006, Greene et al 2014, Sepulveda-Jauregui et al 2015). In winter, downward growing lake ice temporarily traps upward rising CH4 bubbles, revealing the locations of ebullition seeps (figure 2(a)). Due to lower ebullition rates, bubbles of A-, B-, and C-type seeps are trapped in and beneath winter lake ice. Methane that does not dissolve out of the under-ice bubbles and get oxidized in the water column is subsequently released during spring ice-melt (Greene et al 2014). The strongest seeps, termed hotspots, release CH4 to the atmosphere year-round (Walter et al 2006). Hotspots prevent ice-formation at the seep location due to water column convection caused by high bubbling rates (figure 2) (Zimov et al 2001, Greene et al 2014, Daanen 2020). Using a hand-held Garmin global positioning system (GPS) and a differential GPS (dGPS) we conducted ice-bubble surveys to map the locations of 11 696 A-, B-, C- and hotspot ebullition seeps within 92 survey transects on 29 lakes (table 1; supplementary information 1.4). Through analysis of high-resolution, early-winter aerial photos we mapped the locations of 496 open-hole hotspot seeps in 22 lakes (table 2; supplementary information 1.6). In aerial photos, dark, round hotspot holes in ice (usually <1 m diameter) had a strong contrast against white, snow-covered lake ice (figure 2(c), supplementary figure 2). On the ground, we mapped hotspots across whole-lake surfaces in 21 lakes, 14 of which were also aerially photographed. Seep bubble densities were converted to ebullition rates using a transfer function based on sim213 000 bubble-trap flux measurements associated with different seep types (Walter Anthony and Anthony 2013). Distinct ebullition events (n = 275) were sampled for analyses of gas composition, stable isotopes and radiocarbon dating (supplementary information 1.5).

Figure 2. Photographs of CH4 ebullition hotspot seeps in interior Alaska yedoma thermokarst lakes. In (a), ice-free hotspot ebullition seeps are shown in early winter prior to snowfall among other smaller seeps (A-, B-, and C-type seeps), the bubbles of which are seasonally trapped by winter lake ice and appear as white patches. In (b), a dusting of snow covers the lake ice surface, largely masking the smaller ice-trapped bubbles, but exposing with strong color contrast the open-hole CH4 hotspot seeps. The dark, round features in panel (c) are hotspot ebullition seeps as seen in aerial photographs; white patches are smaller A-, B- and C-type seeps. Photo credit: (a) Katey Walter Anthony, October 2016; (b) Guido Grosse, October 2011; and (c) Jessica Cherry, October 2014.
Download figure:
Standard image High-resolution imageTable 1. Seep ebullition fluxes from ground-based ice-bubble survey transects on 27 interior Alaska thermokarst lakes. Lake locations are shown in figure 5.
| Lake | Lake | Latitude | Longitude | Field-surveyed | Seep ebullition (L m−-2 yr−1) | Hotspot fraction of area (%) | Hotspot fraction of flux (%) | ||||||||||
|---|---|---|---|---|---|---|---|---|---|---|---|---|---|---|---|---|---|
| No. | name | (°N) | (°W) | area (m2) | Transects | Mean | SE | n lakes | Mean | SE | Mean | SE | n lakes | ||||
| Expanding lakes—Yedoma | 84.0 | ± | 12.7 | 17 | 0.002% | ± | 0.000% | 7% | ± | 2% | 15 | ||||||
| 1 | Flag | 64.9124 | −147.8570 | 100 | 2 | 2 | 0.000% | 0% | |||||||||
| 2 | Goose | 64.9128 | −147.8470 | 150 | 3 | 36 | 0.000% | 0% | |||||||||
| 3 | Deuce | 64.8637 | −147.9409 | 178 | 3 | 71 | 0.002% | 8% | |||||||||
| 4 | Cranberry | 64.9362 | −147.8207 | 275 | 6 | 48 | 0.003% | 19% | |||||||||
| 5 | Goldstream | 64.9156 | −147.8495 | 1278 | 14 | 49 | 0.005% | 26% | |||||||||
| 6 | Stephens | 64.8633 | −147.8710 | 99 | 2 | 106 | 0.004% | 15% | |||||||||
| — | North Octopus | 64.9081 | −147.8612 | 150 | 3 | 80 | — | — | |||||||||
| 7 | South Octopus | 64.9076 | −147.8608 | 148 | 3 | 177 | 0.002% | 4% | |||||||||
| — | Little Octopus | 64.9066 | −147.8585 | 48 | 1 | 170 | — | — | |||||||||
| 8 | RRold | 64.9028 | −147.9422 | 100 | 2 | 26 | 0.000% | 0% | |||||||||
| 9 | FishersPond | 64.9103 | −147.8845 | 150 | 3 | 26 | 0.001% | 7% | |||||||||
| 10 | Farmer's Loop Row | 64.8695 | −147.6849 | 94 | 2 | 139 | 0.004% | 10% | |||||||||
| 11 | Happy Crossing | 64.8864 | −147.9260 | 44 | 1 | 143 | 0.002% | 5% | |||||||||
| 12 | Big Lacey | 64.9116 | −147.8615 | 150 | 3 | 60 | 0.000% | 0% | |||||||||
| 13 | TwinFlower | 64.9334 | −147.8459 | 39 | 2 | 73 | 0.000% | 0% | |||||||||
| 14 | Caribou | 64.8792 | −147.7640 | 150 | 3 | 123 | 0.000% | 0% | |||||||||
| 15 | Vault | 65.0295 | −147.6994 | 86 | 4 | 100 | 0.004% | 14% | |||||||||
| New lakes—Yedoma | 217.2 | ± | 16.3 | 5 | 0.003% | ± | 0.000% | 5% | ± | 1% | 5 | ||||||
| 16 | Eagle | 64.9228 | −147.8160 | 97 | 1 | 225 | 0.003% | 5% | |||||||||
| 17 | Big Trail | 64.9189 | −147.8212 | 609 | 15 | 197 | 0.004% | 8% | |||||||||
| 18 | GENL3 | 64.9250 | −147.7958 | 109 | 2 | 231 | 0.002% | 4% | |||||||||
| 19 | Squid | 64.9315 | −147.7807 | 155 | 3 | 168 | 0.003% | 5% | |||||||||
| 20 | RRnew | 64.9011 | −147.9386 | 90 | 2 | 265 | 0.004% | 5% | |||||||||
| 21 | Sheep Creeka | 64.8969 | −147.9500 | 56 | 1 | 102 | 0.000% | 0% | |||||||||
| Expanding lakes—Non-yedoma | 28.2 | ± | 12.2 | 4 | 0.000% | ± | 0.000% | 0.6% | ± | 0.6% | 4 | ||||||
| 22 | Smithb | 64.8651 | −147.8637 | 153 | 3 | 4 | 0.000% | 3% | |||||||||
| 23 | Star Lakec | 64.8821 | −147.7680 | 186 | 4 | 50 | 0.000% | 0% | |||||||||
| 24 | ReindeerLake | 64.8844 | −147.7707 | 70 | 1 | 11 | 0.000% | 0% | |||||||||
| 25 | Middlec | 64.8830 | −147.7690 | 36 | 1 | 48 | 0.000% | 0% | |||||||||
| New lakes—Non-yedoma | 58.7 | ± | 14.3 | 2 | 0.000% | ± | 0.000% | 0.0% | ± | 0.0% | 2 | ||||||
| 26 | Star Pond NEc | 64.8825 | −147.7666 | 23 | 1 | 79 | 0.000% | 0% | |||||||||
| 27 | Star Pond SWc | 64.8823 | −147.7670 | 26 | 1 | 39 | 0.000% | 0% | |||||||||
aSheep Creek Pond was not included in calculation of the mean flux from new yedoma thermokarst lakes. It is an outlier pond that formed in a topographic depression following agricultural clearing. Unlike other new lakes in yedoma, it is abnormally shallow (<70 cm) and lacks evidence of ground ice melt or thermokarst activity (see supplementary information). bPermafrost cores taken in the SW margin of Smith Lake in an area of thermokarst expansion consisted of 270 cm of ice-rich peat. Carex spp. seeds taken from sedge peat at 270 cm had a 14C-age of 6170 ± 25 14C years BP (uncalibrated). The 14CCH4 age of hotspot bubbles collected in the lake along this thermokarst margin was 2450 ± 25 14C years BP (Walter Anthony et al 2016). Alexander and Barsdate (1971) inferred a cryogenic (thermokarst) lake origin; however, V. Alexander suggested it may also have been influenced by ancient fluvial processes based on its landscape position (pers. comm. July 2009). Stevens Pond, located 200 m to the SW of Smith Lake with a surface elevation several meters above Smith Lake showed rapid historical thermokarst expansion into icy, silt-rich sediments; 14CCH4 in hotspot bubbles from Stevens Pond was 30 700 ± 130 years BP (Walter Anthony et al 2016). This suggests Smith Lake is located very near the boundary of intact yedoma permafrost, into which Stevens Pond is expanding. cA 375 cm permafrost core obtained between Star and Middle Lakes consisted of 35 cm of peat overlying a layer of well-preserved wood and bark of Alaska paper birch (Betula neoalaskana). Beneath this was banded, icy, organic-rich silt with coarse wood (2–10 cm diameter) and abundant shells.
Table 2. Aerial photo study lake locations and metadata; quantified remote-sensing errors associated with image orthorectification (root mean square, RMS) and minimum error distance (MED); and number of hotspots detected in field and remote sensing (RS) approaches. Aerial photos are all from 8 October 2014.
| Lake No. | Lake name | Lake type | Latitude (°N) | Longitude (°W) | Field GPS type | Field data acquisition date (mm/dd/yy) | Number field-detected hotspots | Ortho-rectification RMS error (m) | MED (m) | Number RS-detected hotspots |
|---|---|---|---|---|---|---|---|---|---|---|
| 1 | Flag | Expanded yedoma | 64.9120 | −147.8570 | Garmin | 11-1-18 | 0 | 2.13 | 0 | |
| 2 | Goose | Expanded yedoma | 64.9127 | −147.8470 | Garmin | 10-20-19 | 0 | 1.89 | 0 | |
| 3 | Deuce | Expanded yedoma | 64.8638 | −147.9396 | Garmin | 4-29-11 | 57 | 2.16 | 31 | |
| 4 | Cranberry | Expanded yedoma | 64.9370 | −147.8201 | DGPS | 10-25-13 | 22 | 1.95 | 1.96 | 17 |
| 5 | Goldstream | Expanded yedoma | 64.9157 | −147.8481 | DGPS | 4-27-12 | 71 | 1.03 | 1.06 | 54 |
| 6 | Stephens | Expanded yedoma | 64.8631 | −147.8714 | DGPS | 10-21-14 | 20 | 2.14 | 2.16 | 19 |
| 7 | Octopus | Expanded yedoma | 64.9075 | −147.8599 | DGPS | 10-21-14 | 42 | 1.78 | 1.80 | 40 |
| 14 | Caribou | Expanded yedoma | 64.8786 | −147.7648 | DGPS | 10-25-16 | 0 | 1.23 | 1.26 | 0 |
| 28 | Doughnut | Expanded yedoma | 64.8975 | −147.9089 | DGPS | 10-16-16 | 7 | 1.95 | 1.96 | 1 |
| 22 | Smith* | Expanded non-yedoma | 64.8651 | −147.8637 | — | — | 4 | 2.14 | 3 | |
| 23 | Star* | Expanded non-yedoma | 64.8821 | −147.7680 | DGPS | 10-25-16 | 0 | 2.14 | 2.15 | 0 |
| 24 | Reindeer* | Expanded non-yedoma | 64.8844 | −147.7707 | — | — | — | 1.22 | 3 | |
| 29 | Roxie | Expanded non-yedoma | 64.8682 | −147.9198 | Garmin | 4-12-19 | 0 | 0.78 | 0 | |
| 16 | Eagle | New yedoma | 64.9233 | −147.8157 | DGPS | 10-18-16 | 45 | 2.17 | 2.18 | 43 |
| 17 | Big Trail | New yedoma | 64.9193 | −147.8210 | DGPS | 10-20-14 | 195 | 3.02 | 3.03 | 198 |
| 18 | GENL3 | New yedoma | 64.9250 | −147.7957 | DGPS | 10-17-16 | 8 | 1.65 | 1.66 | 8 |
| 30 | GENL1 | New yedoma | 64.9200 | −147.8133 | — | — | — | 1.78 | 33 | |
| 31 | GENL2 | New yedoma | 64.9245 | −147.8106 | — | — | — | 2.85 | 31 | |
| 32 | GWNL1 | New yedoma | 64.9099 | −147.8489 | — | — | — | 2.30 | 4 | |
| 33 | GWNL2 | New yedoma | 64.8985 | −147.9135 | — | — | — | 2.81 | 0 | |
| 34 | GWNL4 | New yedoma | 64.8997 | −147.9191 | — | — | — | 3.01 | 0 | |
| 35 | Snoopy | New yedoma | 64.9253 | −147.8124 | — | — | — | 1.60 | 11 |
3.3. Remote-sensing and ebullition data corroboration using geophysics at two intensive study lakes
We compared spatiotemporal hotspot ebullition patterns and radiocarbon ages to taliks mapped with geophysical surveys (supplementary information 1.8) and lake sediment coring (supplementary information 1.9) at two intensive study lakes, Goldstream Lake (expanding lake) and Big Trail Lake (new lake) in a similar geologic setting.
Statistical methods are provided in supplementary information 1.10.
4. Results
4.1. Lake change and associated CH4 ebullition
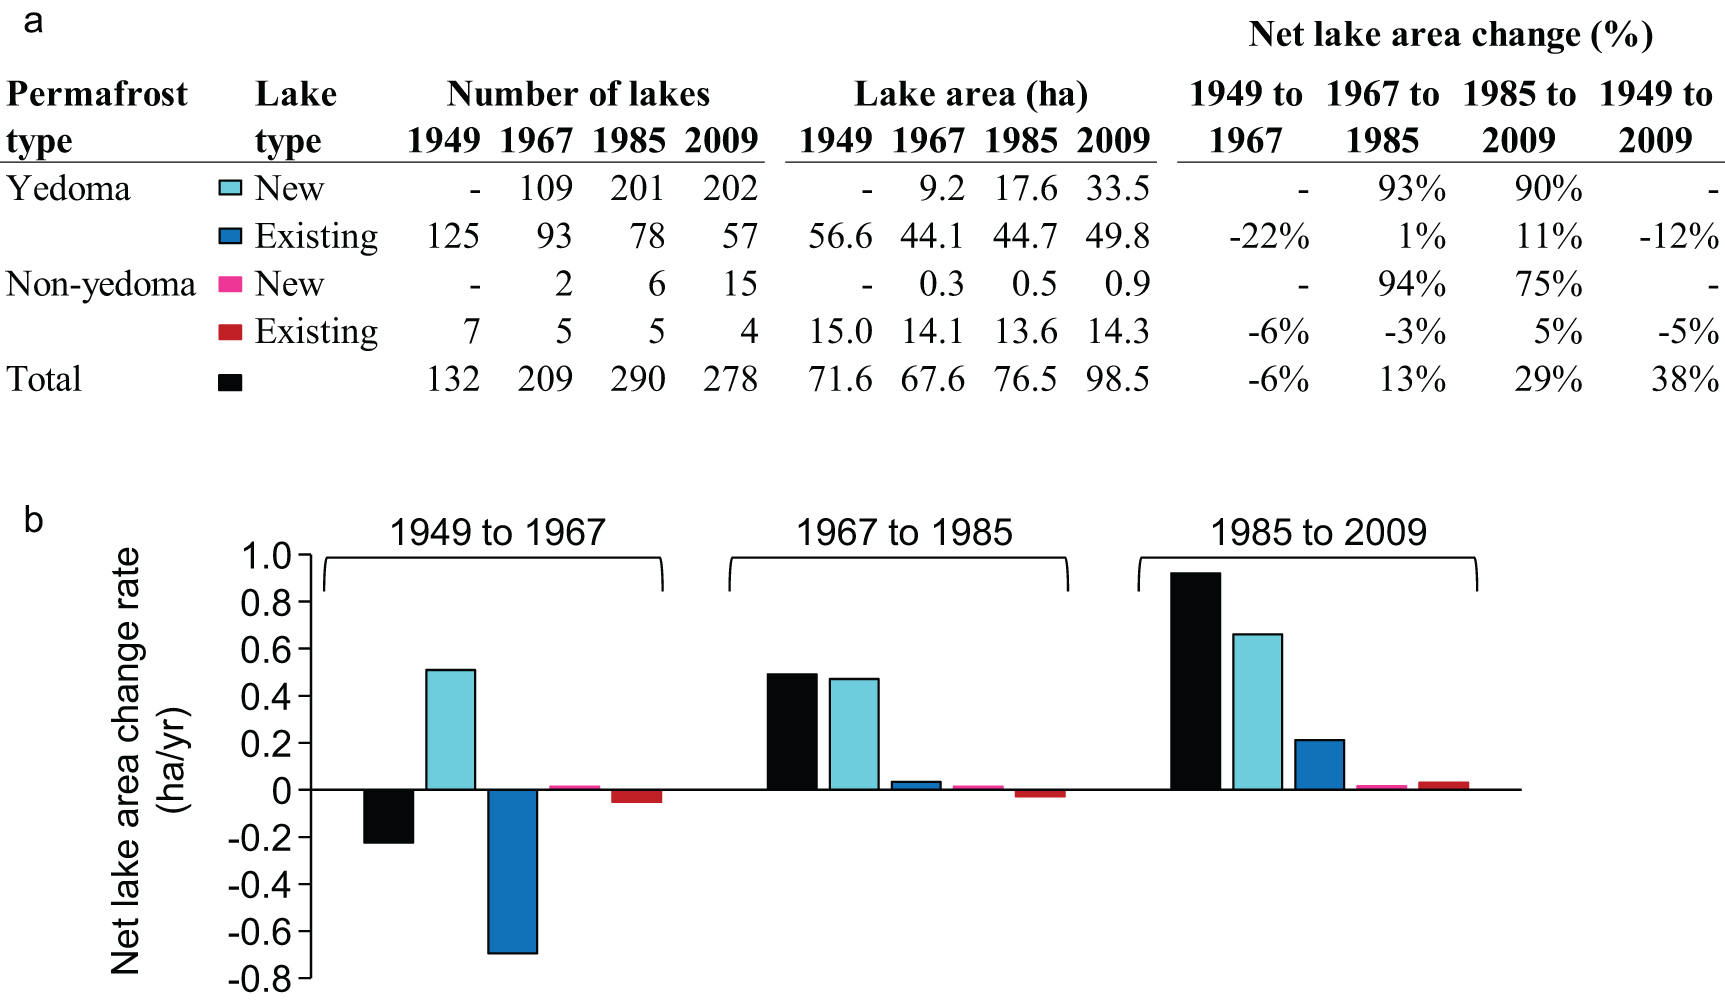
The number of lakes in our study area identified in high resolution imagery more than doubled from 1949 (132 lakes) to 2009 (278 lakes). Formation of 202 new lakes in yedoma permafrost deposits offset the disappearance of 71 existing lakes (figure 3(a)). Fifteen non-yedoma lakes formed between 1949 and 2009, offsetting the drainage of three existing lakes and doubling the total number of non-yedoma lakes in the study extent. Non-yedoma lakes comprised 6.8% of the 278 lakes in 2009.
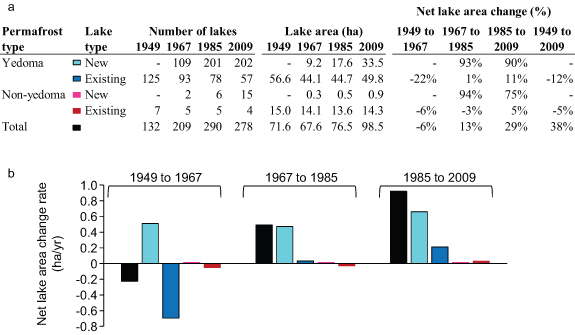
Figure 3. Multi-temporal changes in the number and area of lakes in the 214 km2 interior Alaska study extent from 1949 to 2009 for new and existing lakes formed in yedoma and non-yedoma permafrost types. Panel (a) shows the number, area, and percent change in net lake area; panel (b) shows the rate of change for different classes of lakes calculated as the net change divided by the number of years across the three intervening study periods.
Download figure:
Standard image High-resolution imageTotal lake area growth accelerated from 1949 to 2009 (figure 3(b)). New lakes comprised 35% of total lake area in 2009, compensating for shrinkage and drainage of some existing lakes and contributing to a net lake area increase of 37.5% from 1949 (71.6 ha) to 2009 (98.5 ha).
Changes in lake number and area across the remote sensing time series (figure 4.) highlight the dynamics associated with recently developed thermokarst lakes in ice-rich permafrost in the study area. Lakes larger than 5 ha remained fairly stable between 1949 and 2009. Exceptional lake area expansion occurred in the 2.5–5 ha class between 1967 and 1985, and a large increase in lake number occurred in the 1.0–2.5 ha size class during the following time period (supplementary information 1.10). The observed lake dynamics highlight the role of recently formed and maturing lakes on the spatio-temporal patterns of CH4 ebullition identified in the study area.
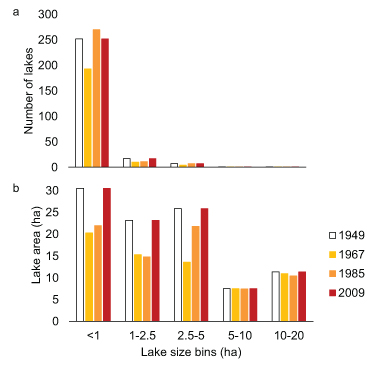
Figure 4. Lake number (a) and area (b) by size class across different years.
Download figure:
Standard image High-resolution image
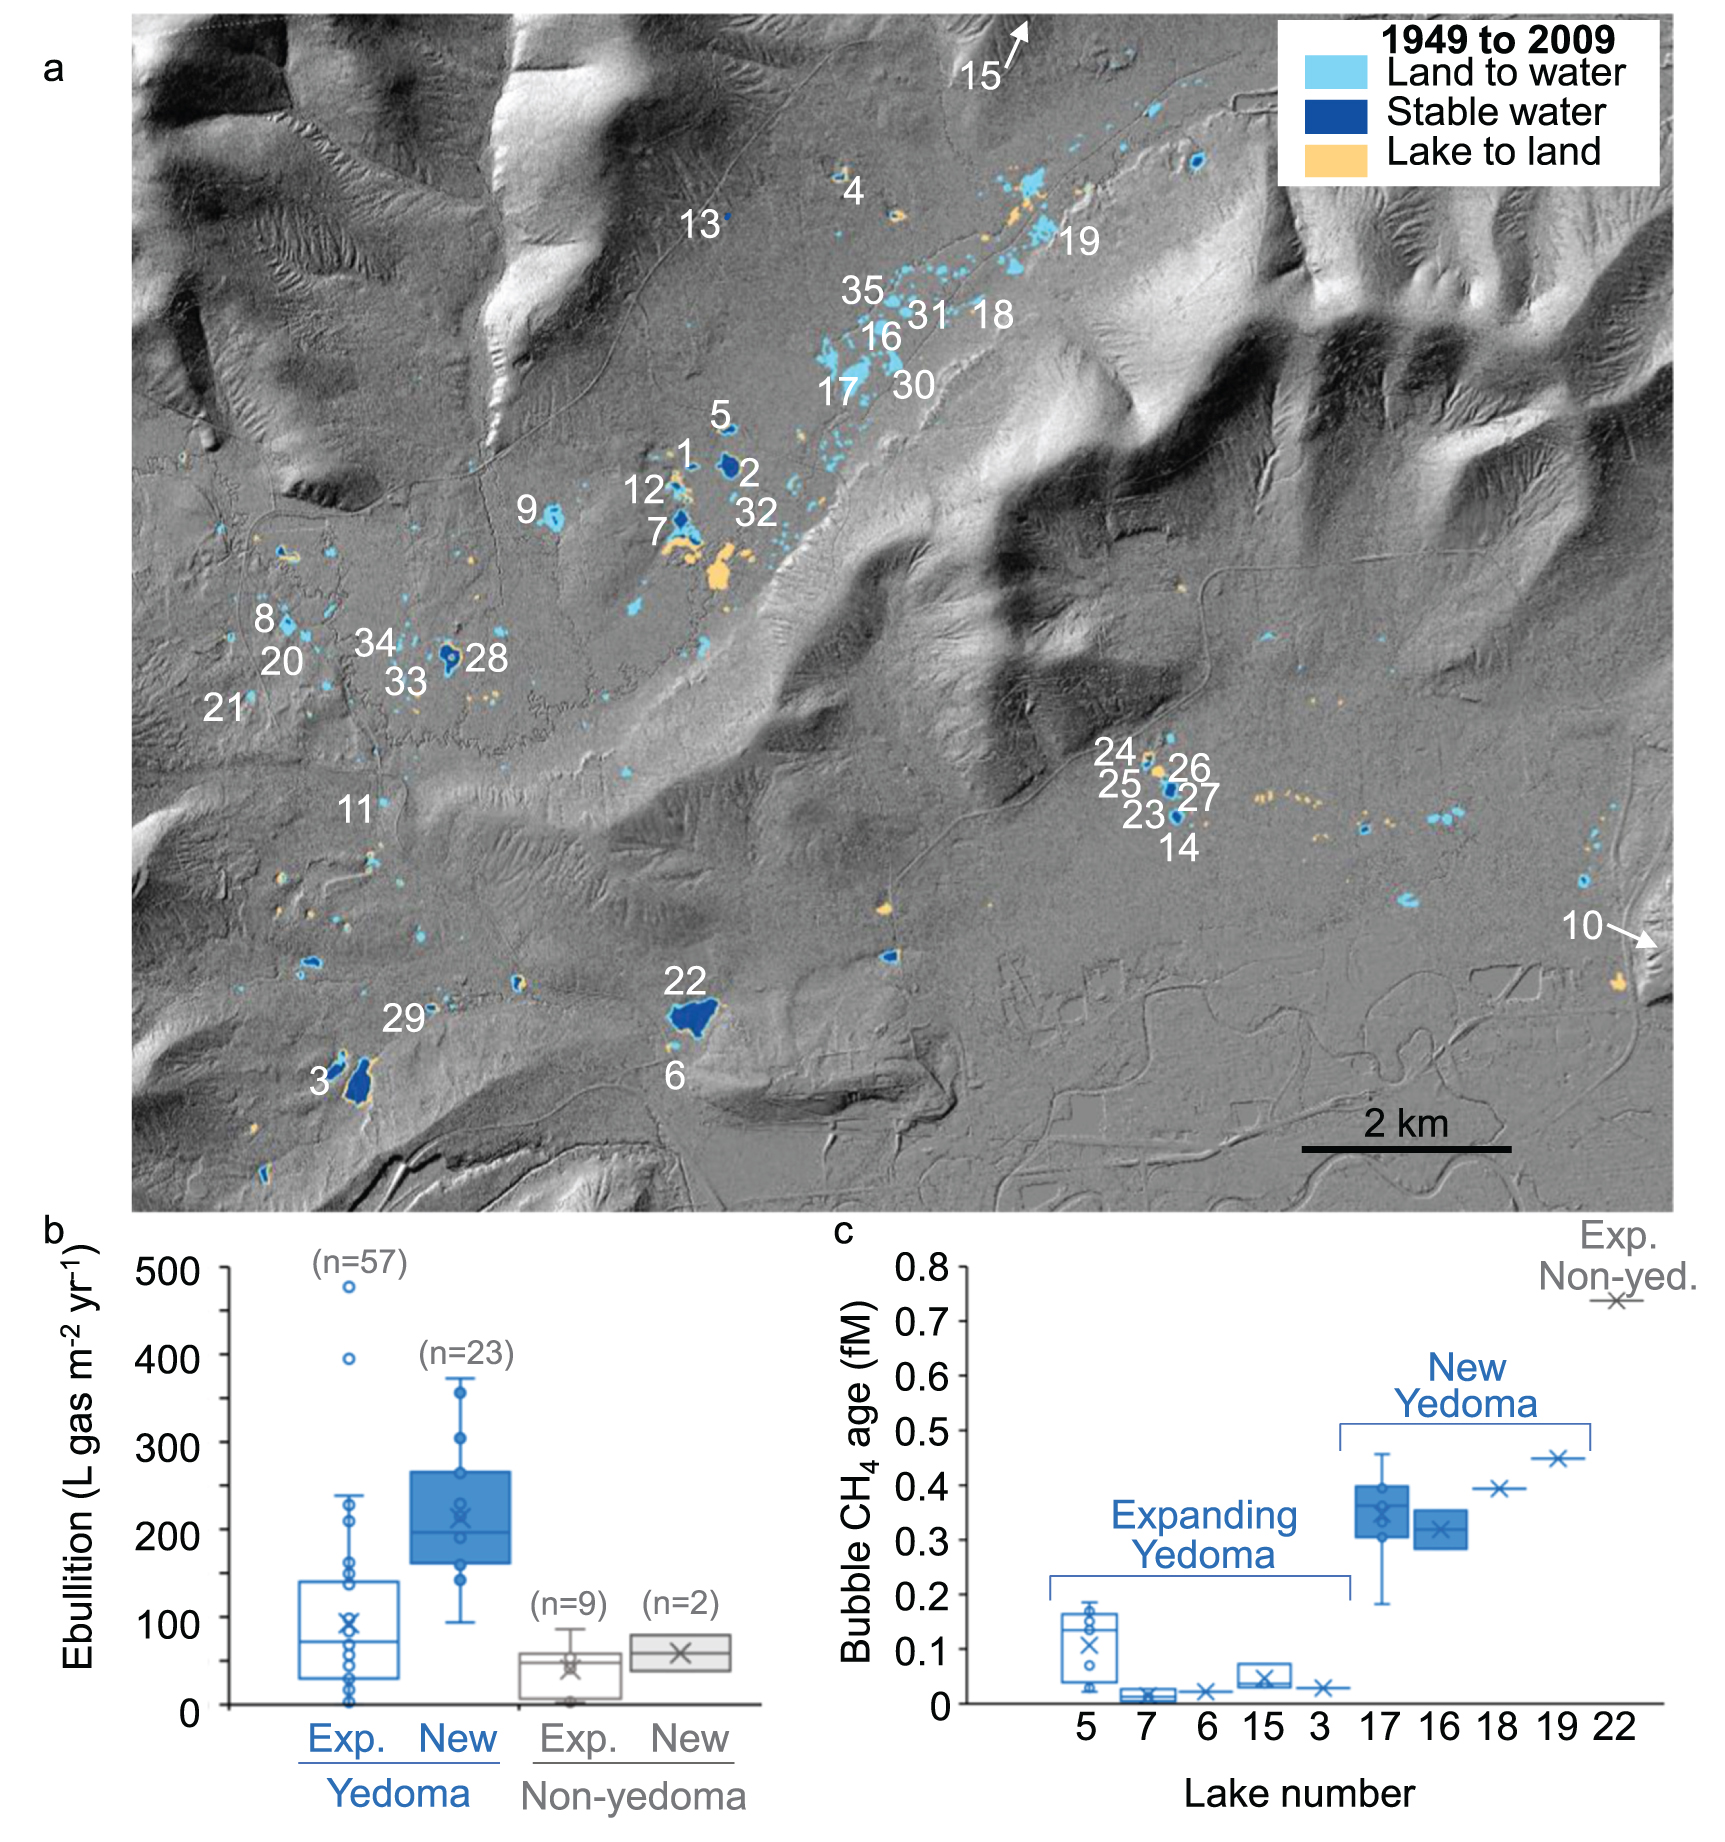
Figure 5. Methane ebullition in expanding and new thermokarst lakes in interior Alaska. In the map (panel a), new open water lake areas identified as a transition from land in 1949 historical aerial photography to open water in 2009 SPOT imagery, are shown in turquoise; areas of lake loss during that period are shown in orange; and stable open water lake areas are in blue. Anthropogenic lakes dug by humans (e.g. gravel pits) were excluded from our analysis. Panel (b) shows CH4 ebullition observed on the ground along ice-bubble survey transects (n = number of transects). In (c), dots are 14CCH4 ages, expressed as fraction of modern carbon (fM), observed in individual hotspot-seep ebullition events. Boxplots show the minimum, first quartile, median, mean, third quartile, and maximum values. There were two outliers of exceedingly high ebullition in expanding lakes; these transects were located in new areas of expanding thermokarst lakes. Numbers in (a) indicate locations of study lakes listed in tables 1 and 2. The background image in (a) is a hillshade derived from a digital terrain model created with 2017 q11 and q12 Lidar data (DGGS Staff 2013).
Download figure:
Standard image High-resolution imageThe average expansion rate of shorelines in lakes that existed prior to 1949 was 0.27 ± 0.09 m yr−1 (mean ± standard deviation) for yedoma lakes and 0.27 ± 0.08 m yr−1 for non-yedoma lakes (1949–2009 period). Expansion rates of new yedoma lakes, which formed after 1949, were 0.63 ± 0.27 m yr−1.
Ebullition fluxes estimated from ice-bubble surveys of A-, B-, C- and hotspot seeps coupled to bubble-trap fluxes revealed >2 times higher ebullition in new lakes compared to older, expanding lakes in both yedoma and non-yedoma permafrost soil types (table 1; Welch two-sample test, p < 0.001). Ebullition in yedoma lakes was 3.0-fold and 3.7-fold higher than in non-yedoma lakes for new lakes and expanding lakes, respectively (Two-sample test, p < 0.001).
In new yedoma thermokarst lakes, hotspot seeps, which were ⩽0.004% of lake area (based on bubble-cluster diameter of sim5 cm measured with a 1 cm grid at the lake surface; ten seeps measured on two lakes) comprised 5 ± 1% of total lake seep ebullition. In older expanding yedoma thermokarst lakes, hotspot seeps, which were ⩽0.005% of total lake area, were 7 ± 2% of total lake seep ebullition (table 1). Hotspot density was nearly two times higher in the new thermokarst areas compared to stable open water areas that were already lakes in 1949 (table 3). Only one of the five non-yedoma lakes had hotspots (table 1), and hotspot density in the expanded area of this lake was 4–6 times lower than in new yedoma lake areas (table 3).
Table 3. Hotspot density calculated as the quotient of total number of hotspot seeps and total area surveyed in field work. The 1949 shorelines delineated 'new' lake zones from 'stable' lake zones.
| Permafrost type | Lake type | Lake zone | Area surveyed (m2) | Number of hotspot seeps | Hotspot density (seeps/100 m2) | n lakes |
|---|---|---|---|---|---|---|
| Yedoma | Expanded | Stable | 1,12 501 | 144 | 0.13 | 12 |
| New | 50 504 | 121 | 0.24 | 12 | ||
| Yedoma | New | New | 83 202 | 294 | 0.35 | 5 |
| Yedoma | New (without Big Trail L.) | New | 35 102 | 99 | 0.28 | 4 |
| Non-yedoma | Expanded | Stable | 1,08,429 | 2 | <0.002 | 1 |
| New | 3651 | 2 | 0.05 | 1 | ||
| Non-yedoma | New | New | 564 | 0 | 0 | 2 |
Methane dominated ebullition bubbles (sim80% by volume), while bubble CO2 concentrations were typically 1% to 2%. Bubble CH4 concentration did not significantly vary by lake type, but it was higher in hotspot seep bubbles compared to non-hotspot-seep bubbles (ANOVA; p < 0.001) (table 4). Carbon stable isotope values of CH4 (δ13CCH4: −77‰ to −54‰, min to max) were consistent with microbial methanogenesis. The radiocarbon age of CH4 (14CCH4) in hotspot seeps was younger for new yedoma lakes (8526 ± 741 14C years BP) compared to expanding yedoma lakes (20 079 ± 1227 14C years BP) (table 4). 14CCH4 in non-hotspot seeps of expanding yedoma lakes were younger (7473 ± 1762 14C years BP) than from hotspots in these lakes. Non-hotspot seeps were also younger in new yedoma lakes (4742 ± 803 14C years BP) compared to hotspots in new lakes. Non-yedoma lake hotspots had the youngest 14CCH4 age (2450 ± 25 14C years BP).
Table 4. Interior Alaska thermokarst-lake bubble-gas composition, stable isotopes and radiocarbon. Sample size, n, represents the number of unique ebullition events measured. In columns *, different letters indicate a significant difference among groups within individual bubble constituents (p < 0.001). Radiocarbon ages of CH4 in parentheses are the maximum and minimum values.
| Bubble | Hotspots | Other seeps | ||||||||||
|---|---|---|---|---|---|---|---|---|---|---|---|---|
| constituent | Lake type | Mean | ± | SE | n | * | Mean | ± | SE | n | * | |
| CH4 | (%) | Expanding yedoma | 81.4 | ± | 1.6 | 152 | a | 72.8 | ± | 2.5 | 84 | b |
| New yedoma | 81.1 | ± | 1.5 | 19 | ab | 79.7 | ± | 1.9 | 18 | ab | ||
| Expanding non-yedoma | 77.9 | ± | 6.6 | 2 | ab | — | ||||||
| CO2 | (%) | Expanding yedoma | 1.0 | ± | 0.2 | 143 | a | 0.6 | ± | 0.0 | 83 | a |
| New yedoma | 1.4 | ± | 0.3 | 19 | a | 1.2 | ± | 0.5 | 4 | a | ||
| Expanding non-yedoma | 2.1 | ± | 0.5 | 2 | a | — | ||||||
| N2 | (%) | Expanding yedoma | 15.0 | ± | 1.1 | 151 | a | 23.9 | ± | 1.9 | 84 | b |
| New yedoma | 13.4 | ± | 2.9 | 6 | ab | 16.2 | ± | 1.6 | 18 | ab | ||
| Expanding non-yedoma | 21.3 | ± | 6.5 | 2 | ab | — | ||||||
| CH4:N2 | Expanding yedoma | 8.0 | ± | 0.3 | 151 | a | 6.5 | ± | 1.7 | 84 | a | |
| New yedoma | 7.5 | ± | 1.5 | 6 | a | 5.6 | ± | 0.5 | 18 | a | ||
| Expanding non-yedoma | 4.7 | ± | 1.8 | 2 | a | — | ||||||
| δ13CCH4 (‰) | Expanding yedoma | −70.5 | ± | 0.4 | 127 | a | −65.2 | ± | 0.7 | 78 | b | |
| New yedoma | −67.0 | ± | 1.2 | 17 | b | −64.5 | ± | 1.1 | 18 | b | ||
| Expanding non-yedoma | −66.9 | ± | 4.2 | 2 | ab | — | ||||||
| 14CCH4 | (fM) | Expanding yedoma | 0.08 | ± | 0.01 | 28 | a | 0.39 | ± | 0.08 | 15 | bc |
| (14C years BP) | 20 079 | ± | 1227 | 7473 | ± | 1762 | ||||||
| (13 550–43 200) | (515–28 500) | |||||||||||
| (fM) | New yedoma | 0.35 | ± | 0.03 | 8 | b | 0.55 | ± | 0.05 | 11 | c | |
| (14C years BP) | 8526 | ± | 741 | 4742 | ± | 803 | ||||||
| (6290–13 650) | (1580–12 250) | |||||||||||
| (fM) | Expanding non-yedoma | 0.74 | 1 | bc | ||||||||
| (14C years BP) | 2450 | ± | 25 | |||||||||
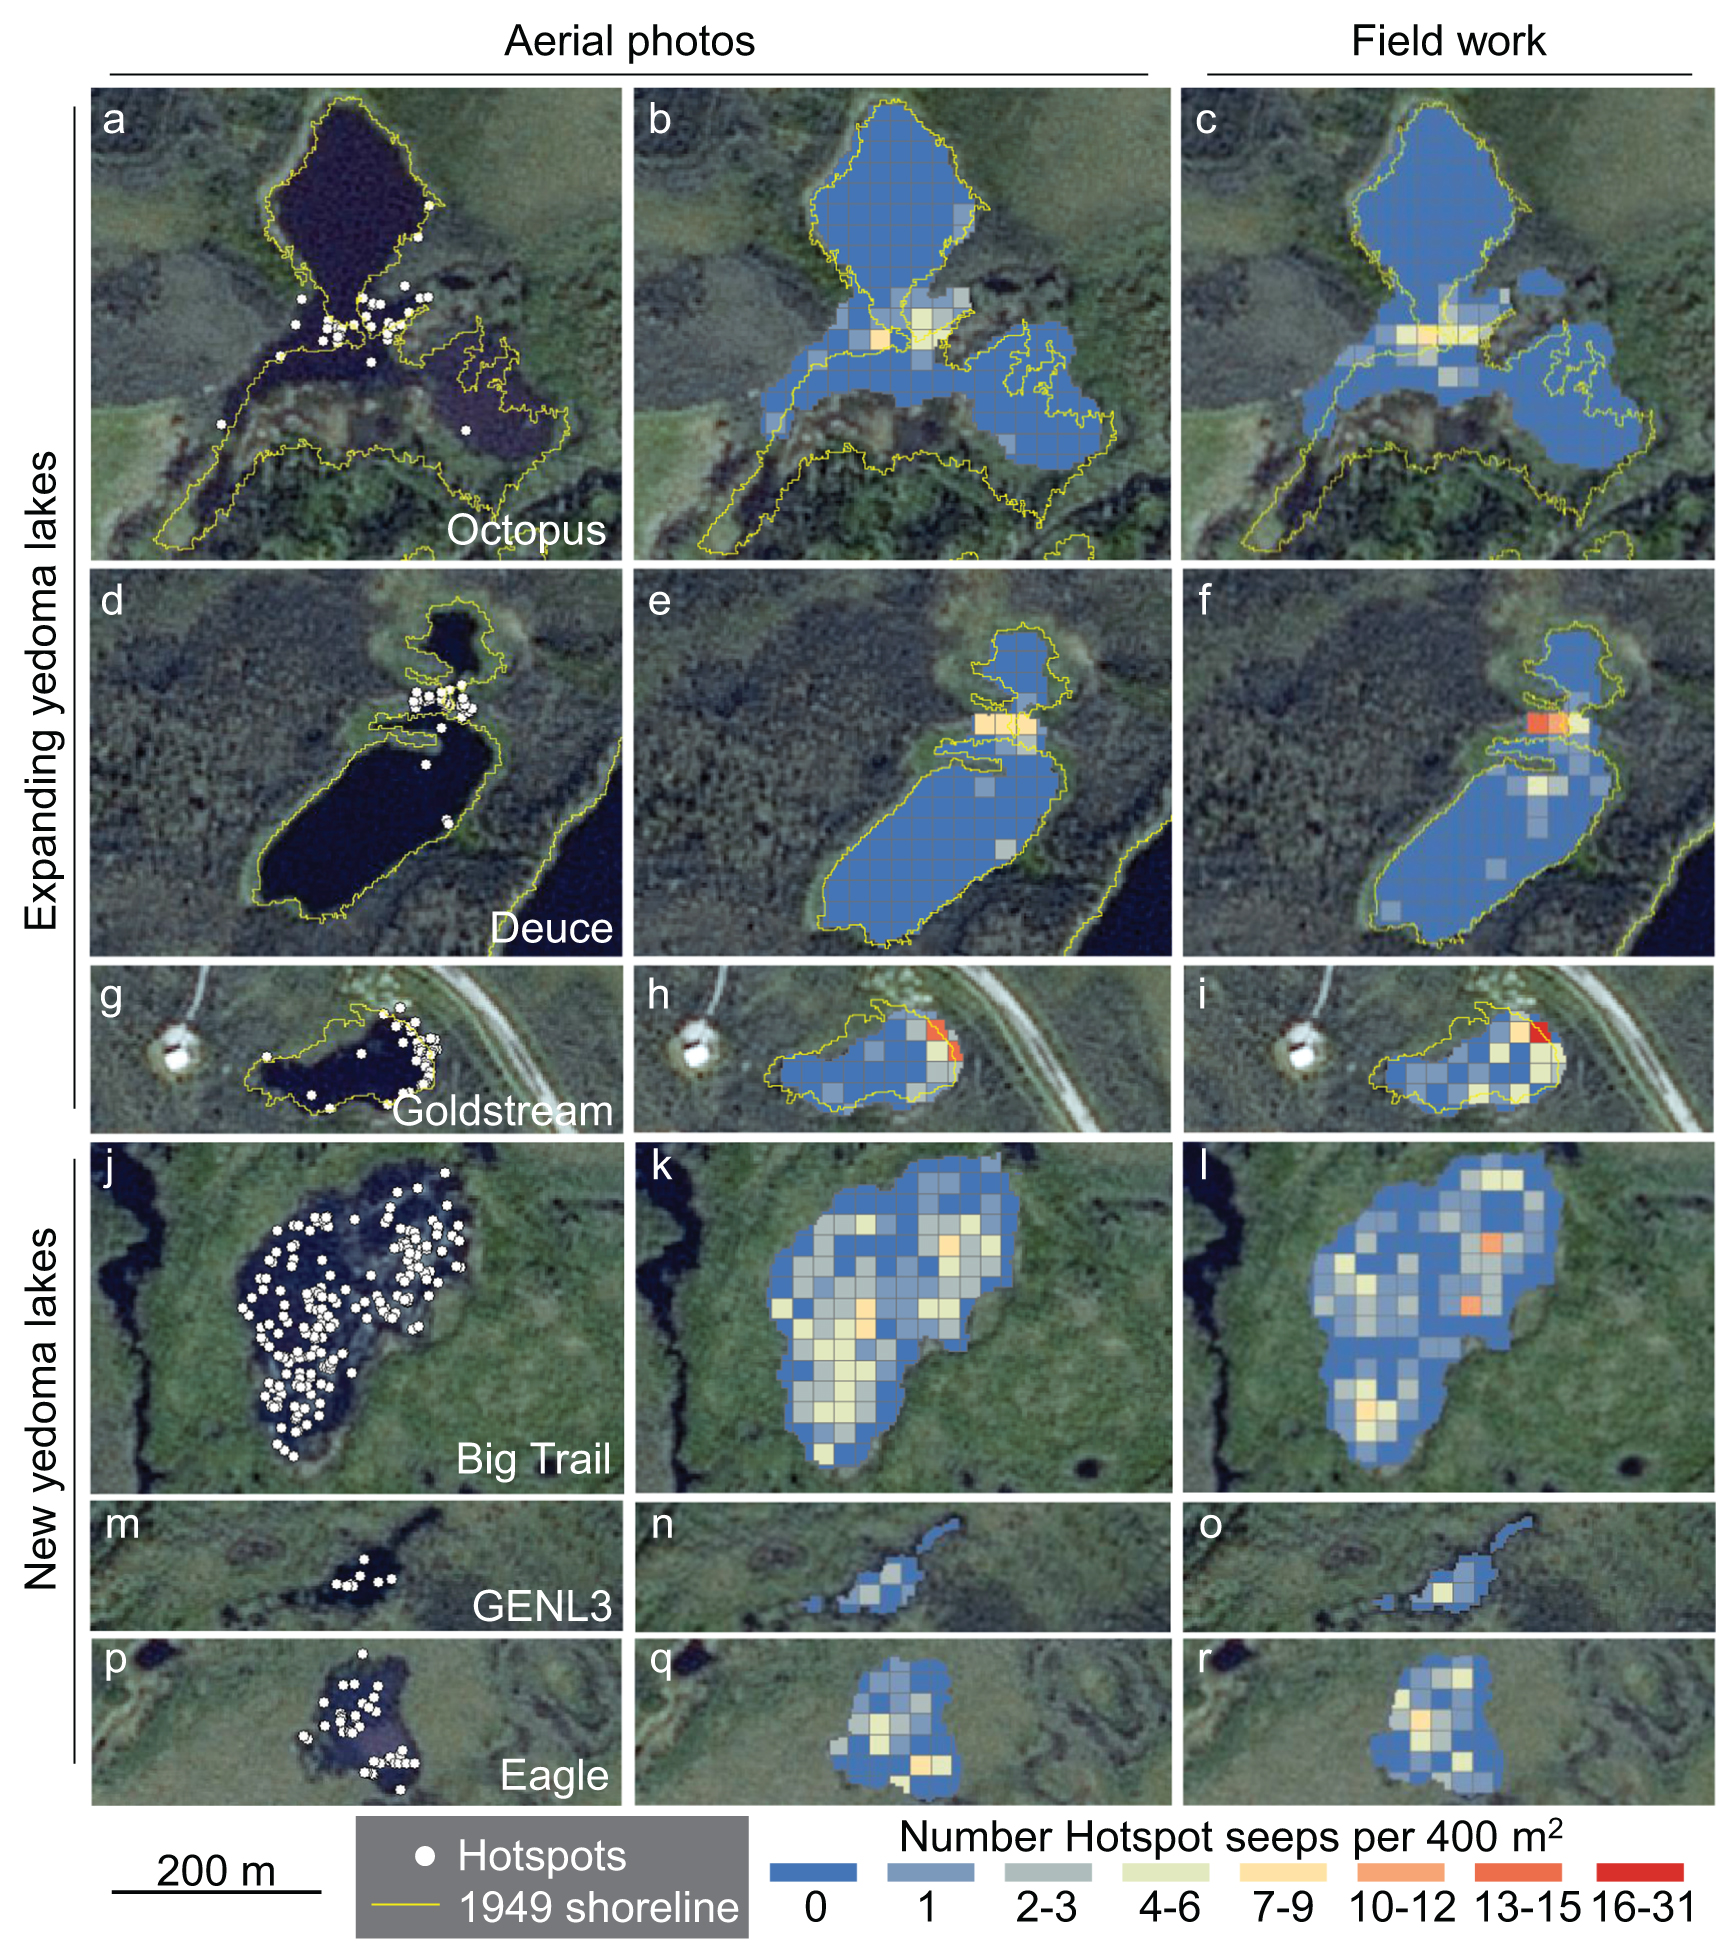
Spatial patterns of hotspot seeps derived from aerial photo analysis were highly correlated with those based on ground surveys (Kendall's rank correlation tau = 0.6277; p < 0.0001) (figure 6, supplementary figures 3–5). In expanding yedoma lakes, hotspots were most common near the shorelines that had changed from land to open water since 1949. We observed hotspots across much of the lake surfaces in new yedoma lakes. Very few hotspots were observed in non-yedoma lakes, regardless of lake expansion. Figure 7 shows photographs of expanding and stable interior Alaska lake shorelines.

Figure 6. Examples of CH4 hotspot-seep patterns in two interior Alaska yedoma lake classes: Expanding lakes (a)–(i) and new thermokarst lakes (j)–(r). Despite significant lake area loss along some shorelines of lakes existing in 1949 (e.g. Octopus L., Goldstream L.), these lakes were categorized as 'expanding' due to our focus on relating CH4 ebullition to those shorelines that did expand. Left-column panels show locations of hotspot seeps (white dots) mapped from high resolution aerial photos obtained on 8 October 2014. Yellow lines are the 1949 shorelines shown on top of 2009 SPOT imagery. Hotspot seep densities in 400 m2 pixels are shown based on aerial photo analysis (middle column panels) and ground-based field surveys (right column panels). See supplementary figures 3–5 for additional lakes.
Download figure:
Standard image High-resolution image
Figure 7. Photographs showing examples of eroding thermokarst margins (a), (b) and a stable margin (c) in interior Alaska thermokarst lakes. Photo credit: Katey Walter Anthony.
Download figure:
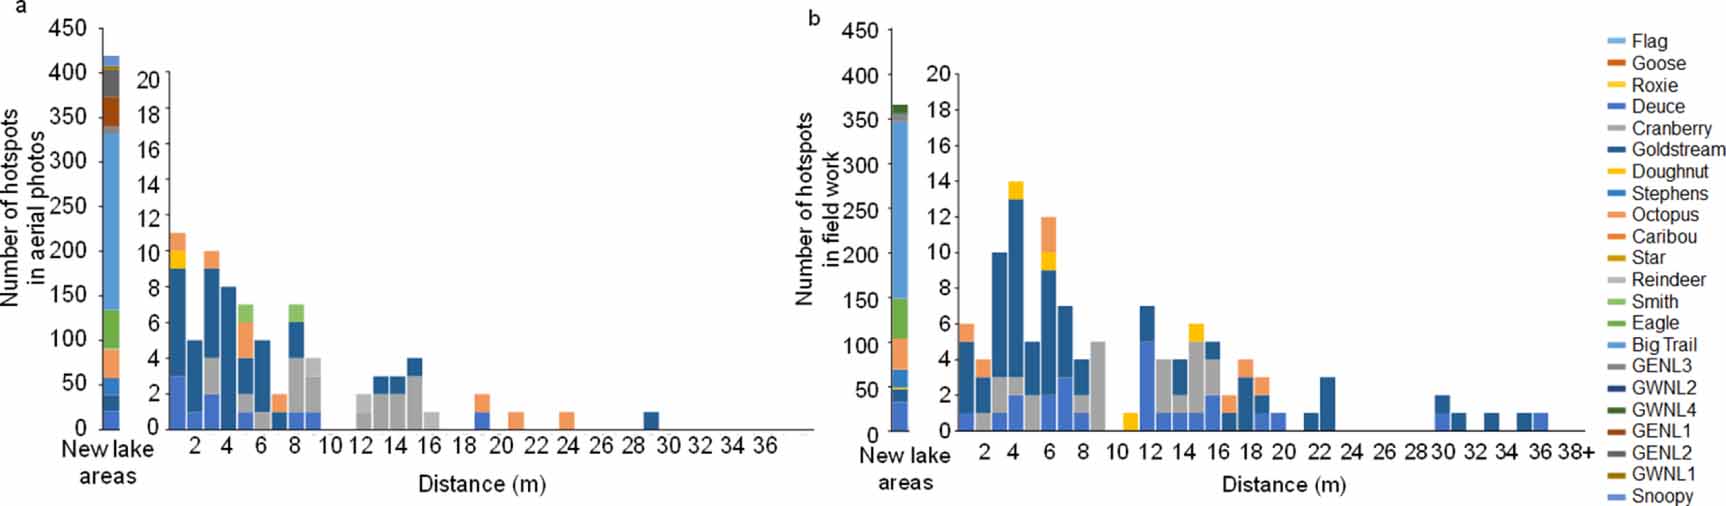
Standard image High-resolution imageOf the lake hotspot seeps identified through our remote sensing analysis, 86% (76% in field work, FW) occurred in areas of lakes that had changed from land to water between 1949 and 2009, with the remaining 14% (24% FW) occurring within 29 m (36 m FW) of the 1949 shoreline towards the center of the lake (figures 8(a) and (b)). Excluding Big Trail Lake, a large new lake with sim200 hotspots, we found hotspots were still predominately (78% and 60%) in newly formed lake areas based on aerial photo and field work measurements, respectively.

Figure 8. Proximity of CH4 ebullition hotspots to expanding thermokarst-lake shorelines detected through aerial photo analysis (a) and field work (b). Horizontal-axis values are the distance of hotspots lakeward from the 1949 shoreline. Shown on a separate scale are the total number of hotspots detected inside new lake areas. New lake areas include areas inside thermokarst expansion zones and new lakes (i.e. areas of lakes in 2009 that were land in 1949). Results highlight the proximity to recent thermokarst as a key control on hotspot ebullition CH4 seepage.
Download figure:
Standard image High-resolution image4.2. Talik depth relationship to abrupt-thaw CH4 ebullition in two intensive study lakes
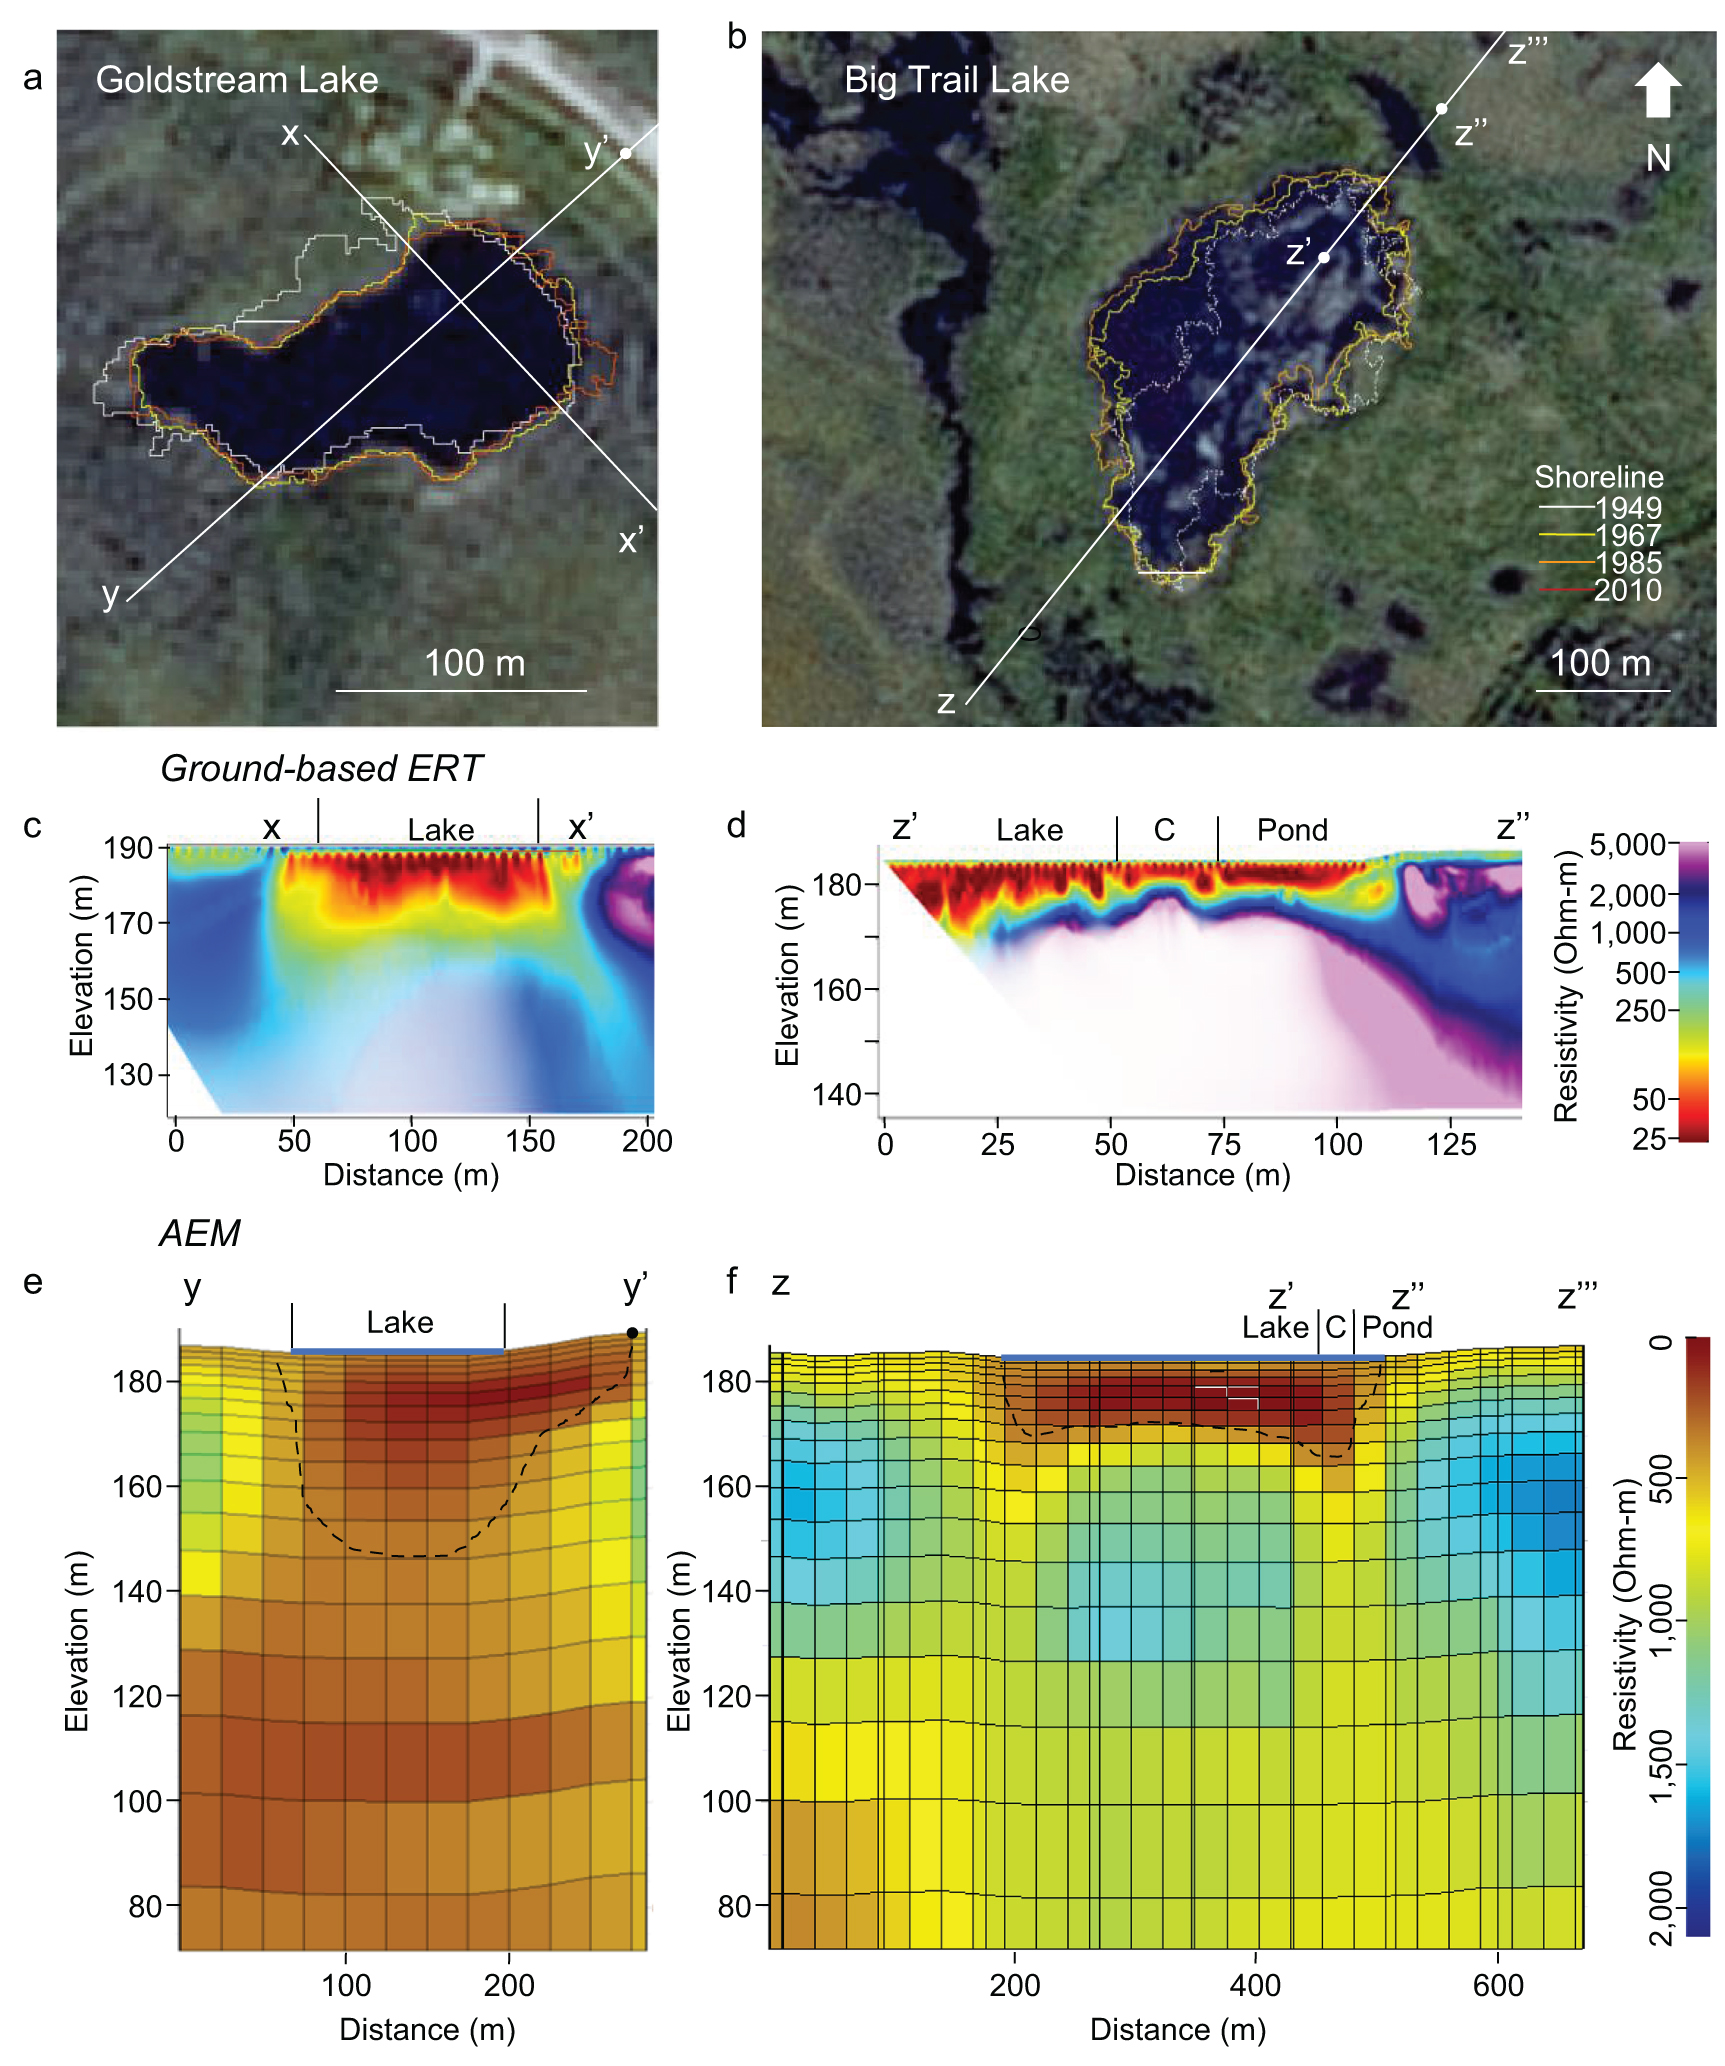
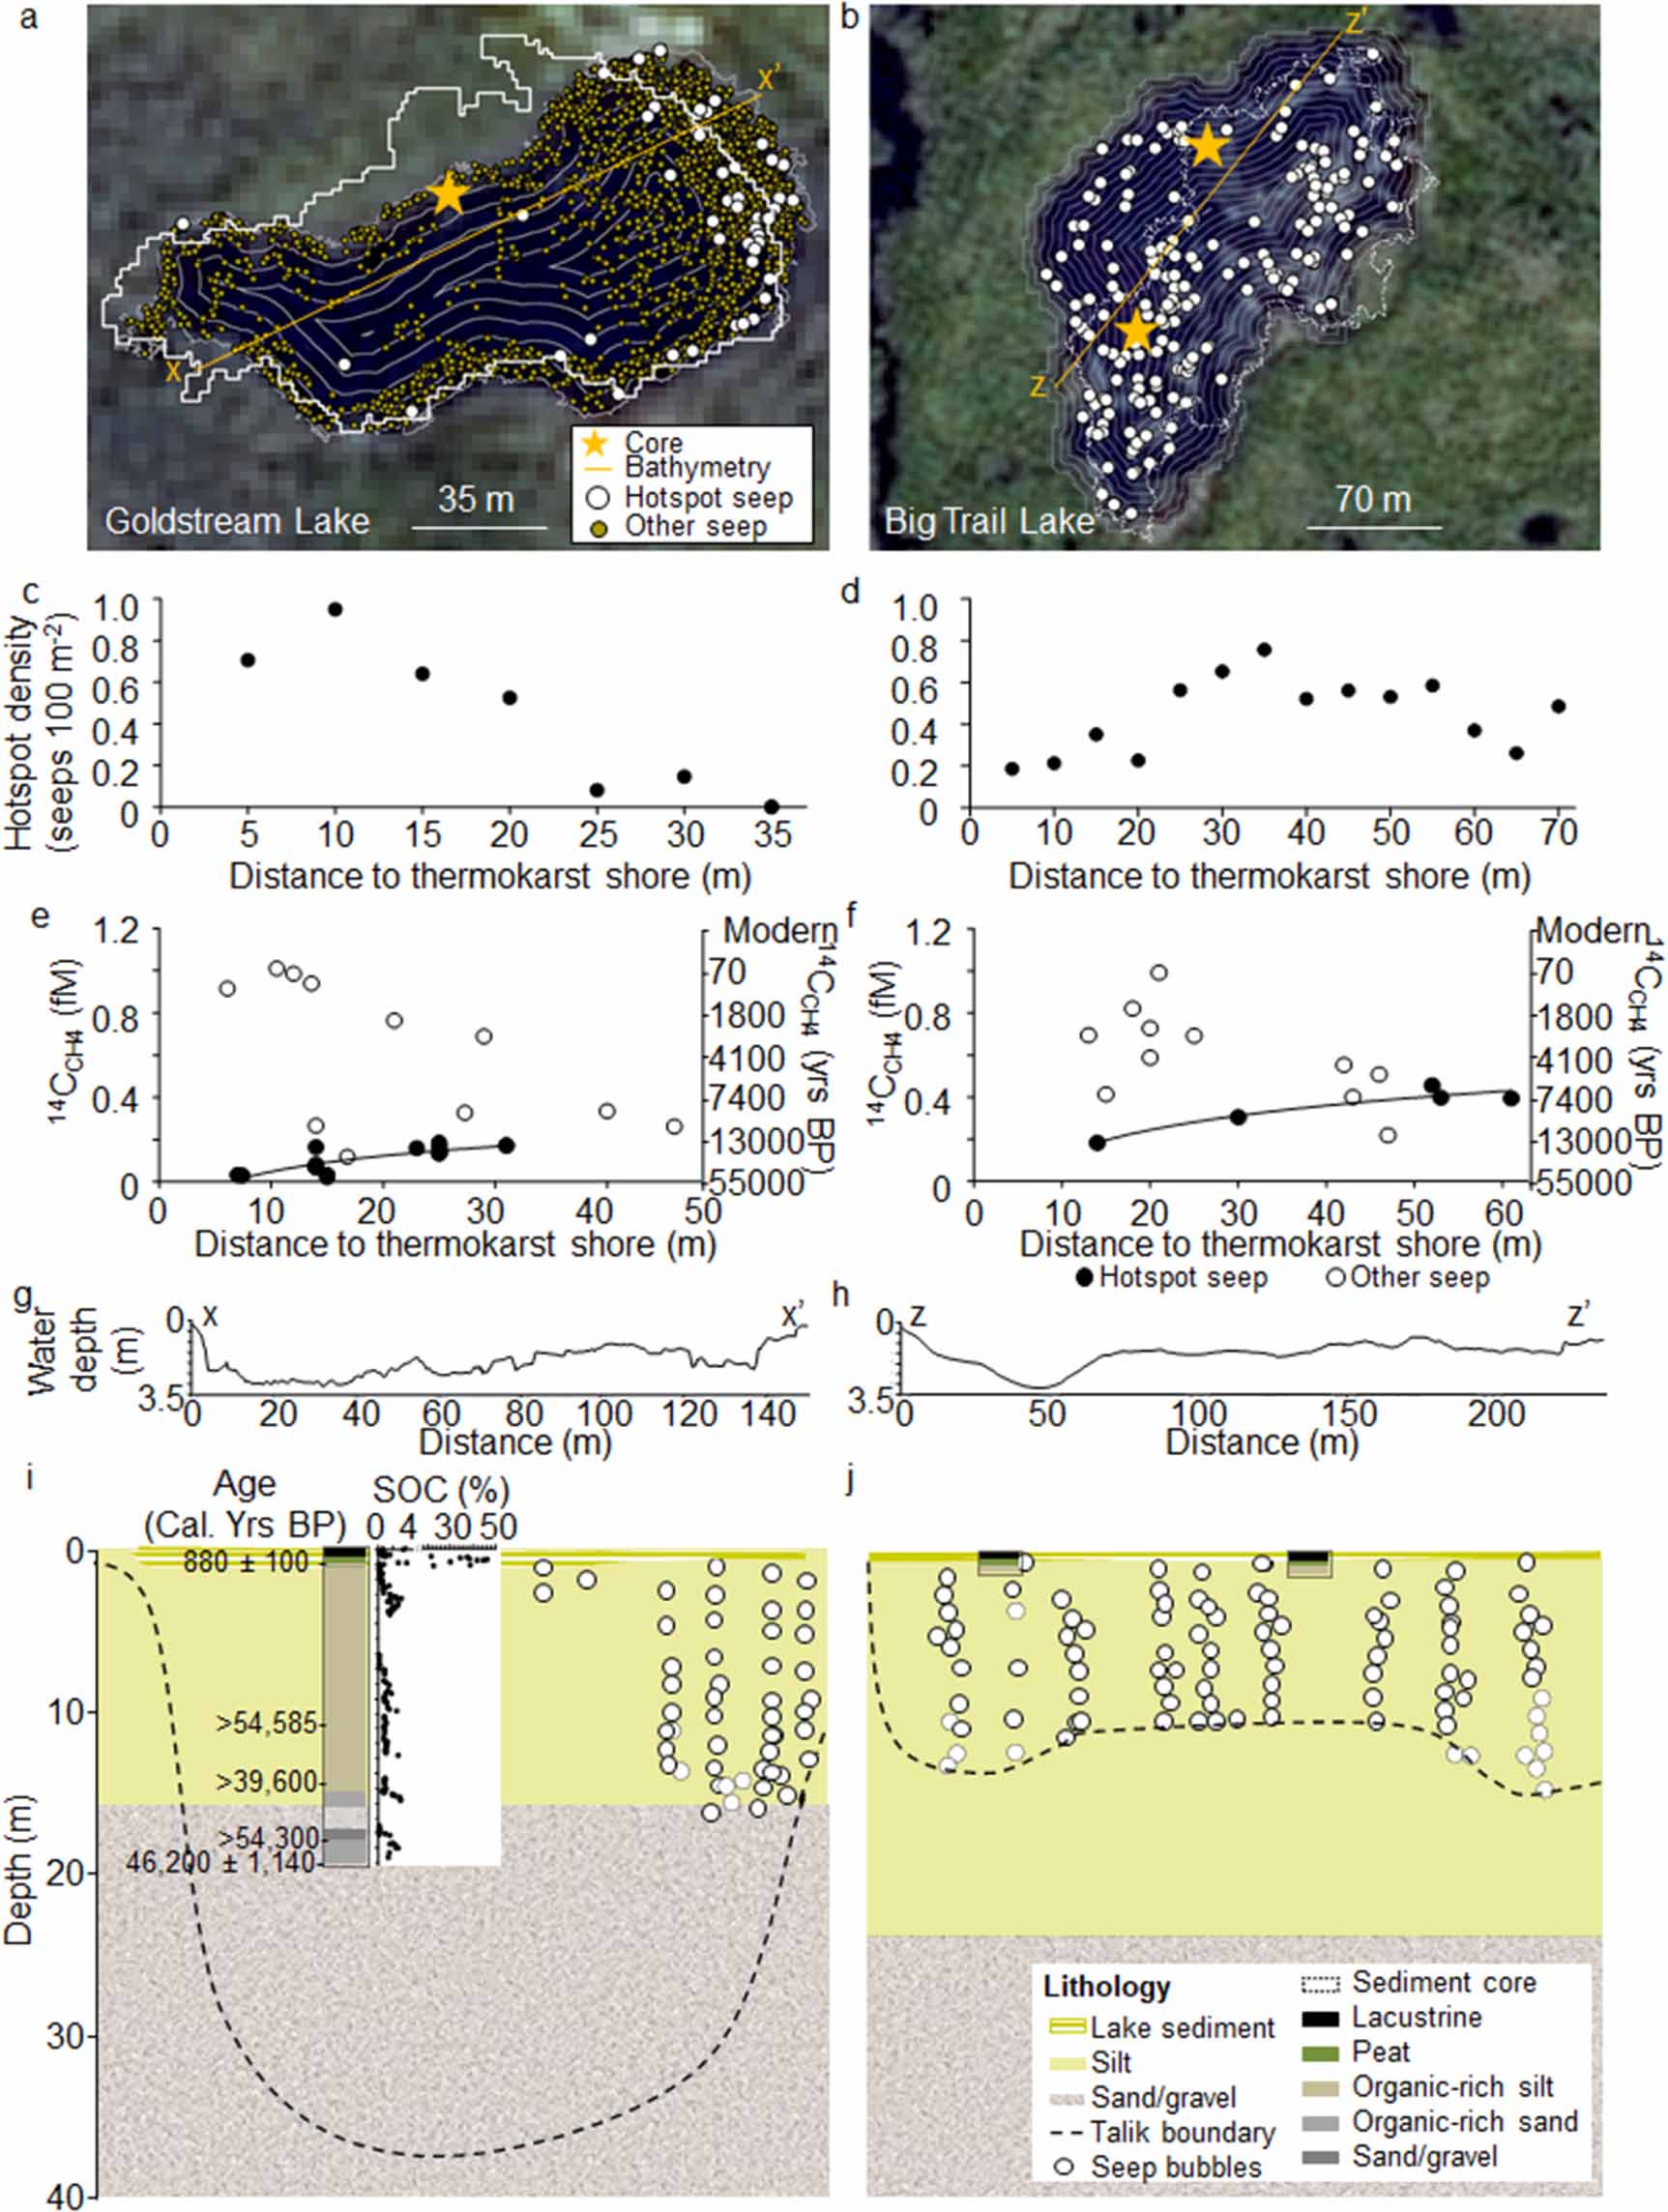
We used geophysical measurements of talik depths and lake sediment coring to improve understanding of lake-surface ebullition patterns and CH4 ages in relation to abrupt thaw in expanding versus new lake types. Geophysical measurements, including both ground-based electrical resistivity tomography (ERT) and airborne electromagnetics (AEM) revealed differences in talik depths between two intensively studied lakes, Goldstream Lake (expanding lake) and Big Trail Lake (new lake) (figure 9). In Goldstream Lake, where radiocarbon dated lake sediment cores suggest the center of the lake originated approximately 850 years ago (figure 10), talik depth extended through the sim20 m thickness of in-situ thawed yedoma (i.e. taberites), which had late-Pleistocene age-dates (>39 600 to >54 585 years BP) to 40 m as inferred by the region of low electrical resistivity (figures 9(c) and (e)). The talik was not as deep (<30 m) closer to the expanding eastern thermokarst margin (figure 9), where hotspot ebullition was concentrated and where bubble 14CCH4 ages were up to 30 800 years. BP (figure 10(e)). In contrast, Big Trail Lake, formed from a wetland between 1949 and 1967, had a shallower talik (<15 m) (figures 9(d) and (f)) and younger 14CCH4 in hotspots (5440–13 650 years BP) that extend across the whole lake surface (figure 10(f)).

Figure 9. Geophysical measurements of talik profiles beneath two interior Alaska thermokarst lakes. The locations of ground-based ERT and AEM transect data are shown for Goldstream Lake (average depth 1.9 m, max depth 4.4 m) (panel a) and Big Trail Lake (mean depth 1.2. m, max depth 4.1 m) (panel b). In (a) and (b), historical 1949 shorelines are white (dashed white line in (b) indicates vegetated wetland) and shown on top of the 2009 SPOT image. Panels (c) and (d) are ground-based ERT profiles. Panels (e) and (f) are helicopter-borne AEM profiles; black dashed line is talik depth. Consistent with the AEM profile, a separate ground-based ERT transect measured perpendicular to z'-z'' indicated >15 m thaw beneath the narrow channel (C) connecting Big Trail Lake to the adjacent thaw pond (data not shown).
Download figure:
Standard image High-resolution image
Figure 10. Relationships between radiocarbon age, seep densities, and talik depths for the older, expanding Goldstream Lake versus the newly-formed abrupt-thaw lake, Big Trail Lake. In (a) and (b), historical 1949 shorelines are white (dashed white line in (b) indicates vegetated wetland) and shown on top of the 2009 SPOT image. In panels (c–f), hotspot ebullition seeps are shown as filled circles; other non-hotspot ebullition seeps are open circles. Non-hotspot seep densities in (c) were derived from Lindgren et al (2016). Hotspot seep densities in (c) and (d) are from aerial-photo analysis in this study. Panel (g) and (h) bathymetric cross-profile locations are indicated in (a) and (b). In (i) and (j), approximate talik depths are shown (dashed line, following figures 9(e) and (f) transects) as well as distribution of ebullition bubbles (circles). In (i), a 20 m long lake sediment core is shown, including 14C-dated terrestrial macrofossil ages and sediment organic carbon (SOC) concentrations. See also supplementary figure 6.
Download figure:
Standard image High-resolution image5. Discussion
5.1. Acceleration of thermokarst-lake formation
The 37.5% net increase in lake area in our interior Alaska study area from 1949 to 2009 is large, but not unprecedented among other ice-rich, permafrost regions of Quebec (50% increase 1957–2003, Payette et al 2004) and Siberia (18% increase 2001–2009; Boike et al 2016). Mean lake expansion (0.27 m yr−1) rates we observed tended to be lower than those observed on the windier Arctic coastal plain of Alaska (sim0.7 m yr−1; Arp et al 2011, Lewellen 1970) and other pan-Arctic thermokarst lakes of the tundra (Jones et al 2011).
Our multi-temporal analysis demonstrates fluctuations in lake number and area across the study period that coincide with expected effects of climate on lake development. We did not see the formation of many large lakes that would otherwise point to non-climate related drivers. While we cannot rule out unknown lags in the impacts of road construction, agriculture, fire, and mining on lake development, these anthropogenic activities largely occurred in the first half of the 20th century, prior to our earliest record of lake areas (year 1949). If human activities were a primary driver of lake expansion, then we would not expect the large decrease in lake number and area that occurred between 1949 and 1967. Hereafter we discuss lake development in relation to climate. Non-climate related factors (e.g. humans, beavers) and wildfire are further discussed in supplementary information 2.
Long-term multi-decadal warming corresponded with lake area increase (figures 11(b) and (e)), but short-term pulse events may also have contributed. For instance, summer air temperatures warmed since 1949 (0.03 °C yr−1) with each period showing a warmer average temperature, while the trend within each time period was inversely correlated to lake expansion. An increased frequency of imagery could provide an assessment of the role of extreme weather events on lake expansion and abrupt thaw. Literature on abrupt ice-wedge degradation in the continuous permafrost has emphasized the impact of one summer's extreme warmth (Jorgenson et al 2006, Liljedahl et al 2016), which may be equally important for lake abrupt thaw. Thirty-three of the warmest summers in the entire time series have occurred in the two most recent time periods (1967–2009) when lake area increase was most dramatic.

Figure 11. Time series (1949–2009) showing thermokarst-lake development in a subsection of Goldstream Valley, interior Alaska, based on historical aerial photographs (1949, 1967, 1985) and 2.5 m SPOT (2009; basemap) shoreline analysis. Panels (b–e) show trends in lake area observed in our entire 214 km2 study extent in 1949, 1967, 1985, 2009 (black dots) amidst a complex climate regime: mean summer (June, July, and August) temperature (panel b) and precipitation (panel c), autumn (September–October) air temperature (panel d), and winter (November–April) snow depth (panel e). Supplementary table 1 summarizes climate data statistics.
Download figure:
Standard image High-resolution imageChanges in autumn air temperature may also have affected lake area change. While p-values were too high to confirm statistical significance (supplementary table 1), we noticed corresponding trends in lake area growth and autumn (September–October) air temperature during the three study intervals (figure 11(d)). Lake area increased with warming fall air temperatures of 0.02 °C yr−1 (1967–1985) and 0.06 °C yr−1 (1985–2009), although the average fall temperature was relatively unchanged (1.9 ± 1.5 and 1.5 ± 2.2 °C, mean/standard deviation, respectively) between the two time periods (figure 11). Lake area decreased (−6%) when fall temperatures decreased (−0.04 °C yr−1 1949–1967), although expansion of floating mats in some lakes by 1967 also contributed to the shrinkage of open water lake area. Warmer autumn seasons suggest an increase in the rain-to-snow precipitation ratio (Bintanja and Andry 2017) during a time when evapotranspiration losses are relatively low (Nakai et al 2013). Any increased groundwater storage and subsequent groundwater flow may therefore promote thermal erosion of permafrost, ultimately favoring shoreline erosion of thermokarst lakes. Increased rainfall has stimulated increased active layer depths across a variety of interior Alaskan boreal ecosystems in recent years (Douglas et al 2020).
Lake area changes also followed precipitation patterns. A 6% decrease in regional lake area from 1949 to 1967 was concurrent with a persistent decrease in summer precipitation from 1930 to 1967. However, regional lake area subsequently increased 13% from 1967 to 1985 and then 30% from 1985 to 2009, while summer precipitation increased only during the last period (figure 11(c), supplementary table 1).
We found that lake and climate changes were coupled in the same ways for existing lakes versus new yedoma lakes and non-yedoma lakes from 1967 to 2009; however, increases in new lake area were most pronounced. When new ponds first form, their development may be slow when shallow water freezes to the bed in winter since bedfast ice impedes talik development (Soloviev 1973). However, warming during the summer and fall accelerates development. Once lakes become deep enough to retain floating ice in winter, talik growth continues year-round and at a faster rate annually (Burn and Smith 1990, Arp et al 2015). While, the number of new yedoma lakes increased by only one lake from 1985 to 2009, the area of the 201 previously formed, new yedoma lakes doubled during that period (figure 3(a)). It is likely that this rapid expansion was caused by warmer, wetter summers that accelerated degradation of ground ice surrounding the newly formed lakes.
5.2. Permafrost-derived CH4 ebullition decreases with lake age
We attribute the 2.6-fold higher ebullition in new lakes compared to older, expanding lakes (figure 5, table 1) to the fraction of lake surface actively expanding into yedoma permafrost deposits. Radial expansion of taliks into labile yedoma substrates beneath new lakes leads to high emissions across entire lake surfaces. In contrast, the labile permafrost carbon pool has been previously exhausted beneath more of the older expanding lakes, such that high ebullition is now concentrated in areas of expanding shorelines (Walter Anthony and Anthony 2013).
Our interpretation that CH4 production and ebullition decrease over time as thawed permafrost soil organic carbon substrates are used up is also supported by the empirical relationship observed between lake age and ebullition among age-dated thermokarst lakes in the yedoma regions of north Siberia, the northern Seward Peninsula, Alaska, and interior Alaska (figure 12).

Figure 12. Relationship between thermokarst lake age and whole-lake ebullition (Ebullition = −40.6 ln (Age) + 369.5, Radj 2 = 0.85; Linear regression β1 ≠ 0, p < 0.001). Turquoise symbols are new lakes; open symbols are existing lakes. Basal ages of yedoma thermokarst lakes in north Siberia (triangles) and Alaska [northern Seward Peninsula (squares) and interior Alaska (circles)] are from Walter Anthony et al (2014, 2018), except three basal ages, which were determined by lake sediment coring in Goldstream Valley lakes in this study (diamonds, supplementary information). Ebullition values are from Walter Anthony and Anthony (2013), Walter Anthony et al (2012, 2018), and this study.
Download figure:
Standard image High-resolution image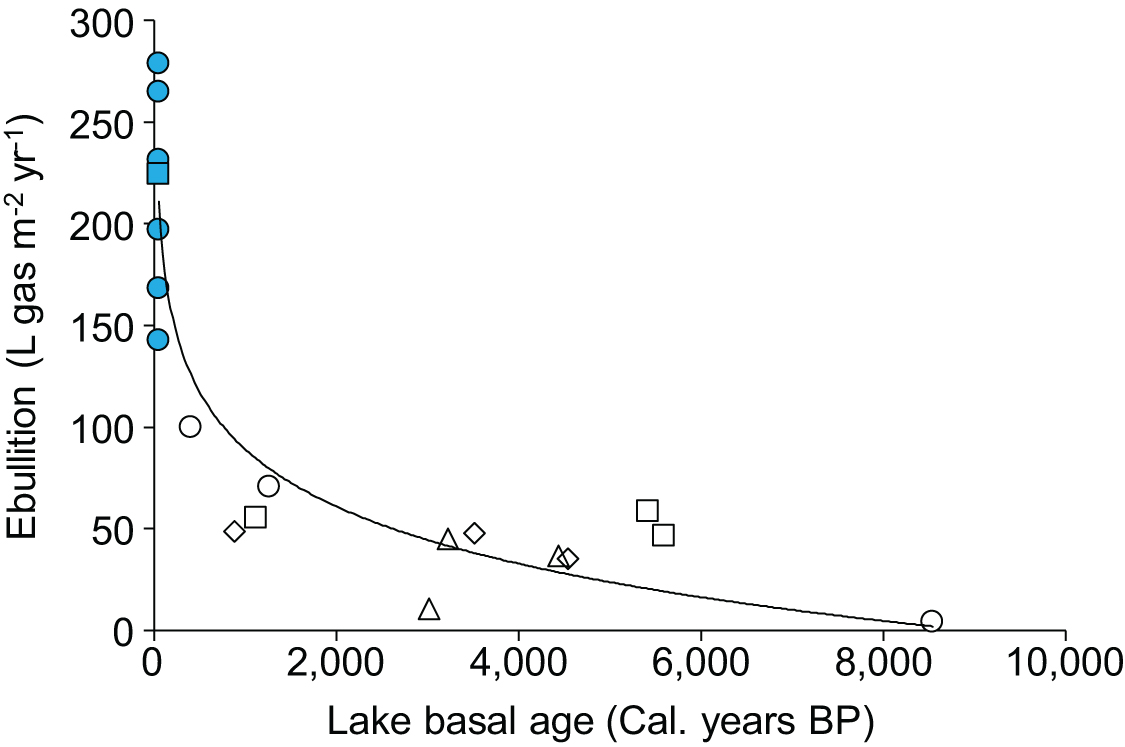
Goldstream Lake and Big Trail Lake further support the concept that permafrost soil organic carbon fueling methanogenesis in taliks diminishes over time since thaw (figure 10). Because it was older and already had a deep talik, thaw beneath Goldstream Lake expanded radially at greater depths during the past 60 years than thaw beneath Big Trail Lake. The deeper radial thaw beneath older lakes with deeper taliks provides microbes access to older, more deeply buried syngenetic permafrost soil organic carbon. This results in older 14C ages in hotspot ebullition seeps from existing lakes compared to new lakes (figure 5(c), table 4), a pattern that we attribute to talik depth (figure 10).
In both lakes, the 14C age of CH4 in hotspot seeps decreased with distance from the thermokarst margin (figures 10(e) and (f)). This is likely explained by mixing during bubble ascent through sediments. As bubbles rise, 14C-depleted CH4 formed deep within taliks mixes with younger CH4 formed in surface sediments, which are thicker in the lake center than along margins (Farquharson et al 2016). Conversely, non-hotspot ebullition seeps, formed closer to the sediment surface, get older with distance from the expanding thermokarst margins due to an increasing contribution of 14C-depleted soil organic carbon that is reworked from expanding lake margins and deposited as laminated lake sediments in lake centers (Walter Anthony et al 2014, Farquharson et al 2016).
5.3. Century-scale limit to yedoma-lake hotspot ebullition emissions
Based on higher bubbling rates, higher CH4:N2 ratios and older 14C ages in hotspot ebullition bubbles compared to other ebullition, hotspot-type seeps are thought to originate from the deepest, organic-rich talik horizons beneath thermokarst lakes (Walter et al 2006, 2008, Walter Anthony and Anthony 2013). If this is true, then locations of hotspots across lake ice surfaces should indicate the spatial boundary of organic-rich permafrost thaw beneath lakes. Conversely, the absence of hotspots seeps in yedoma lakes would indicate complete vertical degradation of yedoma permafrost.
We do not attribute the paucity of CH4 hotspot seeps in the oldest areas of thermokarst lakes to microbial anaerobic oxidation of methane (AOM), which occurs in thermokarst lakes (Martinez-Cruz et al 2017, 2018), but which appears not to significantly impact CH4 in ebullition hotspots (Winkel et al 2019). Rather, in cases where vertical thaw exceeds the thickness of the organic-rich yedoma soils, it is the lack of substrate for methanogenesis that explains the paucity of hotspot seeps in lake centers. Since we observed ebullition hotspots strongly associated with abrupt-thaw areas of lakes, including actively expanding lake margins and newly formed lakes (figure 6, supplementary figures 3 and 4), but fewer hotspots in older, stable lake areas where yedoma permafrost was presumably degraded long ago and its labile carbon fraction microbially exhausted, we propose that hotspot seep occurrence can be used as an indicator of thawing labile, permafrost carbon within taliks. Based on this conceptual framework, we used the distribution of mapped hotspot seeps relative to the 1949 shoreline (figure 8), combined with our observations of thermokarst expansion rates, as a proxy for the temporal limit of labile organic carbon availability after thaw (supplementary information 1.7). Since sim80% of hotspots occurred in areas where land changed to lake since 1949, we conclude that (a) hotspot CH4 release from lakes occurs largely within decades (60 years) of permafrost thaw, and (b) hotspot seep emissions cease altogether within 130 years following the transition of land to thermokarst lake.
Our observations of a large hotspot pulse of CH4 emissions occurring within decades of land transition to thermokarst lakes is consistent with numerical modeling of permafrost carbon mineralization in northern Seward Peninsula yedoma thermokarst-lake taliks, whereby 75% of the labile organic carbon fraction is mineralized within the first century following thaw (Kessler et al 2012). It is also consistent with laboratory incubations of yedoma taberal sediments, which showed enhanced methanogenesis at the base of the downward expanding talik lasting up to 40 years (Heslop et al 2015, 2020).
Additional 14C-depleted CH4 emissions observed in other, smaller, non-hotspot ebullition seep types within and beyond the spatial limits of hotspots in lakes (e.g. figures 10(a) and (c)) indicate that permafrost-soil derived CH4 emissions persist beyond the decadal scale following thaw. It is likely, however, that the source of the 14C-depleted substrate to these non-hotspot ebullition seeps is not limited to in situ thaw beneath lakes, but is derived also from permafrost thaw and erosion along shorelines and within the watershed. Pleistocene-aged, organic-rich silt is a major component of the laminated, surface-lake sediment facies and is interbedded with terrestrial and aquatic carbon accumulations (Walter Anthony et al 2014, Farquharson et al 2016). It is in these organic-rich, yet 14C-depleted surface lake sediments that shoreline- and watershed-derived permafrost soil carbon is mineralized to CH4 (Heslop et al 2015). Thus, 14C-depleted CH4 ebullition from non-hotspot seeps in stabilized lake areas implies the contribution of shoreline and watershed permafrost soils deposition in lakes to the persistence of 14C-depleted CH4 emissions well beyond the decadal time scale of hotspot emissions following lake formation.
5.4. Landscape variability and relevance to future climate-change feedbacks
Up to one million square kilometers of new, abrupt-thaw thermokarst lake areas are expected to form in the Arctic this century in response to RCP4.5 and RCP8.5 warming (Schneider von Deimling et al 2015, Walter Anthony et al 2018, Turetsky et al 2020). Our work provides input for yedoma-region modeling. We expect the lower level emissions from older, thermokarst-lake areas to persist as a background emissions floor while the newly formed thermokarst-lake areas and their higher CH4 emissions will represent the 'new CH4' signal and add to the emissions from the older lakes over a 60+ year time scale. Non-yedoma lakes have lower ebullition.
Regional differences in climate, hydrologic, and ground-ice controls on talik development rates should impact the duration of hotspot emissions following permafrost thaw beneath lakes. Higher spatial resolution data on ground-ice distributions in future work would particularly benefit our understanding of thermokarst and CH4 response. We also acknowledge that regional differences in surficial geology imply variability in the duration of the hotspot CH4 pulse. For instance, in ice-rich, thermokarst-susceptible portions of the vast non-yedoma permafrost region (Olefeldt et al 2016), organic-rich permafrost soils are thinner than yedoma deposits (Hugelius et al 2014, Strauss et al 2016). This implies faster thaw and release of permafrost carbon. Consideration of surface geology is also important for understanding the role of thermokarst lakes in IPCC scenarios and partitioning 14C-depleted sources of atmospheric CH4 between natural versus anthropogenic sources (Dyonisius et al 2020, Hmiel et al 2020), since non-yedoma permafrost soil carbon and thermokarst-lake CH4 ages are younger than those in yedoma soils (Walter Anthony et al 2016, Elder et al 2018, Matveev et al 2018). Differences in surficial geology could also give rise to differences in bubble gas composition, preferential modes of CH4 release (diffusion/ebullition), and wintertime sources of water column dissolved gases (sediments vs ebullition) that are released in spring (Greene et al 2014, Matveev et al 2018, 2019, Elder et al 2018, 2020).
Landscape drainage capacity (i.e. how long a thermokarst lakes lasts before it drains) is a factor that is not well accounted for in models. The magnitude of future abrupt-thaw thermokarst CH4 emissions may be moderated if landscape topography and hydrology cannot sustain a large increase in lake abundance (van Huissteden et al 2011). However, other processes affecting lakes will exacerbate the permafrost carbon feedback. For instance, longer ice-free seasons (Surdu et al 2014) will lead to a higher proportion of sediment-produced bubbles being directly released to the atmosphere without impediment by the seasonal lake ice sheet (Greene et al 2014). This reduces dissolution and oxidation of bubble CH4 in the lake water column. Warmer winter temperatures and thicker snow depths, observed in many regions, result in thinner lake ice and thus contribute to new talik growth in previously shallow bedfast-ice lakes (Arp et al 2016). The same snow—pond ice—permafrost feedback may further enhance new lake formation. Nutrient enhancement of ecosystem productivity under warmer climate scenarios could also increase the supply of contemporary substrates to methanogenesis, increasing future lake CH4 emissions (Wik et al 2016), particularly by ebullition (Delsontro et al 2016). Climate warming leading to warmer sediment temperatures can increase total annual emissions by enhancing microbial respiration and making mineralization of recalcitrant sediment organic carbon pools more energetically favorable (Heslop et al 2019). Finally, extreme weather events leading to ice-wedge degradation (Jorgenson et al 2006, Liljedahl et al 2016) likely enhance lateral lake expansion and should be taken into account, with higher temporal resolution remote sensing imagery, to investigate sub-decadal rates of lake change and answer the question, 'How abrupt really is abrupt thaw?'
6. Conclusions
We have shown that thermokarst lake area growth accelerated during 1949–2009 in a 214 km2 study region in interior Alaska and that newly formed lake areas emit more CH4 than older thermokarst lake areas. The mobilization and emission of the permafrost soil labile carbon fraction via hotspot ebullition occurred over decadal time scales following permafrost thaw beneath newly formed thermokarst lakes. Radiocarbon ages of CH4 in ebullition bubbles varied by lake type and was typically older in the thermokarst expansion zones of older, pre-existing lakes than in new thermokarst lakes that formed after 1949. This age difference is attributed to the depth of thaw. As taliks deepen beneath newly formed lakes, the 14C age of hotspot seeps will increase until the talik has thawed completely through the organic-carbon-rich permafrost soil horizon and the labile carbon fraction of that horizon gets depleted by microbial decomposition. Our finding of >2-fold higher emissions in new abrupt-thaw lake areas compared to older lake areas implies that newly-formed thermokarst lakes will become increasingly relevant on decadal time scales to permafrost carbon feedback models as well as atmospheric CH4 modeling efforts as abrupt-thaw lake areas increase and open-water summer season emissions lengthen in a warmer Arctic.
Acknowledgments
We thank Jessica Cherry for acquisition of aerial photographs. C Maio, A Strohm, M Geai, L McFadden, and D Vas assisted with field work. J Heslop and D Rey provided constructive comments on the manuscript. This study was part of the Arctic-Boreal Vulnerability Experiment and funded by NASA (Grant Nos. NNX15AU49A and NNN12AA01C) and NSF ARCSS 1500931. BMJ was supported by NSF OPP-1806213. Geophysical work performed by BJM/SRJ/NJP was supported by the USGS Land Carbon and Land Change Science programs. A portion of this research was carried out at the Jet Propulsion Laboratory, California Institute of Technology, under a contract with the National Aeronautics and Space Administration (80NM0018D0004).
Data Availability
The data that support the findings of this study are available upon reasonable request from the authors.
Author contribution
K M W A conceived of the study and wrote the paper. P L, P H, B M J, M E, F J M, and K M W A performed the remote-sensing and GIS analyses. K M W A, M E, P L, A B, P H, J L, L B, J H, C M, G G, and R D conducted field work. J C, L B and K M W A measured gas isotopes and prepared methane for 14C analysis. P A performed statistics. R D is responsible for AEM data and interpretation. S J, N P, B M, L B and J M are responsible for ground-based electrical resistivity data and interpretations. All authors commented on the analysis, interpretation and presentation of the data, and were involved in the writing. J L and G G were also supported by ERC #338335 and HGF ERC-0013.