

Abstract
A recent paper in Geophysical Research Letters, 'Solar influence on winter severity in central Europe', by Sirocko et al (2012 Geophys. Res. Lett. 39 L16704) claims that 'weak solar activity is empirically related to extremely cold winter conditions in Europe' based on analyses of documentary evidence of freezing of the River Rhine in Germany and of the Reanalysis of the Twentieth Century (20C). However, our attempt to reproduce these findings failed. The documentary data appear to be selected subjectively and agree neither with instrumental observations nor with two other reconstructions based on documentary data. None of these datasets show significant connection between solar activity and winter severity in Europe beyond a common trend. The analysis of Sirocko et al of the 20C circulation and temperature is inconsistent with their time series analysis. A physically-motivated consistent methodology again fails to support the reported conclusions. We conclude that multiple lines of evidence contradict the findings of Sirocko et al.
Export citation and abstract BibTeX RIS

Content from this work may be used under the terms of the Creative Commons Attribution 3.0 licence. Any further distribution of this work must maintain attribution to the author(s) and the title of the work, journal citation and DOI.
1. Introduction
In the 19th and first half of the 20th century the belief was widespread that the weather was influenced strongly by the 11-year sunspot cycle (e.g., Berlage 1957). However, the discovery of deterministic chaos (Lorenz 1963) caused by baroclinic instability of the midlatitude westerly flow (Charney and Stern 1962) restricted the potential role of external forcings, as most of the variability of European winter weather results from this chaos. Thirty years ago, review articles (Pittock 1978, 1983) concluded that no evidence could be found for strong influences of the sunspot cycles on the weather beyond the daily scale in the more than hundred papers available at the time. They also found the literature to be full of common errors, such as 'poor data quality, data selection, data smoothing and autocorrelations, and post hoc elaboration of hypotheses to explain discrepancies'. Further research in this field has not always acknowledged existing knowledge and lessons learned from the past (Pittock 2009, Lockwood 2012).
Recently there has been renewed interest in the influence of the solar cycle on European winter weather. Lockwood et al (2010) claimed a weak but statistically significant effect when using the open solar flux rather than sunspot numbers to search for effects of solar activity in the Central England Temperature (CET) series (Manley 1974, Parker et al 1992) over 1675–2011. Note that there are differences between the open solar flux and the sunspot cycle. Although both show an 11-year cycle, the sunspot number does not have a secular trend in its minima (Lockwood and Owens 2011). A problem discussed in the Lockwood et al (2010) paper is the detrending procedure, as the trend is not linear and the observed temperature rise in the CET is faster than the Northern Hemisphere average (van Oldenborgh et al 2009). Woollings et al (2010) looked for possible mechanisms for this connection in upper air reanalysis data and found a stronger connection in the last four cycles. However, the connection between the North Atlantic Oscillation (NAO) and solar activity is known not to exist in longer records of equivalent surface observations, such as instrumental or analysis-based sea-level pressure series (see section 4, already noted in Rodwell (2003)) and independent observations such as the CET and Dutch temperature reconstructions (beyond common upward trends). This leaves the two possibilities that the connection in recent decades was a chance fluctuation or the result of a change in the physical behaviour of some aspect of the climate system that switched on a coupling or allowed it to become apparent. The difference cannot be determined by statistical analyses alone: proper physical understanding is needed. Ineson et al (2011) showed model evidence for a solar-induced signal in the lower stratosphere and upper troposphere caused by UV radiation variations during the latest solar cycle changing the ozone concentration and hence temperature in the upper stratosphere (see also Keckhut et al (2005), Haigh et al (2005)). The solar signal is visible in long upper air reconstructions (Brönnimann et al 2007). However, on long timescales this signal is much weaker at ground level and not a major factor in determining severe winters. In fact we find it undetectable against the weather noise in long detrended time series (e.g., figure 4(b)).
In August 2012, a paper appeared in Geophysical Research Letters entitled 'Solar influence on winter severity in central Europe' (Sirocko et al 2012, hereafter SBP) that claims that 'weak solar activity is empirically related to extremely cold winter conditions in Europe'. SBP's 'severe winters' refers to documentary evidence of the freezing of parts of the River Rhine in Germany. Over the last approximately 230 years, 14 such events were identified, 10 of which are close to a minimum of sunspot numbers—a coincidence that is statistically significant at the 99% level.
The finding of such a strong connection between sunspot minima and severe winters in Europe is at variance with the literature discussed above, so we re-assess the study of SBP, considering their data in section 2, their methods in section 3 and the proposed mechanisms in section 4.
2. Data
First, the selection of 'severe winters' in SBP is taken to be the 'freezing of a large river in Germany, which represents a robust and easily detectable climate signal'. However, the supplementary information in SBP shows that the data record of Rhine freezing is constructed merely on searching the internet for miscellaneous documents containing information about Rhine river freezing, including an oil painting. In addition, no evidence is given that the record of local Rhine freezing assembled by SBP is a valid proxy for severe winters.
This is not the state of the art in the field. Pfister (1984) reported a calibrated reconstruction of winter severity based on quantitative measures of the amount of ice cover on Swiss lakes. Van Engelen et al (2000) similarly estimated Dutch winter temperatures using, among other sources, the number of days that one canal in the Netherlands was frozen. A benchmark paper on historical trends in Northern Hemisphere lake and river ice (Magnuson et al 2000) uses the length of the river freezing period as an integrated measure of temperature and thus winter severity. A global database of lake and river ice phenology exists (Benson and Magnuson 2000, updated 2012). However, that database does not cover the river Rhine, or any other central European river and mainly covers the twentieth century.
These studies show that river and lake ice can be used as a proxy for winter severity, but also that the observations have to be homogeneous and the interpretation as winter severity demonstrated by comparison with a long temperature record (e.g., Frankfurt am Main for the Rhine) and/or by physical modelling of the ice growth. Such quantification is lacking in SBP, as are references to the whole literature on river and lake freezing (e.g., Pfister 1984, Fouquet 1999, Van Engelen et al 2000, Magnuson et al 2000, Benson et al 2012). In addition, the use of different locations and kinds of records to define 'freezing of a long river' further complicates the database construction as it introduces unquantifiable inconsistencies. General practice is to construct records of river freezing based on single locations along the river and only combine data when data series overlap.
To exemplify the problems with basing the definition of cold winters on river ice information, a simple Google search uncovered a report from the History Society of Altrip, a German town on the Rhine, approximately 100 km south of Mainz, near the centre of the stretch considered by SBP. This report mentions freezing of the River Rhine in the years listed below. For comparison, SBP's 'winters when the Rhine froze' are denoted in bold. SBP's list also includes 1823, which is absent from this series.
'Almost every year between 1803–1815, 1820, 1826, 1829, 1830, 1838, 1839, 1841, 1845, 1854, 1856, 1861, 1864, 1870, 1879, 1880, 1891, 1893, 1894, 1895'. (Source: www.hgv-altrip.de/index.php/downloads/category/5-leben-am-strom.html?download=80, our translation.)
Only 9 out of these 32 freezing winters (28%) satisfy SBP's definition, 4 years surrounding a sunspot minimum, which covers 4 out of each 11-year sunspot cycle (36%). This series therefore shows no evidence that weak solar activity is associated with Rhine freezing events (p ≈ 0.5 using a binomial distribution), but rather an insignificant tendency the other way.
Googling 'Rhein erfroren' (actually incorrect German for 'Rhine frozen') retrieved indications of many other freezing years; some texts indicate that at some places the Rhine froze 50% of years, whereas SBP found only 7% (though they restricted their selection to only those when it was frozen at multiple places or to a sufficient thickness that people could walk on it). Conversely, instrumental records of daily temperature at the nearby town Frankfurt am Main (Klein Tank et al 2002) show that in some of SBP's 'severe winter' months the daily mean temperature dipped below zero on only a handful of days (e.g., February 1880, December 1941) or the winter mean temperature was mild (1914).
Finally, the photograph of people skating on the Rhine in SBP was taken in 1929, not in 1963 as their caption claims. The reverse side of this postcard (figure 1)—available from a website that offered this postcard for sale—says 'Andenken an den Uebergang über den zugefrorenen Rhein im Jahre 1929' (souvenir of the crossing of the frozen Rhine in the year 1929). It also mentions that this is the first time that the Rhine was frozen since 1895, which is not in SBP's list and contradicts their 1914 date.
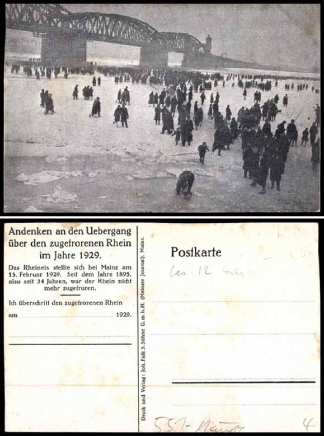
Figure 1. Postcard from 1929. Translation of the back: 'Souvenir of the crossing of the frozen Rhine in the year 1929. The Rhine ice formed near Mainz on 15 February 1929. Since the year 1895, for 34 years, the Rhine had not been frozen any more. I crossed the frozen Rhine on ...1929'.
Download figure:
Standard image High-resolution imageOf course we do not imagine that the information we found is more reliable, but it highlights that a simple Google search can lead to very different results and conflicting evidence, and so is not adequate for the construction of a historical Rhine river freezing record.
In contrast, we considered the well-calibrated Pfister (1984) reconstruction of Swiss winter temperatures and the Dutch winter temperatures by Van Engelen et al (2000), which are both based on freezing of waterways among other sources. These areas bracket SBP's Rhine area and the reconstructions are well-correlated (r2 = 0.5). Comparing these reconstructions with SBP, figure 2(a) shows that over 1750–1870 five severe winters agree, but five others were not included by SBP (most at high sunspot numbers). Over the instrumental period 1871–1989 (figure 2(b)) some much less severe winters are included by SBP, such as 1914 and 1954 (both at a sunspot minimum).
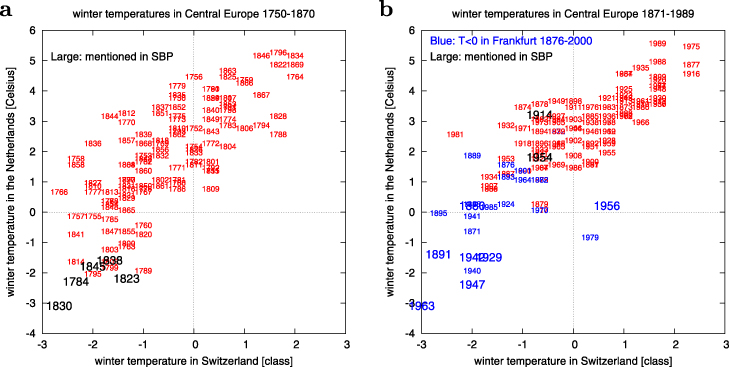
Figure 2. Winter (December–February) temperatures in the Netherlands (Van Engelen et al 2000) and Switzerland (Pfister 1984) compared with each other and the SBP series over the pre-instrumental period (a) and also the instrumental observations (b) at Frankfurt am Main (Klein Tank et al 2002).
Download figure:
Standard image High-resolution imageWith more severe winters at high sunspot numbers and fewer ones at low numbers than in SBP's list, neither of these two well-calibrated reconstructions shows a significant correlation with sunspot numbers (international sunspot number from Solar Influences Data Analysis Center, SIDC 1749–2012) after detrending: r2 < 0.01,p > 0.2 using a two-sided t-test.
3. Method
A second problem is the inconsistent definition of coincidence with a sunspot minimum. In SBP's figure 2 (the time series) this is defined as 4 years surrounding the minimum, but in SBP's figure 5 (maps of the circulation changes) it is defined as the single year following the minimum.
Considering the time series analysis, only one 'severe winter' out of 14 in SBP's figure 2 meets the second definition. Thus, on SBP's second definition the documentary evidence they selected shows that a severe winter is less likely at sunspot minima.
Conversely, using the first definition in SBP's figure 5 gives a very different pattern of atmospheric circulation. This is illustrated in our figure 3, which extends the analysis of SBP to the other three years surrounding the sunspot minimum used in their time series analysis. None of the composites for the three sets of years that were discarded by SBP in moving from the reconstructed time series to the 20C reanalysis fields (Compo et al 2011) show any sign of the cold area in the region of Europe that SBP identified in their composite, nor any sign of negative NAO conditions. Thus SBP can show evidence for the mechanism they propose to explain the severe winters—a pattern of anomalous atmospheric circulation—only by using a different criterion, and thus a different set of winters, than the set of severe winters that it purports to explain.
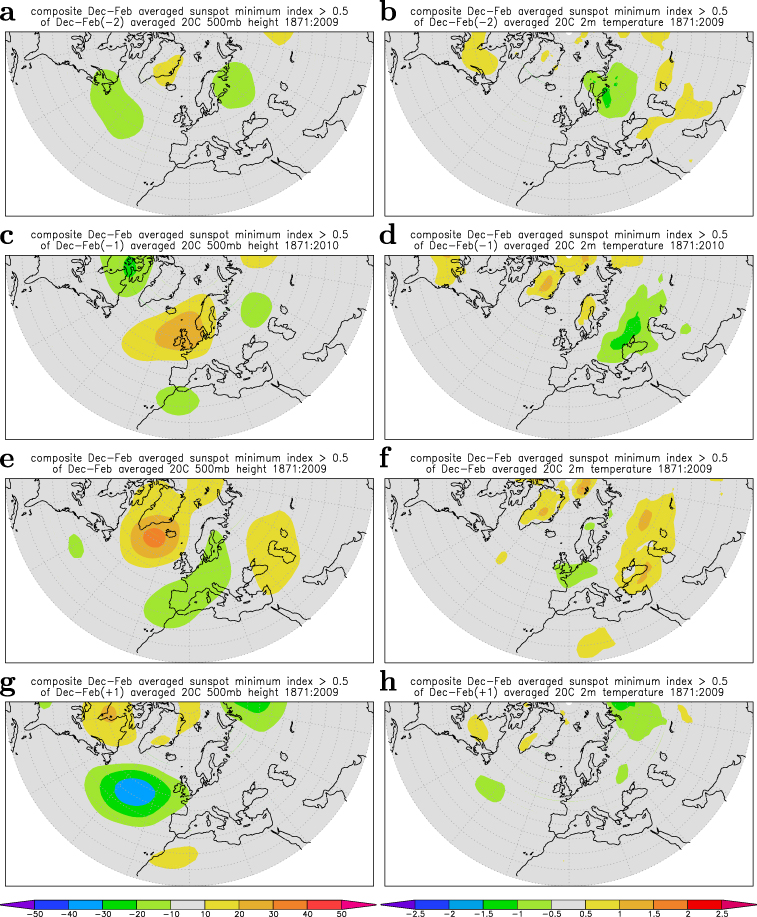
Figure 3. Composites of 500 hPa geopotential height (Z500 (m); (a), (c), (e), (g)), and temperature 2 m above the ground (T2m (K); (b), (d), (f), (h)) using 20C Reanalysis data (Compo et al 2011) in the four years defined as a sunspot minimum in the time series analysis of SBP: ((a), (b)) two winters before the minimum, ((c), (d)) the winter before the minimum, ((e), (f)) the winter following the minimum (corresponding to their figure 5), ((g), (h)) two winters after the sunspot minimum.
Download figure:
Standard image High-resolution image4. Mechanism
Third, SBP propose that the relation between severe winters in Europe and sunspots is mediated by the dominant pattern of atmospheric circulation variability over the North Atlantic and Europe, the NAO. To investigate the relation between NAO, for which there are instrumental measurements since 1821 (Jones et al 1997), and solar activity we plot the December–February averaged NAO index against sunspot number, both linearly detrended (figure 4(a)). There is no statistically significant linear relation (r2 = 0.007,p > 0.2). Nor is there between sunspot number and Frankfurt am Main temperature, directly observed since 1870 (figure 4(b), r2 = 0.000,p > 0.2, detrended). A visual analysis of the graphs also shows no evidence for non-linear relations. Lag correlations (figures 4(c) and (d)) also do not show a significant linear correlation.
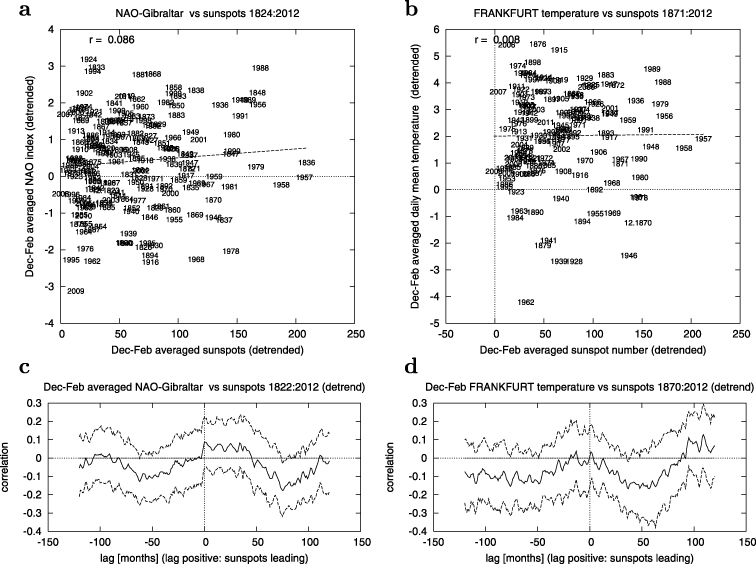
Figure 4. Correlation of (a) December–February average NAO index (Jones et al 1997) and (b) temperature in Frankfurt am Main (Klein Tank et al 2002) with sunspot number (SIDC 1749–2012). (c), (d) Lag correlation corresponding to ((a), (b)) up to ten years with 95% confidence intervals (estimated with a non-parametric bootstrap method, Efron and Tibshirani 1998). All series have been linearly detrended. Both correlations show no significance at lag zero even at p < 0.2, and would explain less than 1% of the variance. There are correlations significant at p < 0.05 at a few lags, which is to be expected due to chance fluctuations.
Download figure:
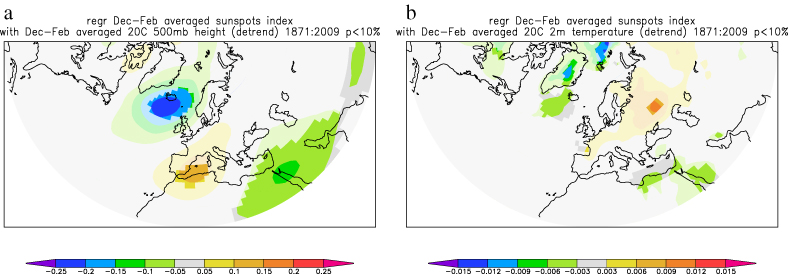
Standard image High-resolution imageThis agrees with the lack of an NAO signature in 500 mb geopotential height (Z500) or cold area in Central Europe 2m-temperature (T2m) in figure 5, which instead of a composite shows the quantity with the best signal/noise ratio for a linear connection: the regression on sunspot numbers. Of course, on a map with no physical connection on average 10% of the points will have a p-value below 0.1. The field significance (Wilks 2006) shows whether this area is significantly larger than that expected by chance fluctuations. Using the method of Sterl et al (2007) we find that on both panels of figure 5 the area is within the range of random fluctuations, p > 0.1.
Figure 5. Regression of Z500 (a) and T2m (b) (Compo et al 2011) on the international sunspot number (SIDC) over the period 1871–2009. Areas not significant at p < 0.1 are shaded light. Neither map shows more significant areas than expected, the field significance p > 0.1 (estimated using the method of Sterl et al 2007).
Download figure:
Standard image High-resolution image
It is well established that the dominant influence by far on European winter weather fluctuations is the chaotic unforced variability of the baroclinic instability of the westerlies (with the NAO representing a significant part of this variability). SBP claim support for a solar–climate relation from Ineson et al (2011), but solar forcing explains only a small fraction of the variance in that model-based study. (It is also based on controversial UV measurements of part of a single solar cycle, which disagree with earlier observations. This cycle could be atypical or there could be a problem in the data.) In contrast SBP assign most freezing winters to a causal agent, often the sunspot cycle, implying a dominant role for external forcing in determining winter weather in Europe. Despite many attempts, no such strong signal of the sunspot cycle has been found in the Earth's surface climate (see e.g., Pittock (2009), and references therein) and even the relatively well-established effect of large tropical volcanic eruptions is much weaker than the unforced internally-generated variability (Weber 2005, Zanchettin et al 2013).
5. Conclusions
We conclude that a critical look at the record of severe winters developed by Sirocko et al (2012) shows that the selection is inhomogeneous and thus the data are unreliable. The combination of inhomogeneous data, a subjective definition of a 'severe winter', inconsistent definitions of weak solar activity and disagreement with analysis of instrumental data, implies that the conclusion that Rhine freezing events are connected to low sunspot numbers is not supported by the data as a whole. We show that there is no significant connection beyond common trends between sunspot numbers and instrumental series of the North Atlantic Oscillation and Frankfurt am Main temperature, nor with reconstructions of winter weather in the Netherlands and Switzerland. Minimum standards in this field were laid out more than 30 years ago (Pittock 1978). Progress in robustly identifying a controversial but probably minor influence on surface climate is more likely to be attained using the daily instrumental observations that exist for both temperature and air pressure over the past 150 years and well-calibrated reconstructions of monthly climate for the longer period (e.g., Luterbacher et al 2004), rather than the subjectively-defined and incomplete records used by SBP.
Acknowledgments
We thank Roger Pielke Sr and Stefan Rahmstorf for their support in this project. WJI was supported by the Joint DECC/Defra Met Office Hadley Centre Climate Programme (GA01101) and also by NERC via the HYDRA project (NE/I00680X/1); TJO was supported by NERC NE/G018863/1. JL acknowledges support from the DFG Project PRIME 2 within the Priority Program INTERDYNAMIK and from the EU FP7 project ACQWA (NO212250). All data and analyses are available at the KNMI Climate Explorer, http://climexp.knmi.nl.
© Crown copyright 2013. Reproduced with the permission of Her Majesty's Stationery Office and Met Office Hadley Centre. Published under exclusive licence by IOP Publishing Ltd.