

Abstract
It is generally accepted that year-to-year variability in moisture conditions and drought are linked with increased wildfire occurrence. However, quantifying the sensitivity of wildfire to surface moisture state at seasonal lead-times has been challenging due to the absence of a long soil moisture record with the appropriate coverage and spatial resolution for continental-scale analysis. Here we apply model simulations of surface soil moisture that numerically assimilate observations from NASA's Gravity Recovery and Climate Experiment (GRACE) mission with the USDA Forest Service's historical Fire-Occurrence Database over the contiguous United States. We quantify the relationships between pre-fire-season soil moisture and subsequent-year wildfire occurrence by land-cover type and produce annual probable wildfire occurrence and burned area maps at 0.25 degree resolution. Cross-validated results generally indicate a higher occurrence of smaller fires when months preceding fire season are wet, while larger fires are more frequent when soils are dry. This is consistent with the concept of increased fuel accumulation under wet conditions in the pre-season. These results demonstrate the fundamental strength of the relationship between soil moisture and fire activity at long lead-times and are indicative of that relationship's utility for the future development of national-scale predictive capability.
Export citation and abstract BibTeX RIS

Original content from this work may be used under the terms of the Creative Commons Attribution 3.0 licence.
Any further distribution of this work must maintain attribution to the author(s) and the title of the work, journal citation and DOI.
1. Introduction
Wildfires in the United States have increasingly become larger and more frequent during the last several decades, contributing to greater environmental degradation, property damage, and economic losses (Dennison et al 2014, Morton et al 2003). By 2025, the cost of fire suppression in the United States is predicted to increase to nearly $1.8 billion per year (United States Department of Agriculture (USDA) Forest Service 2015). As a result, there is a growing need for the capability to direct operational fire resources before the fire season begins. This points to the growing importance of seasonal to sub-seasonal forecasting capacity for wildfires, similar to those that are being developed for weather and natural resources management (National Academies of Sciences 2016).
Wildfires are typically defined as uncontrolled fires that occur in areas of combustible vegetation, and depend greatly on vegetation type, structure, arrangement, and moisture. In the contiguous United States, 90% of wildfire ignitions are associated with human activity, but several other environmental factors such as fuel availability, fuel moisture, wind, and lightning strikes can be of critical importance in ignition and growth. The largest contributing factors to general wildfire risk are the pre-fire-season accumulation of fuels and changing fuel moisture content (FMC), both of which can contribute to greater fire severity in a given region. Depending on the vegetation class, more fuels and lower FMC generally indicate higher fire risk and greater fire severity potential—the degree of environmental change caused by a fire (Verbesselt et al 2002, Van Der Werf et al 2008).
The spatial distribution and the moisture content of transient (i.e. fast-growing) fuels tend to be associated with precipitation and soil moisture conditions at the land surface over the months prior to fire season, when some regions experience an annual wet period or rainy season (Chuvieco et al 2004, Krueger et al 2015). These results suggest that soil moisture may be a good predictor of fire occurrence and fire severity, even at seasonal lead times.
However, in order to understand this relationship, the required local-scale data that are adequately discretized and have a spatially and temporally uniform structure are difficult to obtain over large domains (Famiglietti et al 2008). Therefore it is challenging to develop a quantitative description of the relationship between land surface wetness conditions in the period before fire-season and wildfire occurrence during the fire season, and the specific impacts of surface moisture conditions on wildfire occurrence across land cover types is largely unquantified.
The National Interagency Fire Center (2016) currently publishes seasonal fire potential outlook reports for the United States. These reports use the US Drought Monitor, past monthly temperature and precipitation deviations from average, and one and three-month weather outlooks to qualitatively assess regional fire potential. The fire potential maps produced offer a tercile assessment—normal, above normal, or below normal—of fire potential over broad geographic regions. This method does not currently apply a numerical relationship between seasonal fire occurrence and variability in contributing environmental factors such as soil moisture. It also does not yet produce a quantitative estimate of probable fire occurrence that could be used in a risk-assessment framework.
The Palmer Drought Severity Index (PDSI), additionally, has been shown to have utility in assessing drought impacts on wildfire activity (Xiao and Zhuang 2007). However, the PDSI, similar to the National Interagency Fire Center outlook reports, is based on temperature and precipitation sums and not actual soil moisture observations, and has been shown to be biased for assessment of drought conditions in some cases (Sheffield et al 2012). Burgan et al (1998) also developed a fire danger fuel model map across different ecoregions, largely based on satellite normalized difference vegetation index observations, but no soil moisture record was then available. These studies provide both a precedent and evidential basis for the use of large-scale climatological variables in wildfire assessment. The recent availability of large-coverage soil moisture products, specifically those produced with a combination of remote sensing and land-surface model simulations through numerical data assimilation, now offer the ability to quantify such relationships at finer scales and across large-domains. The development of these data sets should provide a unique opportunity for advancement in seasonal wildfire risk assessment.
This study thus seeks to integrate NASA earth observation data and the USDA Forest Service's historical fire record to quantify climatic relationships with fire activity. Model-assimilated hydrology observations are leveraged to examine finer spatial and longer temporal scales and to establish the quantitative basis for seasonal forecasting relationships. Since pre-season soil moisture can serve as a proxy for pre-season fuel accumulation and live fuel moisture conditions, a historical record of remotely sensed soil moisture data products was examined to disentangle the bearing pre-fire season soil moisture conditions have on a succeeding year's fire activity. With a proven statistical relationship, the methods developed herein can in turn be applied to improve fire prediction and risk assessment capabilities in the contiguous US. As more communities in the earth sciences work at achieving seasonal to sub-seasonal (S2S) predictive capabilities, the importance to society of knowing what might happen at several months lead-time is clear.
Launched in 2002, NASA's Gravity Recovery and Climate Experiment (GRACE) mission provides monthly observations of terrestrial water storage anomalies (TWSA) that describe spatial and temporal changes in the amount of water stored in soils, groundwater and above the land surface (Tapley et al 2004), which have proven useful in the monitoring of changing hydrologic conditions (e.g. Famiglietti et al 2011). However, GRACE observations have an intrinsically low spatial resolution (~150 000 km2), due to the altitude of the satellites. This makes GRACE TWSA observations difficult to apply for natural resource management. One way to circumvent the resolution limitations of GRACE is to perform a physical downscaling of the GRACE observations through numerical data assimilation. This has been done with much success for drought and flood monitoring applications (Houborg et al 2012, Rodell 2013, Reager et al 2015), and is currently included as an input to the US Drought Monitor framework (Houborg et al 2012). The resulting surface soil moisture data, downscaled from raw GRACE data with the Catchment Land Surface Model (CLSM), form the base climatic independent variable in this study.
Building upon these successes, we investigate the relationship between GRACE-assimilated seasonal surface (i.e. top several centimeters) soil moisture (Zaitchik et al 2008) as a proxy for fuel moisture content and yearly wildfire occurrence and burn extent. We apply GRACE-assimilated soil moisture simulations downscaled with the CLSM and in-situ wildfire observations over the continental United States during the 2003–2012 period (Short 2015), at 0.25 degree spatial resolution, with the 2012–2013 data withheld for validation. Each grid cell represents approximately 785.18 km2, or 194 022.02 acres. While other remotely sensed soil moisture data products exist, such as those derived from Soil Moisture and Ocean Salinity (SMOS) and AMSR-E/Aqua, these GRACE-assimilated data offer monthly datasets over a long temporal record and at a higher spatial resolution that are more ideal for calibrating a historical regression model over the contiguous United States. We disaggregate the study domain by land cover type (Homer et al 2015), under the hypothesis that wetness should modulate different land cover responses to wildfire ignition differently. Surface soil moisture alone, as opposed to root zone moisture content and total terrestrial water storage, was utilized in order to optimally capture seasonal variance in wetness that affects all dominant species across land cover types, including grasses with shallow roots (Famiglietti et al 1999). Additionally, utilizing surface soil moisture in this way provides a reference model that can then be applied with future Soil Moisture Active Passive (SMAP) data. We then determine the historic relationship between wildfire occurrence and CLSM-assimilated surface soil moisture across land cover types, and cross-validate a predicted response to show the strength of the relationship. In doing so, this study reveals complex nonlinearities in the influence of fuel moisture content on wildfire severity, and further establishes the need to incorporate accurate surface moisture information in the quantitative assessment of fire risk and potential in the United States. The aim of this study is to demonstrate a relationship between pre-season soil moisture and fire occurrence likelihood and to characterize large-scale fire sensitivity to seasonal moisture patterns.
2. Data
2.1. GRACE and CLSM-Data Assimilation
NASA's GRACE mission consists of two Earth-observing satellites orbiting in tandem and spaced about 220 kilometers apart at roughly 450 km altitude. A K-band ranging system provides precise measurements (within 10 µm) of the distance between the satellites caused by spatial and temporal fluctuations in the Earth's gravity field (Tapley et al 2004). These measurements are used to determine variations in the Earth's mass distribution at a horizontal resolution of 150 000 km2, with generally higher measurement accuracy across larger spatial scales (Wahr et al 2004). The monthly to decadal temporal changes in the gravity field are attributed primarily to mass redistribution in the atmosphere, ocean, continents and solid earth. After isolation and correction of 'unwanted' signals for hydrology applications (i.e. ocean, atmosphere, and postglacial rebound), these measurements, referred to as TWSA, are assumed to approximate the movement of water mass over time. Swenson and Wahr (2006) and Wahr et al (1998) offer general post-processing logistics and Landerer and Swenson (2012) offer specifics on scaling, signal restoration, and regional error calculation. The GRACE dataset utilized for this project is processed by the Texas Center for Space Research (CSR; version CSR-RL05) and NASA's Jet Propulsion Laboratory. It is a global, monthly, one degree gridded, scaled GRACE land data product available for download at grace.jpl.nasa.gov. The data for this project is from the time period April 2002−December 2013.
Developed at the NASA Goddard Space Flight Center, the Catchment Land Surface Model (CLSM) is a physically based land surface model (Koster et al 2000). For the model forcing, the horizontal structure of a rectangular atmospheric grid is separated into topographically-defined catchments with an estimated average area of 4000 km2. Water is spatially and vertically distributed in the model determined by topography and the model's hydrologic processes are generally determined by the catchment's topographical statistics. In the assimilation algorithm, the model-generated terrestrial water storage moisture elements are corrected with the GRACE observational estimate using an ensemble Kalman smoothing filter method as described in Zaitchik et al (2008). Assimilation incorporates the relative uncertainty in the model and the observations. In this process, a two-step smoother is applied to manage GRACE's monthly temporal resolution both forward and backwards in time. In order to create consistency among observed and modeled variables, the GRACE water storage anomalies are changed to absolute values by adding the simulated time mean water storage variable from the CLSM output to the observations. The observations are directly applied to the column-integrated forecasted variable (the catchment deficit) and the primary non-equilibrium prognostic (the root zone excess moisture), and the vertical disaggregation occurs based on covariance. The CLSM-Data Assimilation (CLSM-DA) data used in this study extend from January 2003−December 2014, and the outputs are reported on 0.25 degree grid cells for the contiguous United States. The gridded analysis used in this paper is an interpolation of catchment tiles to an equally spaced model grid for consistency with the other data sets used. Resampling these other datasets to the coarser resolution always introduces uncertainty but captures more first order climatic characteristics.
2.2. Fire Program Analysis fire-occurrence database
The USDA Forest Service's Fire Program Analysis fire-occurrence database (FPA FOD) is a comprehensive geospatial database of wildfires in the United States from 1992−2013. It includes 1.73 million geo-referenced wildfire records, representing a total of 126 million acres burned during the 22 year period (Short 2015). It also contains vital information for each of these fires, including date, cause, fire size, fire size class, burned area, and coordinates. These data were imported as points into a geographic information system and processed into two separate raster datasets that matched the spatial and temporal resolution of the GRACE derived soil moisture data. The first dataset aggregated the annual number of fires in each 0.25 × 0.25 degree cell for May through April of the following year, while the second summed the total burned area (in acres) for each cell in that timeframe.
2.3. National Land Cover Database
The land cover type dataset used in this study was the USGS' National Land Cover Database 2011 (NLCD 2011) (Homer et al 2015). This dataset maps land cover and land use across the United States at a 30 meter resolution. The NLCD data were first reclassified for generalization and resampled to the same spatial extent and resolution as the previous two datasets using a majority resampling technique that allocates each pixel's class based on the most popular value within a 3 by 3 window. This allowed each grid cell to have a unique land cover classifier, which could then be programmatically used to extract values and characterize each relevant vegetation type's relationship between soil moisture and wildfire. For the purposes of this study, only vegetated land cover types are of importance to wildfires. Accordingly, the developed/urban, barren land, and planted/cultivated classes were not considered in the analysis. The mixed forest class was not considered due to its unsuitably small number of pixels. Additionally, even though model simulations of wetland soil moisture may not be accurate due to missing physical processes, we include this class to represent general wet/dry responses in wetland environments. Figure 1 shows a visualization of this processed land cover data along with the other two datasets mentioned above.
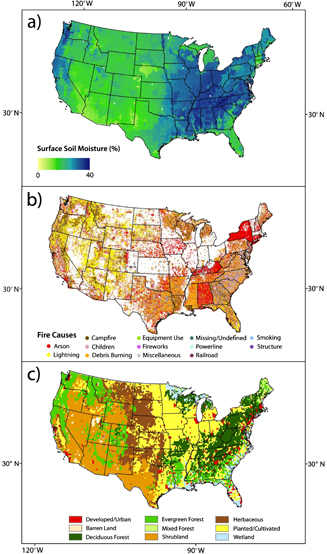
Figure 1. The datasets used in this study: (a) GRACE-derived volumetric surface soil moisture expressed as percent. This example shows average January–April surface soil moisture from 2003–2013. (b) All fires from the 2003–2013 study period in the FPA FOD mapped as points by fire cause. (c) The NLCD 2011 resampled to a 0.25 degree resolution.
Download figure:
Standard image High-resolution image3. Methods
3.1. Data processing
The first step in algorithm development was to disaggregate the fire data by wildfire size class (table 1). Annual January through April (2003–2014) soil moisture from the GRACE-derived CLSM-DA data were averaged into single two-dimensional maps (latitude × longitude) for each year that depict a fire season's antecedent moisture conditions (Xystrakis et al 2014). Annual total fire occurrence and cumulative burned area maps, aggregated from the rasterized FPA FOD data, were produced for each wildfire class, covering the period ranging May through April of the following year. This time period was selected in order to delineate a nominal fire season in line with the beginning of the western US fire season, although true fire season tends to vary in time and by location (Westerling et al 2003). Within each land cover type, all burned area and fire occurrence values—which here refers to the total number of fires occurring in a given grid cell—were plotted against corresponding CLSM-DA soil moisture values for the entire population of 0.25 degree grid cells. While wildfires belonging to a smaller size class constitute only a fraction of a percent of their parent grid cell, the frequency of their occurrence within each discretized area is an important climatological figure linking soil moisture to fire activity.
Table 1. Fire size class definitionsa.
| Class | Burned acres |
|---|---|
| A | 0–0.25 |
| B | 0.26–9.9 |
| C | 10–99.9 |
| D | 100–299 |
| E | 300–999 |
| F | 1000–4999 |
| G | 5000 + |
aClass size ranges are defined by (Short 2015).
This produced a distribution of fire occurrence, visible in figure 1, and burned area as a function of soil moisture for each land cover class. These data were then binned by soil moisture ranges to calculate average fire occurrence and burned area values over each range. These distributions reveal the unique relationship in each land cover class between occurrence of wildfires of increasing size classification as a function of soil moisture state. These relationships were then individually modeled by fitting an exponential or linear function depending on which resulted in a higher R2 value. If neither function's R2 surpassed 0.5, meaning pre-season soil moisture explains less than 50% of the variance in fire activity, mean number of fires and mean burned area were plotted instead. This methodology is displayed for fire occurrence in figure 2 for each land cover type and fire size class, and the same method was followed for burned area.
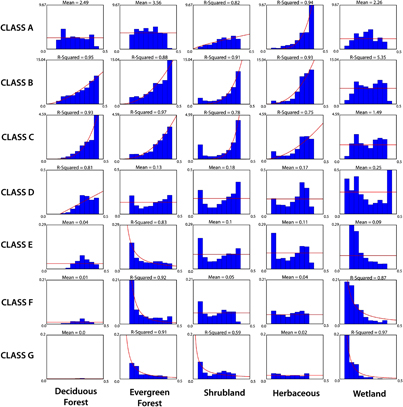
Figure 2. Binned average fire occurrence over each complete year and associated fitted functions or mean values for each analyzed land cover type by fire size class. The x-axis of each chart denotes surface soil moisture as a percentage, and the y-axis shows the average number of fires per 0.25 degree cell for that soil moisture bin. The fire size classes are defined by Short (2015), displayed in table 1.
Download figure:
Standard image High-resolution imageWe also investigated whether the information contained in these relationships with soil moisture demonstrated predictive utility. Comprehensive deterministic prediction is challenging, because we don't include all of the information required to determine the comprehensive source and forcing for all fire occurrence and severity; variables such as lightning strikes, human activity, wind gusts, and fuel loading all contribute substantially to actual wildfire predictability. Instead, we investigate a statistical tendency of soil moisture to affect wildfire occurrence by lumping a large population of observations into a single model and evaluating how the population responds as whole to this single factor. We assume that the population captures the probable best estimate of the relationship that would occur at a single location under different conditions and across time. A comprehensive fire prediction model could likely include other forcing variables.
3.2. Predictive model
Each modeled distribution's fitted function or mean was referenced for mapping fire probability and predicted burned area. Fire probability and average burned area were calculated by applying each individual pre-season soil moisture value to the function corresponding to its land cover type for the relevant fire size class. Probable total burned area (equation (1)) is then estimated by multiplying the modeled fire occurrence by the modeled average burned area value for each cell's soil moisture value as broken down by land cover type and fire size class
In equation (1), i is a given 0.25 degree grid cell, and SMi and LCi are the corresponding values of soil moisture and land cover classification. Maps for both predicted number of fires and predicted burned area were thus created for each fire size class. These maps, binned by fire size for each parameter, can be added together to create maps for a year's total predicted number of fires and total burned acreage.
4. Results
Figure 2 shows that within each land cover type, there are different distributions of fire occurrence as a function of soil moisture for each fire class. For example, within the evergreen forest type, the smaller fire classes B, C, and D tend to be more frequently associated with a higher average number of fires following high pre-fire season soil moisture. Meanwhile, the larger fire classes E, F, and G, show the opposite trend whereby dryer soil moisture conditions in January–April are associated with more fires throughout the following year. Some distributions are relatively uniform and show little variability. This indicates the absence of a clear relationship between soil moisture and fire occurrence, or that other factors tend to mask that relationship. Each vegetation type differs from the other in its surface soil moisture and fire occurrence and size patterns. Deciduous forest tends to be the wettest modeled ecosystem (mean volumetric water content fraction = 0.31, standard deviation = 0.06) and shrubland tends to be the driest (mean volumetric water content fraction = 0.19, standard deviation = 0.05). Wetland ecosystems have the most fires per cell on average (11.46 fires per year, standard deviation = 16.79), while shrublands have the fewest (3.48 fires per year, standard deviation = 9.16). These values were calculated by compiling the preseason surface soil moisture and fire occurrence values across all cells within each land cover type for each year in the study period. These values indicate the need to disaggregate the relationship between fire occurrence and soil moisture by land cover type, as each type shows a significantly different fire response to soil moisture levels.

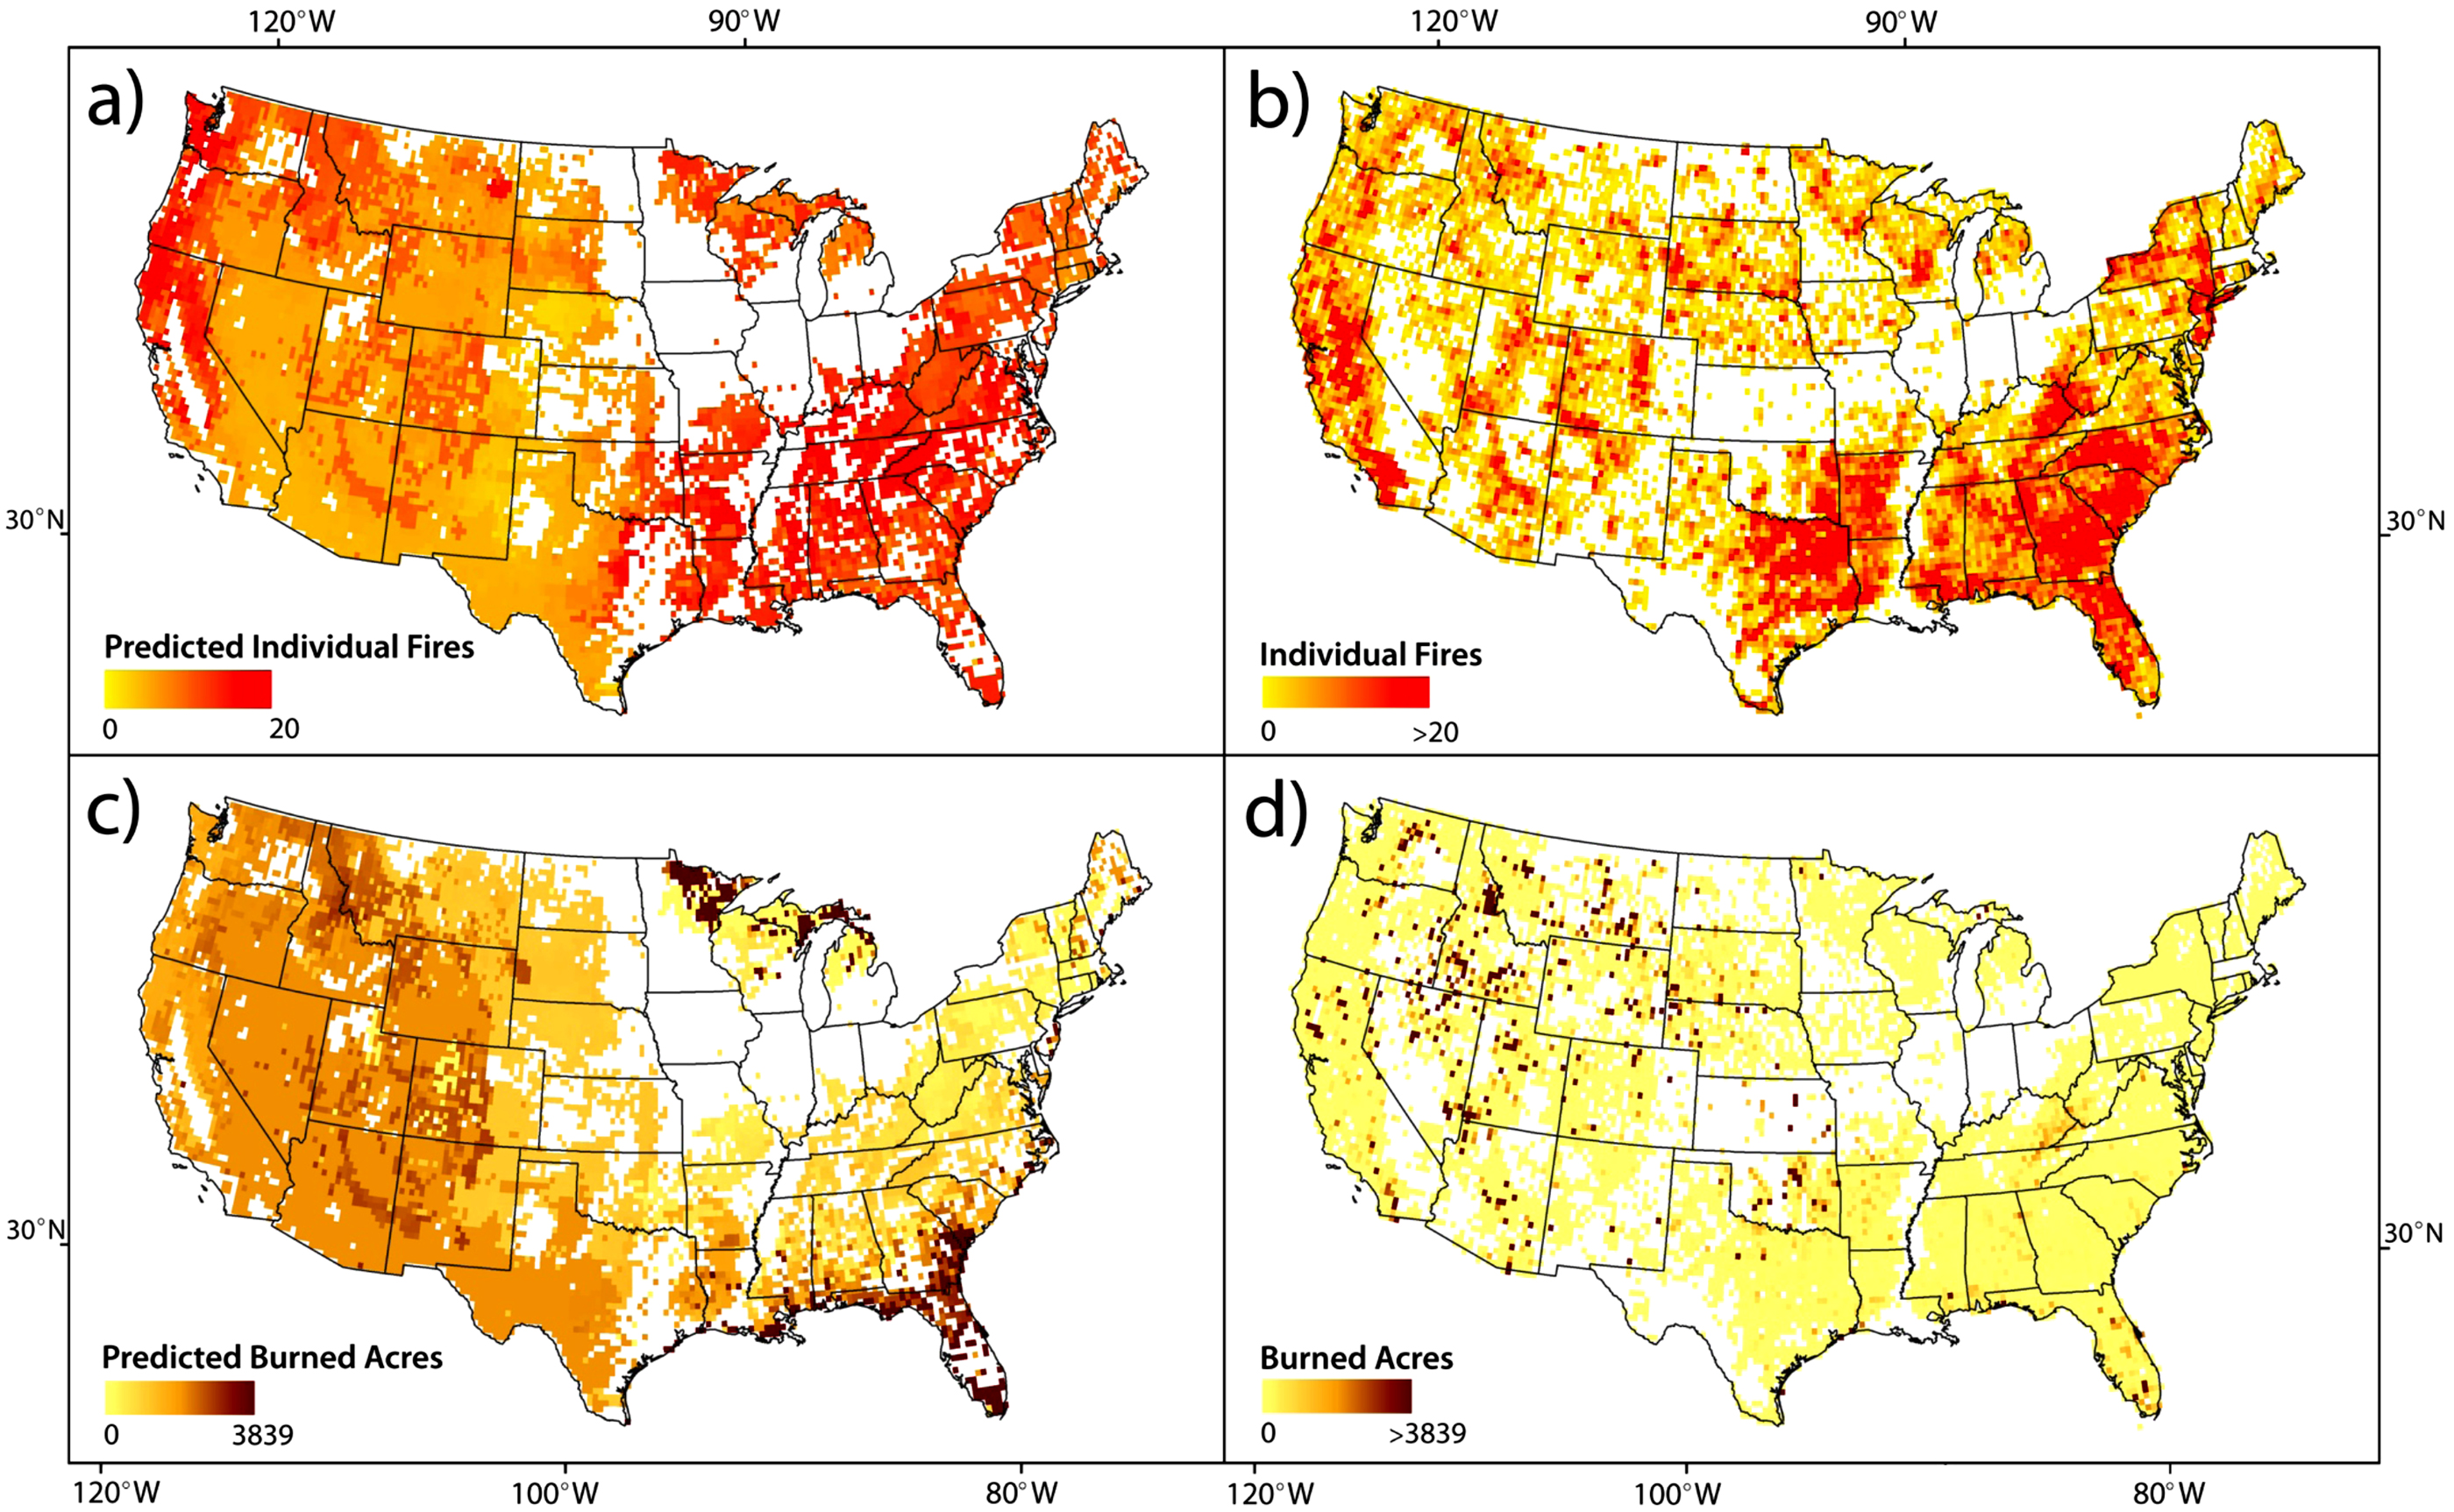
Figure 3. Predictive maps for (a) individual fires and (c) burned area to assess fire risk and potential from May 2012–April 2013. These predictive results are compared against the (b) actual fire distribution and (d) actual burned area for that year for validation.
Download figure:
Standard image High-resolution imageFigure 3 provides an example of results by hindcasting the May 2012–April 2013 fire year. The top map shows the total number of fires expected to occur in each cell that year based on the preceding January–April average soil moisture. Figure 3 (bottom) shows total predicted burned acreage. The spatial gaps in the predictive maps represent the withheld land cover classes. These maps were created for each year in the study period, and their summary statistics for predicted number of fires and total burned acres were compiled and charted in table 2 and figure 4.
Table 2. Predicted and actual fire data with associated prediction errors.
| Predicted fires | Actual fires | Predicted burned acres | Actual burned acres | Predicted fires percent error | Predicted burned area percent error | |
|---|---|---|---|---|---|---|
| 5/2003–4/2004 | 59410 | 53542 | 7356289.94 | 3333260.32 | 10.96 | 120.69 |
| 5/2004–4/2005 | 58131 | 44304 | 7429770.21 | 1288883.79 | 31.21 | 476.45 |
| 5/2005–4/2006 | 61526 | 72461 | 7472239.08 | 6710199.52 | 11.36 | 15.09 |
| 5/2006–4/2007 | 56998 | 66903 | 7343697.15 | 7181219.66 | 2.26 | 14.81 |
| 5/2007–4/2008 | 57954 | 62238 | 7427601.87 | 8680825.32 | 6.88 | 14.44 |
| 5/2008–4/2009 | 56177 | 59937 | 7357446.45 | 3887901.30 | 6.27 | 89.24 |
| 5/2009–4/2010 | 56337 | 43507 | 7407664.38 | 1603893.48 | 29.49 | 361.86 |
| 5/2010–4/2011 | 61071 | 55468 | 7510430.96 | 4935915.82 | 10.10 | 52.16 |
| 5/2011–4/2012 | 57448 | 52897 | 7423439.20 | 5312742.66 | 8.60 | 39.73 |
| 5/2012–4/2013 | 55442 | 48679 | 7559133.21 | 8354888.73 | 13.89 | 9.52 |
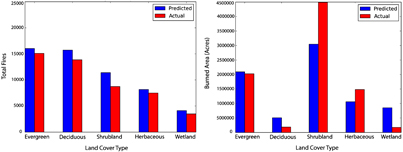
Figure 4. Validation of total predicted fires and burned acres from May 2012–April 2013.
Download figure:
Standard image High-resolution image
To validate these results, predicted fire occurrence and burned area maps that were generated for the 2012–2013 fire year (i.e. the most recent year in the FPA FOD dataset), and compared against the observations. For proper cross-validation, this fire year was held out of the algorithmic step. Results are compiled in table 2. Additionally, the processed FPA FOD data were disaggregated by land cover type and charted next to the predicted fire data, as shown for May 2012–April 2013 in figure 4, showing the relative accuracy of the algorithm's prediction for each vegetation type in addition to standard percent error calculations (equation (2))
Land cover types that were deemed unsuitable for the analysis (i.e. mixed forest, agricultural, barren, and urban) were removed from the data sets. Figure 4 shows that in the 2012–2013 case study, the values for predicted fire occurrence and burned area match the actual data within an error of 13.89% and 9.52% respectively, compared to an average error 13.10% for predicted fires and 119.40% for predicted burned area for the entire study period.
5. Discussion and conclusions
It should be noted that the predictive maps presented are not intended to offer an accurate hindcast of actual fire occurrence and severity in individual 0.25 degree grid cells. Rather, they offer an assessment of the relationship between seasonal soil moisture and wildfire potential, specifically the sensitivity of fires in the fire season to pre-season surface moisture conditions. The modeled functions and validation results show that the total number of fires and burned area predicted is in fact correlated with the pre-season soil moisture data for the corresponding year, across the land cover grouping. A positive correlation would indicate that high pre-season soil moisture is followed by high fire activity, while a negative correlation would see low fire activity. Regional hindcasting of fire occurrence was performed by aggregating the land-cover consistent regions in their entirety over the contiguous US, and optimizing the fire response model for each land cover type. This improves upon an ecoregion approach for which a number of included land cover types may exist, and a corresponding number of fire responses to moisture may occur (e.g. Parks et al 2014). The strong correlation achieved in our results highlights the principal importance of preseason soil moisture in governing fire risk and potential, likely as a proxy for preseason fuel accumulation.
These results provide the first evidence that pre-season soil moisture and wildfire occurrence can be strongly negatively correlated across land cover types. In all land covers, the smaller fire classes (i.e. class 'D' or smaller, <300 acres) are generally (11 out of 20 scenarios) associated with higher pre-season soil moisture, not lower soil moisture as hypothesized. This likely describes a situation in which smaller and quick-growing vegetation (e.g. grasses and understory) are more prolific in wet years, and tend to contribute to wildfire persistence and propagation after ignition. As the resampled NLCD 2011 data was implemented in our algorithm, land cover is assumed to be static over the study period. It is possible that this represents an additional error source in our regression, though there is no clear pattern in the percent error figures (table 2) and land cover changes likely represent a small fraction of the regressed relationships across the entire aggregated domain. The random error structure suggests that the model error is more associated with year-to-year weather and soil moisture patterns rather than land cover change. As soil moisture in this study is used as a proxy for vegetation moisture and general climate conditions, a wet pre-season in certain vegetation types is correlated with more primary production creating increased fuel availability when fire season arrives. This is further corroborated by observations made by Xystrakis et al (2014), which saw high spring precipitation succeeded by high burned area values. The case that would lead to the most fires in these land cover types is likely that of a very wet pre-season, followed by a very dry fire season. This relationship has been studied before using precipitation observations (e.g. Holden et al 2007).
While the necessity is clear, the feasibility of wildfire predictive capabilities is increasing with the advent of innovative applications of new remote sensing data. As our analysis focused on quantifying and validating the overall relationship between pre-season soil moisture and succeeding fire activity rather than providing accurate annual fire activity predictions, model outputs are not intended to be applied as accurate annual fire activity predictions. While the model illuminates this relationship, its performance may be negatively affected by limitations in the datasets and omitted environmental factors. For one, resampling the NLCD land cover to the coarser GRACE-DA resolution inevitably decreased the purity of each pixel's designated land cover type. Using finer-scale SMAP data to expand this analysis may mitigate these effects, and additionally improve the retrieval of burned area. Since accurate, observation-based surface soil moisture information has been difficult to obtain over large domains, GRACE-assimilated model outputs may offer a unique contribution to fire severity prediction methods. This builds upon successes in using GRACE-assimilated model outputs for hydrologic drought monitoring (Houborg et al 2012), and reinforces the importance of the relationship between large-scale hydrologic forcing and fire response. The current NASA SMAP mission (Entekhabi et al 2010), launched January 2015, offers global observations of radiometer-based surface soil moisture at a base 36 km spatial resolution that can be used in conjunction with GRACE-assimilation efforts and should generally improve this methodology. The expanding temporal and spatial coverage of soil moisture brought about by SMAP will additionally allow this methodology to be applied in regions with more heterogeneous land cover conditions due to higher resolutions. These more complex regions may also be approached with regionally sensitive environmental parameters to generate more accurate regional predictive fire maps. For example, the classification of large swaths of Minnesota and Michigan as wetland in the NLCD (figure 1) caused those areas' fire frequency to be greatly overestimated as a result of the high fire activity in Florida's Everglades and other wetland regions (figure 3). Indeed, the wetland regression models (figure 2) do not show high correlation coefficients except in the case of large fires, indicating regional processes controlling the majority of the variance. Other regional drivers of fire activity that see great spatial and temporal variability, such as fuel moisture, wind, and lightning patterns (Veraverbeke et al 2017) may further reduce the modeled discrepancies in fire occurrence and intensity. Along with the finer-scale SMAP data, the fundamental relationship between soil-moisture and fire activity observed in this study could be built upon using other environmental variables to generate monthly regional predictive fire maps.
Acknowledgments
This research was conducted at the Jet Propulsion Laboratory, California Institute of Technology, under contract with NASA. We would like to thank Mark Finney and Chuck McHugh, from the USDA Forest Service Predictive Services Program for their involvement in providing direction and information pertaining to wildfires in the United States. This work was supported by the NASA DEVELOP program, through contract NNL11AA00B and cooperative agreement NNX14AB60A. Funding sources include the NASA Applied Sciences Program and the NASA GRACE Science Team. The data supporting this study's conclusions consist of the included tables and figures. The FPA FOD data (Short 2015) can be accessed at https://doi.org/10.2737/RDS-2013-0009.3. The assimilated GRACE data is available at http://grace.jpl.nasa.gov. The NLCD 2011 is available at www.mrlc.gov/nlcd2011.php.