

Abstract
Recent years have seen an increased frequency of wildfire events in different parts of Arctic tundra ecosystems. Contemporary studies have largely attributed these wildfire events to the Arctic's rapidly changing climate and increased atmospheric disturbances (i.e. thunderstorms). However, existing research has primarily examined the wildfire–climate dynamics of individual large wildfire events. No studies have investigated wildfire activity, including climatic drivers, for the entire tundra biome across multiple years, i.e. at the planetary scale. To address this limitation, this paper provides a planetary/circumpolar scale analyses of space-time patterns of tundra wildfire occurrence and climatic association in the Arctic over a 15 year period (2001–2015). In doing so, we have leveraged and analyzed NASA Terra's MODIS active fire and MERRA climate reanalysis products at multiple temporal scales (decadal, seasonal and monthly). Our exploratory spatial data analysis found that tundra wildfire occurrence was spatially clustered and fire intensity was spatially autocorrelated across the Arctic regions. Most of the wildfire events occurred in the peak summer months (June–August). Our multi-temporal (decadal, seasonal and monthly) scale analyses provide further support to the link between climate variability and wildfire activity. Specifically, we found that warm and dry conditions in the late spring to mid-summer influenced tundra wildfire occurrence, spatio-temporal distribution, and fire intensity. Additionally, reduced average surface precipitation and soil moisture levels in the winter–spring period were associated with increased fire intensity in the following summer. These findings enrich contemporary knowledge on tundra wildfire's spatial and seasonal patterns, and shed new light on tundra wildfire–climate relationships in the circumpolar context. Furthermore, this first pan-Arctic analysis provides a strong incentive and direction for future studies which integrate multiple datasets (i.e. climate, fuels, topography, and ignition sources) to accurately estimate carbon emission from tundra burning and its global climate feedbacks in coming decades.
Export citation and abstract BibTeX RIS
1. Introduction
The northern high-latitude ecosystems (i.e. boreal forest and tundra) are experiencing climate warming at a rate twice that of the rest of the planet (ACIA 2004, Serreze and Barry 2011). As a result, recent years have seen increased wildfire activity in different parts of the boreal forests (Kelly et al 2013) and Arctic tundra ecosystems (AICC 2014). These ecosystems store ~50% of global terrestrial carbon (McGuire et al 2009, Schuur et al 2008, Young et al 2017), and one third of the world's soil carbon (Higuera et al 2008). Therefore, increased wildfire activity in these areas can release large carbon stocks to the atmosphere (Bond-Lamberty et al 2007, Mack et al 2011), which can substantially alter the global carbon budget and lead to a positive climate feedback. For example, the Anaktuvuk River Fire (ARF) of July 2007 was one of the largest high-latitude fire instances, and burned ~1000 km2 area in the Alaskan North Slope, releasing ~2.1 teragrams of carbon to the atmosphere—an amount equivalent to the annual net carbon sink for the entire Arctic tundra biome (Mack et al 2011). In addition, disturbances to Arctic vegetation, soils and permafrost as a result of wildfires inevitably alter the long-term physical, chemical and biological processes in the Arctic ecosystems (Mack et al 2011, Turetsky et al 2004). With continued climate warming in the Arctic throughout the 21st century (Kaufman et al 2009), potentially more wildfire events (Flannigan et al 2009) will engender far-reaching environmental consequences (Joly et al 2012).
Historically, Arctic tundra ecosystems have experienced limited burning compared to boreal forest ecosystems (Kasischke and Turetsky 2006). In recent years, however, tundra ecosystems have begun experiencing an unexpectedly high frequency of wildfire events (AICC 2014, French et al 2015). The 2007 ARF was a notable tundra fire that doubled the known total area burned since 1950 (Jones et al 2009, Mack et al 2011), where such fire events had been absent or unknown for the past 5000–10 000 years (Chipman et al 2015, Hu et al 2010, 2015). During 2010, the Noatak River Watershed (NRW) in northwestern Alaska experienced ~40 wildfire events (AICC 2014, Hu et al 2015). In 2015, two large wildfires in southwest Alaska burned ~ 160 km2 (D'oro 2015). These wildfires are primarily initiated by lightning strikes during thunderstorms (French et al 2015) and scientists have identified strong positive feedback loops among warming climates, increased lightning, and increased fire activities (Veraverbeke et al 2017). A strong climate-fire linkage has been found in the tundra regions (Hu et al 2015). However, this climate-fire relationship varies spatially in the Arctic, due to climatic 'thresholds' (Young et al 2017) and fuel requirements (Chipman et al 2015, Hu et al 2015).
While few contemporary studies have shed light on the spatio-temporal dynamics of increased wildfire scenarios and fire-climate associations (Chipman et al 2015, Hu et al 2015), detailed studies of Arctic wildfire dynamics have been limited to large fire events (e.g. ARF in 2007) and fires in specific geographic regions (French et al 2015, Hu et al 2010, 2015, Kasischke and Turetsky 2006, Rocha and Shaver 2011, Stocks et al 2003, Turetsky et al 2004). Also, fire events in the boreal forest have been studied more rigorously than tundra fires, partly due to the tundra's extreme environmental conditions (Hu et al 2015). However, with the recent availability of observational data of global fire disturbances, tundra fires have started to receive considerable attention (Hu et al 2015, Liu et al 2014, Loboda et al 2013, Loranty et al 2014), as these fires can play a significant role in global positive climate feedback mechanisms (Bret-harte et al 2013) and perturbations to ecosystem processes (Hu et al 2015). Despite this, existing studies of tundra fires suffer from spatially restricted paleofire records (Chipman et al 2015) as well as short observational fire records (Stocks et al 1998, 2003), which limit a comprehensive understanding of the spatial variability of tundra wildfire characteristics (i.e. number of fire events and their intensity) and their climatic associations in the planetary context. Such a broad understanding is essential for accurately assessing and predicting fire-driven ecosystem responses and potential climatic feedback across circumpolar tundra regions.
To address this need for a comprehensive and broad understanding, our study has leveraged NASA's Terra MODIS-derived recent active wildfire records (2001–2015) and climate reanalysis products (i.e. NASA MERRA-Land) to provide a planetary/circumpolar view of space-time patterns and climatic associations of Arctic tundra wildfires. Two key questions answered in this study are:
- 1.What are the spatial (distribution and clustering) and temporal (seasonal/annual and multiyear) patterns of wildfire occurrences and their intensity characteristics in the circumpolar Arctic tundra?
- 2.What is the nature of the relationship between wildfire occurrence/intensity and climatic factors over the following three temporal scales: 15 year period (2001–2015 average), seasonal (May–October average for each year) and monthly (individual months of wildfire occurrence: May–October)?
In other words, this study aimed to elucidate explicit spatio-temporal patterns and climate associations of circumpolar tundra wildfires to shed new light on tundra wildfire–climate relationships in the planetary context.
2. Data and methods
2.1. Study area
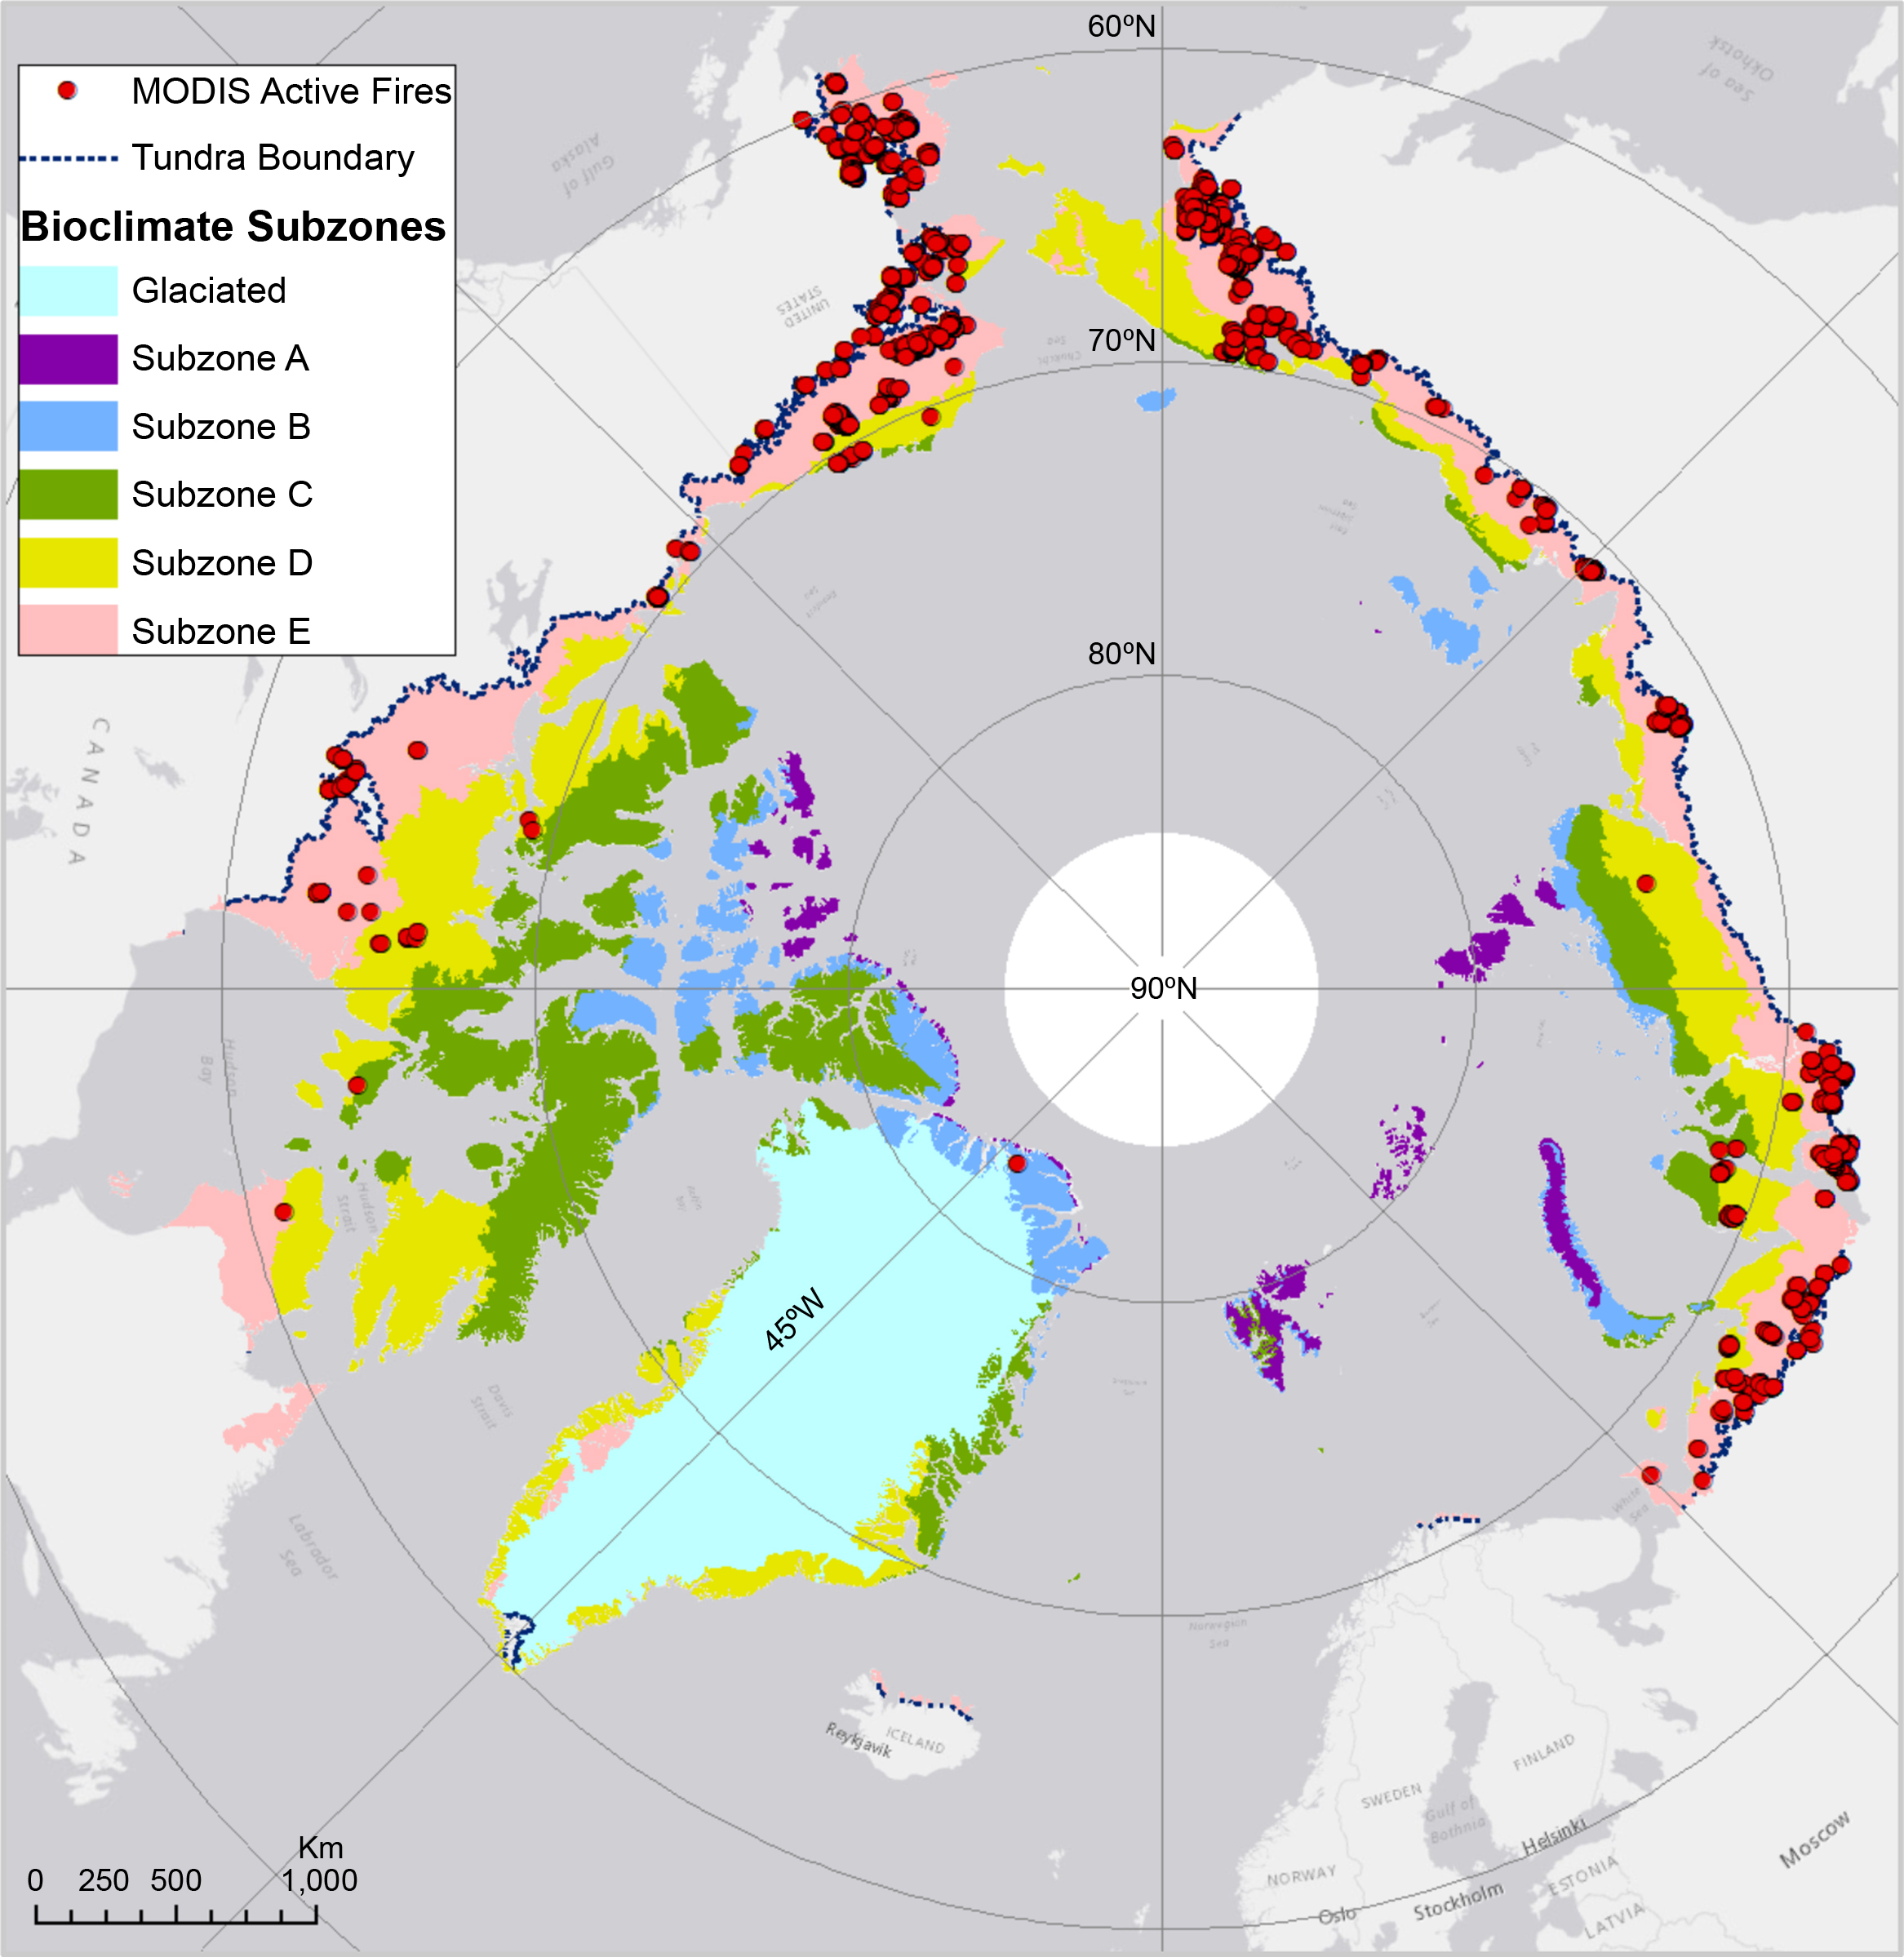
The circumpolar Arctic bioclimatic subzones map (CAVM Team 2003, Walker et al 2005) was used to delineate a boundary for pan-Arctic tundra regions (figure 1).

Figure 1. MODIS active fire pixels (2001–2015) in circumpolar Arctic tundra bioclimatic subzones (CAVM Team 2003, Walker et al 2005). Here, each fire pixel represents a temporal snapshot of ongoing wildfire activity which we characterized as a 'wildfire event'.
Download figure:
Standard image High-resolution image2.2. Response and explanatory variables
Tundra wildfire instances (i.e. the number of MODIS-derived active fire pixels) and their intensity characteristics (fire radiative power or FRP) were used as response variables (see Giglio 2013). Four primary MERRA-Land climate variables and two derived variables for soil surface temperature anomalies and surface precipitation anomalies (see table 1) were used as explanatory variables (see Reichle 2012).
- 1.Active fire data: This study used NASA Terra's Moderate Resolution Imaging Spectroradiometer (MODIS) active fire products (Collection 5; 15 years, from 2001–2015) that provide a new generation of moderate resolution (~1 km) remotely-sensed global fire datasets (Justice et al 2002). The MODIS active fire data are available at a daily timescale, and contain pixels flagged as burning hotspots by the fire detection algorithm (Giglio et al 2003) as well as additional parameters (Loboda and Csiszar 2007). It should be noted that MODIS fire detection may be affected by factors such as cloud cover, low intensity burning, and small fires (<1 km2). Nevertheless, MODIS-derived data can be considered as a reasonable approximation of total fire size and fire growth. For instance, the MODIS sensor was able to capture 83% of the ARF burned area (Hu et al 2010). Each MODIS-detected fire pixel is documented in point-based vector data format (i.e. shapefile) conducive for representation and spatial analysis in a GIS environment. These point shapefiles are projected in the World Geodetic System (1984 version) and contain the following attributes: latitude, longitude, brightness of Channel 21/22 (in Kelvin), scan, track, acq-date, acq-time, satellite, confidence (0%–100%), version (collection and source), brightness temperature of Channel 31, and fire radiative power (FRP). FRP is a measure of the amount of energy in megawatts released by the detected fire per unit time, and is a characterization of fire intensity (FIRMS FAQ 2017). As each fire pixel/point represents a temporal 'snapshot' of ongoing fire activity captured by the satellite overpass, henceforth we will discuss each MODIS active fire snapshot as a 'fire event'.
- 2.Climate data: This study used the Modern-Era Retrospective analysis for Research and Applications (MERRA) land data, which is a NASA atmospheric reanalysis product for the satellite era, using version 5 of the Goddard Earth Observing System (GEOS-5) model and its associated data assimilation system (Reichle 2012). The MERRA-Land dataset contains hourly averages of land surface fields (i.e. surface temperature) from 1 January 1980 at a horizontal resolution of 2/3° longitude by 1/2° latitude. We retrieved the following MERRA-Land climate variables for each month between 1980 and 2015: (1) mean soil surface temperature, (2) total surface precipitation, (3) top soil layer moisture content, and (4) evaporation from land.
2.3. Methods
2.3.1. Preparation of response and explanatory variables
Using the following steps, raw active fire and climate datasets were processed to make data amenable for exploratory and explanatory statistical analyses:
- 1.
- 2.MERRA-Land climate variables were primarily stored in a multi-dimensional array-based Network Common Data Form. Using the Geospatial Data Abstraction Library and Python scripting, we extracted and organized climate variables for individual months and years (1980–2015). Similar to the active wildfire dataset (2001–2015), these climate data are WGS-1984 projected within 2/3° longitude by 1/2° latitude grid cells.
- 3.The number of active wildfire events and their intensity (FRP) values were then aggregated into 2/3° longitude by 1/2° latitude grid cells, to investigate a wildfire–climate relationship for later analysis.
- 4.To examine potential climatic influence on wildfire characteristics (i.e. number of wildfire events and their intensity), we calculated average monthly soil surface temperature and precipitation anomalies with respect to the 1980–2009 base period for each month that overlapped the timeline (2001–2015) of our wildfire dataset.
2.3.2. Exploratory spatio-temporal analysis of tundra wildfires
To analyze the spatial pattern of circumpolar tundra wildfire activity from 2001–2015, we employed exploratory spatial data analysis (ESDA) techniques available in ArcGIS and GeoDA (Anselin 2005) software environments. Specifically, we examined patterns of spatial association, clusters/hot-spots, and spatial outliers based on the aggregated (2001–2015 timeline and per grid cell) average fire intensity. We examined the presence of both global and local spatial autocorrelations of tundra wildfire intensity (FRP) using Moran's I and LISA (local indicators of spatial association; Anselin 1995) statistics, respectively.
We examined seasonal patterns of tundra wildfires per grid cells between 2001 and 2015. Our analysis focused on identifying the overall temporal window per season within which tundra wildfires were usually confined, as well as within-season variability of total fire event counts and average fire intensities.
2.3.3. Explanatory analysis of tundra wildfire–climate relationship
To understand wildfire–climate dynamics, we investigated tundra wildfire–climate relationships with a series of correlation, regression, and classification statistics at three distinct temporal scales: Scale 1: 15 year or long-term (2001–2015 aggregate wildfire activity vs. average climatic parameters), Scale 2: multi-year seasonal (each season's aggregate wildfire activity vs. seasonal and monthly climatic variables), and Scale 3: monthly (monthly wildfire activity vs. climatic parameters in the same and preceding three months). The methods we employed at various temporal scales were as follows:
- 1.Multi-scale (scale 1, 2, and 3) correlation matrices: Pearson correlation statistics were utilized to examine potential associations between average monthly/yearly/seasonal wildfire characteristics (i.e. number of wildfire events and their intensity) and climate parameters. The scale 1 analysis was used to examine if there were statistically significant associations between 15 year averaged climate variables per grid cell and averaged wildfire characteristics per same grid cell. Scale 2 and 3 followed a similar strategy to identify wildfire characteristics and climate association for multi-year seasonal and monthly averaged values per grid cell.
- 2.Scale-2 logistic regression and Random Forest classification: The wildfire–climate relationship was investigated at the seasonal scale (for each year over the 15 year period) with a binary logistic regression and a tree-based classification method (Random Forest). At this multi-year seasonal scale, the dataset consisted of one response (yes/no fire occurrence) and 72 climatic predictor variables (six climate variables for each month of a year, see table 1), and 940 observations (both fire and non-fire grid cells) across circumpolar tundra. Half of the grid observations (470) contained wildfire events for each season between 2001 and 2015. The other 470 (non-fire) grids were randomly selected around neighboring wildfire grids. Some monthly climate variables exhibited strong multi-collinearity, which was investigated and resolved using following variable selection methods: step-wise subset selection, least absolute shrinkage and selection operator regression, and principal component analysis. Finally, statistical models were fitted to examine the tundra wildfire–climate relationship.
Table 1. Active wildfire and climate variables.
| MERRA variable names | Description | Units |
|---|---|---|
| Explanatory variables (MERRA-Land) | ||
| TSURF | Mean soil surface temperature (including snow) | K |
| PRECTOT | Total surface precipitation | kg m−2 s−1 |
| SFMC | Top soil layer moisture content | kg m−2 s−1 |
| EVLAND | Evaporation from land | kg m−2 s−1 |
| (For detailed information on MERRA-Land climate variables, see Gelaro et al 2017, Reichle 2012) | ||
| Temperature and precipitation anomalies | 2001–2015 average monthly TSURF anomaly | K |
| 2001–2015 average monthly PRECTOT anomaly | kg m−2 s−1 | |
| Response variables (MODIS Active Fires) | ||
| Total-Fire | Total number of active wildfire events per spatial grid cell | |
| Average FRP | Average wildfire intensity per spatial grid cell | MW |

Figure 2. LISA-derived spatial autocorrelation of circumpolar tundra fire intensity.
Download figure:
Standard image High-resolution image3. Results
3.1. Observed spatio-temporal patterns of tundra wildfires
Spatial patterns: Our exploratory spatial data analysis (ESDA) found that circumpolar tundra wildfire activities between 2001 and 2015 were clustered. These clustered patterns were mostly observed in the tundra regions of Alaska, the Canadian Arctic and north-eastern Russia (figure 1). Statistically significant spatial autocorrelation of wildfire intensity using both global (Global Moran's I index: 0.148, p-value: 0.00, z-score: 8.107) and local (LISA) autocorrelation measures (at 95% confidence level; figure 2) were identified. This analysis demonstrates that some tundra regions consistently experienced elevated levels of wildfire frequency and intensity between the 2001–2015 period.
Temporal patterns: Over the study period (2001–2015), annual tundra wildfire seasons spanned over roughly six months beginning in May or June, and ending in September or October. To investigate within-season variations in the number of wildfire events and their average intensities, we aggregated yearly wildfire events into three seasonal sub-groups: May–June (early season), July–August (mid-season), and September–October (late season) (figure 3). It is evident that despite slight variability, most of the wildfire events occurred in the early to mid-summer months (June, July and August; figure 3 (top)). In some years (i.e. 2006, 2011, 2012 and 2015) early season wildfires were prevalent. Seasonal wildfire trend of 2007 stood out as an exception due to the ARF in the Alaska's North Slope that burned from July to early October (Jandt et al 2012, Jones et al 2009).
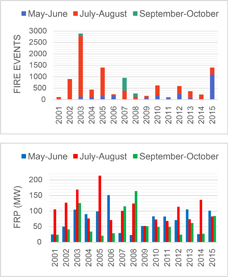
Figure 3. Temporal distribution of MODIS-derived active wildfire events (top) and their average intensity (bottom).
Download figure:
Standard image High-resolution imageThe wildfire intensity (FRP) exhibited somewhat varying temporal patterns across fire seasons. Early year (2001–2006) wildfire intensities were higher mostly between early to mid-summer months (figure 3 (bottom)). In 2007–2008 period, late-season (September–October) high intensity wildfires were prevalent. Particularly in 2007, the ARF burned slowly through July–August and accelerated in intensity in early September until it was covered by snow in early October (Jandt et al 2012). Later year wildfires had roughly early-season high intensity patterns until 2015, when late-season wildfire intensity elevated again.
3.2. Multi-scale wildfire–climate relationships
3.2.1. Overall wildfire–climate relations from multi-scale correlation matrices
Scale 1: The average 15 year (2001–2015) aggregated climate and average seasonal wildfire characteristics per grid cell exhibited some weak, but revealing correlations (table 2(a)). Wildfire intensity was found to be correlated negatively with land evaporation, surface precipitation, and surface precipitation anomalies, and positively with surface temperature anomalies. This analysis did not find any statistically significant correlations between climatic conditions and the number of wildfire events.
Table 2. Correlation matrices: (a) Scale 1: long-term (15 year) aggregated wildfire intensity and number of wildfire events vs. 15-year average climate parameters (2001–2015); (b) Scale 2: seasonal (May–October) average wildfire intensity and number of wildfire events vs. preceding winter and spring climate parameters; (c) Scale 3: monthly average wildfire intensity and number of wildfire events vs. wildfire month's and preceding three months' climate parameters.
| Correlation between spatially aggregated climate parameters and wildfire characteristics at three temporal scales | Pearson correlation coefficients | |||
|---|---|---|---|---|
| (a) Scale-1 | 15-year average wildfire characteristics | |||
| FRP | Total wildfire events | |||
| 15 year average climate | Evaporation (EVLAND) | −0.12a | 0.04 | |
| Precipitation (PRECTOT) | −0.17b | −0.03 | ||
| Precip. (PRECTOT) Anomaly | −0.12a | −0.04 | ||
| Temperature (TSURF) | −0.03 | 0.02 | ||
| Temp. (TSURF) Anomaly | 0.13a | 0.06 | ||
| Soil Moisture (SFMC) | −0.11 | −0.01 | ||
| (b) Scale-2 | Seasonal (May–October) average wildfire characteristics | |||
| FRP | Total wildfire events | |||
| Seasonal average climate | Winter (November– March) average | Evaporation (EVLAND) | 0.3b | 0.16b |
| Precipitation (PRECTOT) | −0.16b | −0.02 | ||
| Precip. (PRECTOT) Anomaly | −0.03 | −0.01 | ||
| Temperature (TSURF) | −0.1a | −0.03 | ||
| Temp. (TSURF) Anomaly | 0.03 | 0.05 | ||
| Soil moisture (SFMC) | −0.16b | −0.11a | ||
| Seasonal average climate | Spring (April–May) average | Evaporation (EVLAND) | 0.11a | 0.08 |
| Precipitation (PRECTOT) | −0.2b | −0.05 | ||
| Precip. (PRECTOT) Anomaly | −0.08 | −0.01 | ||
| Temperature (TSURF) | 0.07 | 0.07 | ||
| Temp. (TSURF) Anomaly | −0.03 | 0.08 | ||
| Soil moisture (SFMC) | −0.15b | −0.09 | ||
| (c) Scale-3 | Monthly average wildfire characteristics | |||
| FRP | Total wildfire events | |||
| Present fire-month average climate | Evaporation (EVLAND) | −0.18b | −0.04 | |
| Precipitation (PRECTOT) | −0.133b | −0.09a | ||
| Precip. (PRECTOT) Anomaly | −0.085a | −0.11b | ||
| Temperature (TSURF) | −0.01 | 0.1a | ||
| Temp. (TSURF) Anomaly | 0.02 | 0.08 | ||
| Soil Moisture (SFMC) | −0.2b | −0.17b | ||
| Pre-fire 3 month average climate | Evaporation (EVLAND) | −0.01 | 0.06 | |
| Precipitation (PRECTOT) | −0.24b | −0.1a | ||
| Precip. (PRECTOT) Anomaly | −0.18b | −0.08a | ||
| Temperature (TSURF) | 0.1a | 0.11b | ||
| Temp. (TSURF) Anomaly | 0.06 | 0.12b | ||
| Soil Moisture (SFMC) | −0.18b | −0.1a | ||
aCorrelation is significant at the 0.05 level (two tailed). bCorrelation is significant at the 0.01 level (two tailed).
Scale 2: The analysis of aggregated seasonal (May–October) wildfire characteristics and average winter (November–March) climatic conditions per grid cell revealed that an increase in the seasonal wildfire intensity was associated with reduced surface precipitation, surface temperature, and soil moisture levels (table 2(b)). Elevated land evaporation levels in both winter and spring (April–May) were associated with increased wildfire intensity in the following summer. Additionally, reduced winter and spring average surface precipitation and soil moisture levels were associated with increased wildfire intensity. This scale-2 analysis also revealed that increased number of summer wildfire events were associated with increased land evaporation and decreased soil moisture levels in the preceding winter.
Scale 3: Our monthly level analysis also captured statistically significant associations between climatic conditions and wildfire intensity and number of wildfire events per grid cell (table 2(c)). We found that an increase in monthly average FRPs was associated with reduced levels of average land evaporation, total surface precipitation, precipitation anomalies and soil moisture of the same month. Similar negative associations were found between wildfire month's average FRPs and previous three-month period's average soil moisture, surface precipitation, and precipitation anomalies. Moreover, increased average surface temperature of the previous three months revealed statistically significant association (however, at 0.05 significance level) with the wildfire month's average FRPs.
Similar to the FRPs, number of wildfire events revealed statistically significant association with climate parameters. We found that increased number of tundra wildfire events were associated with fire month's decreased levels of soil moisture, surface precipitation, and precipitation anomalies. Increased wildfire activity was also associated with increased surface temperature level. Additionally, the previous three month's decreased surface precipitation, precipitation anomalies, and soil moisture levels were associated with increased number of monthly wildfire events. Pre-fire months' average increase in surface temperature and temperature anomaly levels showed association (at 0.01 significance level) with increased number of wildfire events.
Overall, it is evident that a dry environmental condition resulting from increased surface temperature and decreased surface wetness (as a function of decreased surface precipitation and soil moisture levels) in the wildfire month and previous three months were associated with increased number of higher intensity wildfire activity in the circumpolar tundra between 2001 and 2015.
3.2.2. Climatic drivers of seasonally aggregated tundra wildfire occurrence
The linkage between the tundra's seasonally aggregated wildfire activity and average monthly climate (prior and during the wildfire season) (Scale 2) has been revealed by both binary logistic regression and random forest classification models. For the binary logistic regression, a test of the full model against a constant only model was statistically significant, indicating that the climate predictors provided a set of variables which reliably distinguished between wildfire and non-wildfire grids (chi square = 200.369, p-value <0.001 with degree of freedom = 19). Overall prediction success was 66.4% (66.0% for no-fire and 66.8% for yes-fire). Table 3 demonstrates that negative surface precipitation anomalies in the later part of the winter (February) and early summer (June–July), as well as positive surface temperature anomalies in the early spring (April) and some summer months (June and October) increased the likelihood of circumpolar tundra wildfire events.
Table 3. Scale-2 binary logistic regression output: likelihood of wildfire occurrence and climate variables.
| Explanatory variables | Logistic coefficients (B) | Wald | p-value |
|---|---|---|---|
| EVLAND_July | 28072.409 | 7.143 | 0.008 |
| TSURF_Oct | 0.057 | 6.989 | 0.008 |
| PRECTOT_anom_Nova | 37424.230 | 6.566 | 0.01 |
| PRECTOT_anom_Deca | 32664.377 | 8.919 | 0.003 |
| PRECTOT_anom_Feb | −24915.468 | 4.919 | 0.027 |
| PRECTOT_anom_Jun | −55097.360 | 18.881 | 0.000 |
| PRECTOT_anom_Jul | −24496.329 | 7.095 | 0.008 |
| PRECTOT_anom_Sep | 24594.405 | 11.947 | 0.001 |
| TSURF_anom_Deca | −0.077 | 11.976 | 0.001 |
| TSURF_anom_Mar | −0.066 | 8.628 | 0.003 |
| TSURF_anom_Apr | 0.143 | 15.090 | 0.000 |
| TSURF_anom_Jun | 0.242 | 36.639 | 0.000 |
| TSURF_anom_Oct | 0.157 | 19.388 | 0.000 |
aThese MERRA climate variables of November and December correspond to the winter months that precede the wildfire season.
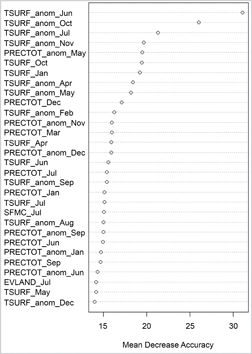
To supplement the logistic regression analysis, Random Forest classification—a non-linear, decision tree-based ensemble learning algorithm, was used to re-examine the tundra wildfire–climate relationship. In doing so, we randomly partitioned the wildfire-climate dataset into training (75%) and test (25%) data samples. Therefore, out of total 940 'yes-fire' and 'no-fire' observations (spatial grids), 705 were randomly designated as training and 235 as test observations. The fitted model on training sample grids (27 climate variables were used for splitting at each tree node: best mtry parameter with least out of bag error) was then used to predict wildfire occurrence from the test sample grids. In terms of revealing climatic control over tundra wildfire event occurrences, the random forest model outperformed the binary logistic model by yielding improved classification (wildfire vs. no wildfires) accuracies, as suggested by the training AUC of 1.0 and test AUC of 0.895. The relative importance of the climate variables in classifying wildfire outcomes (yes/no wildfire) is shown in figure 4 (MERRA climate variables are ordered on the y-axis from top-to-bottom as most- to least-important; the x-axis represents relative importance).
Figure 4. Random Forest-derived variable importance plot: important climate variables that determined tundra wildfire vs. no wildfire events between 2001 and 2015.
Download figure:
Standard image High-resolution image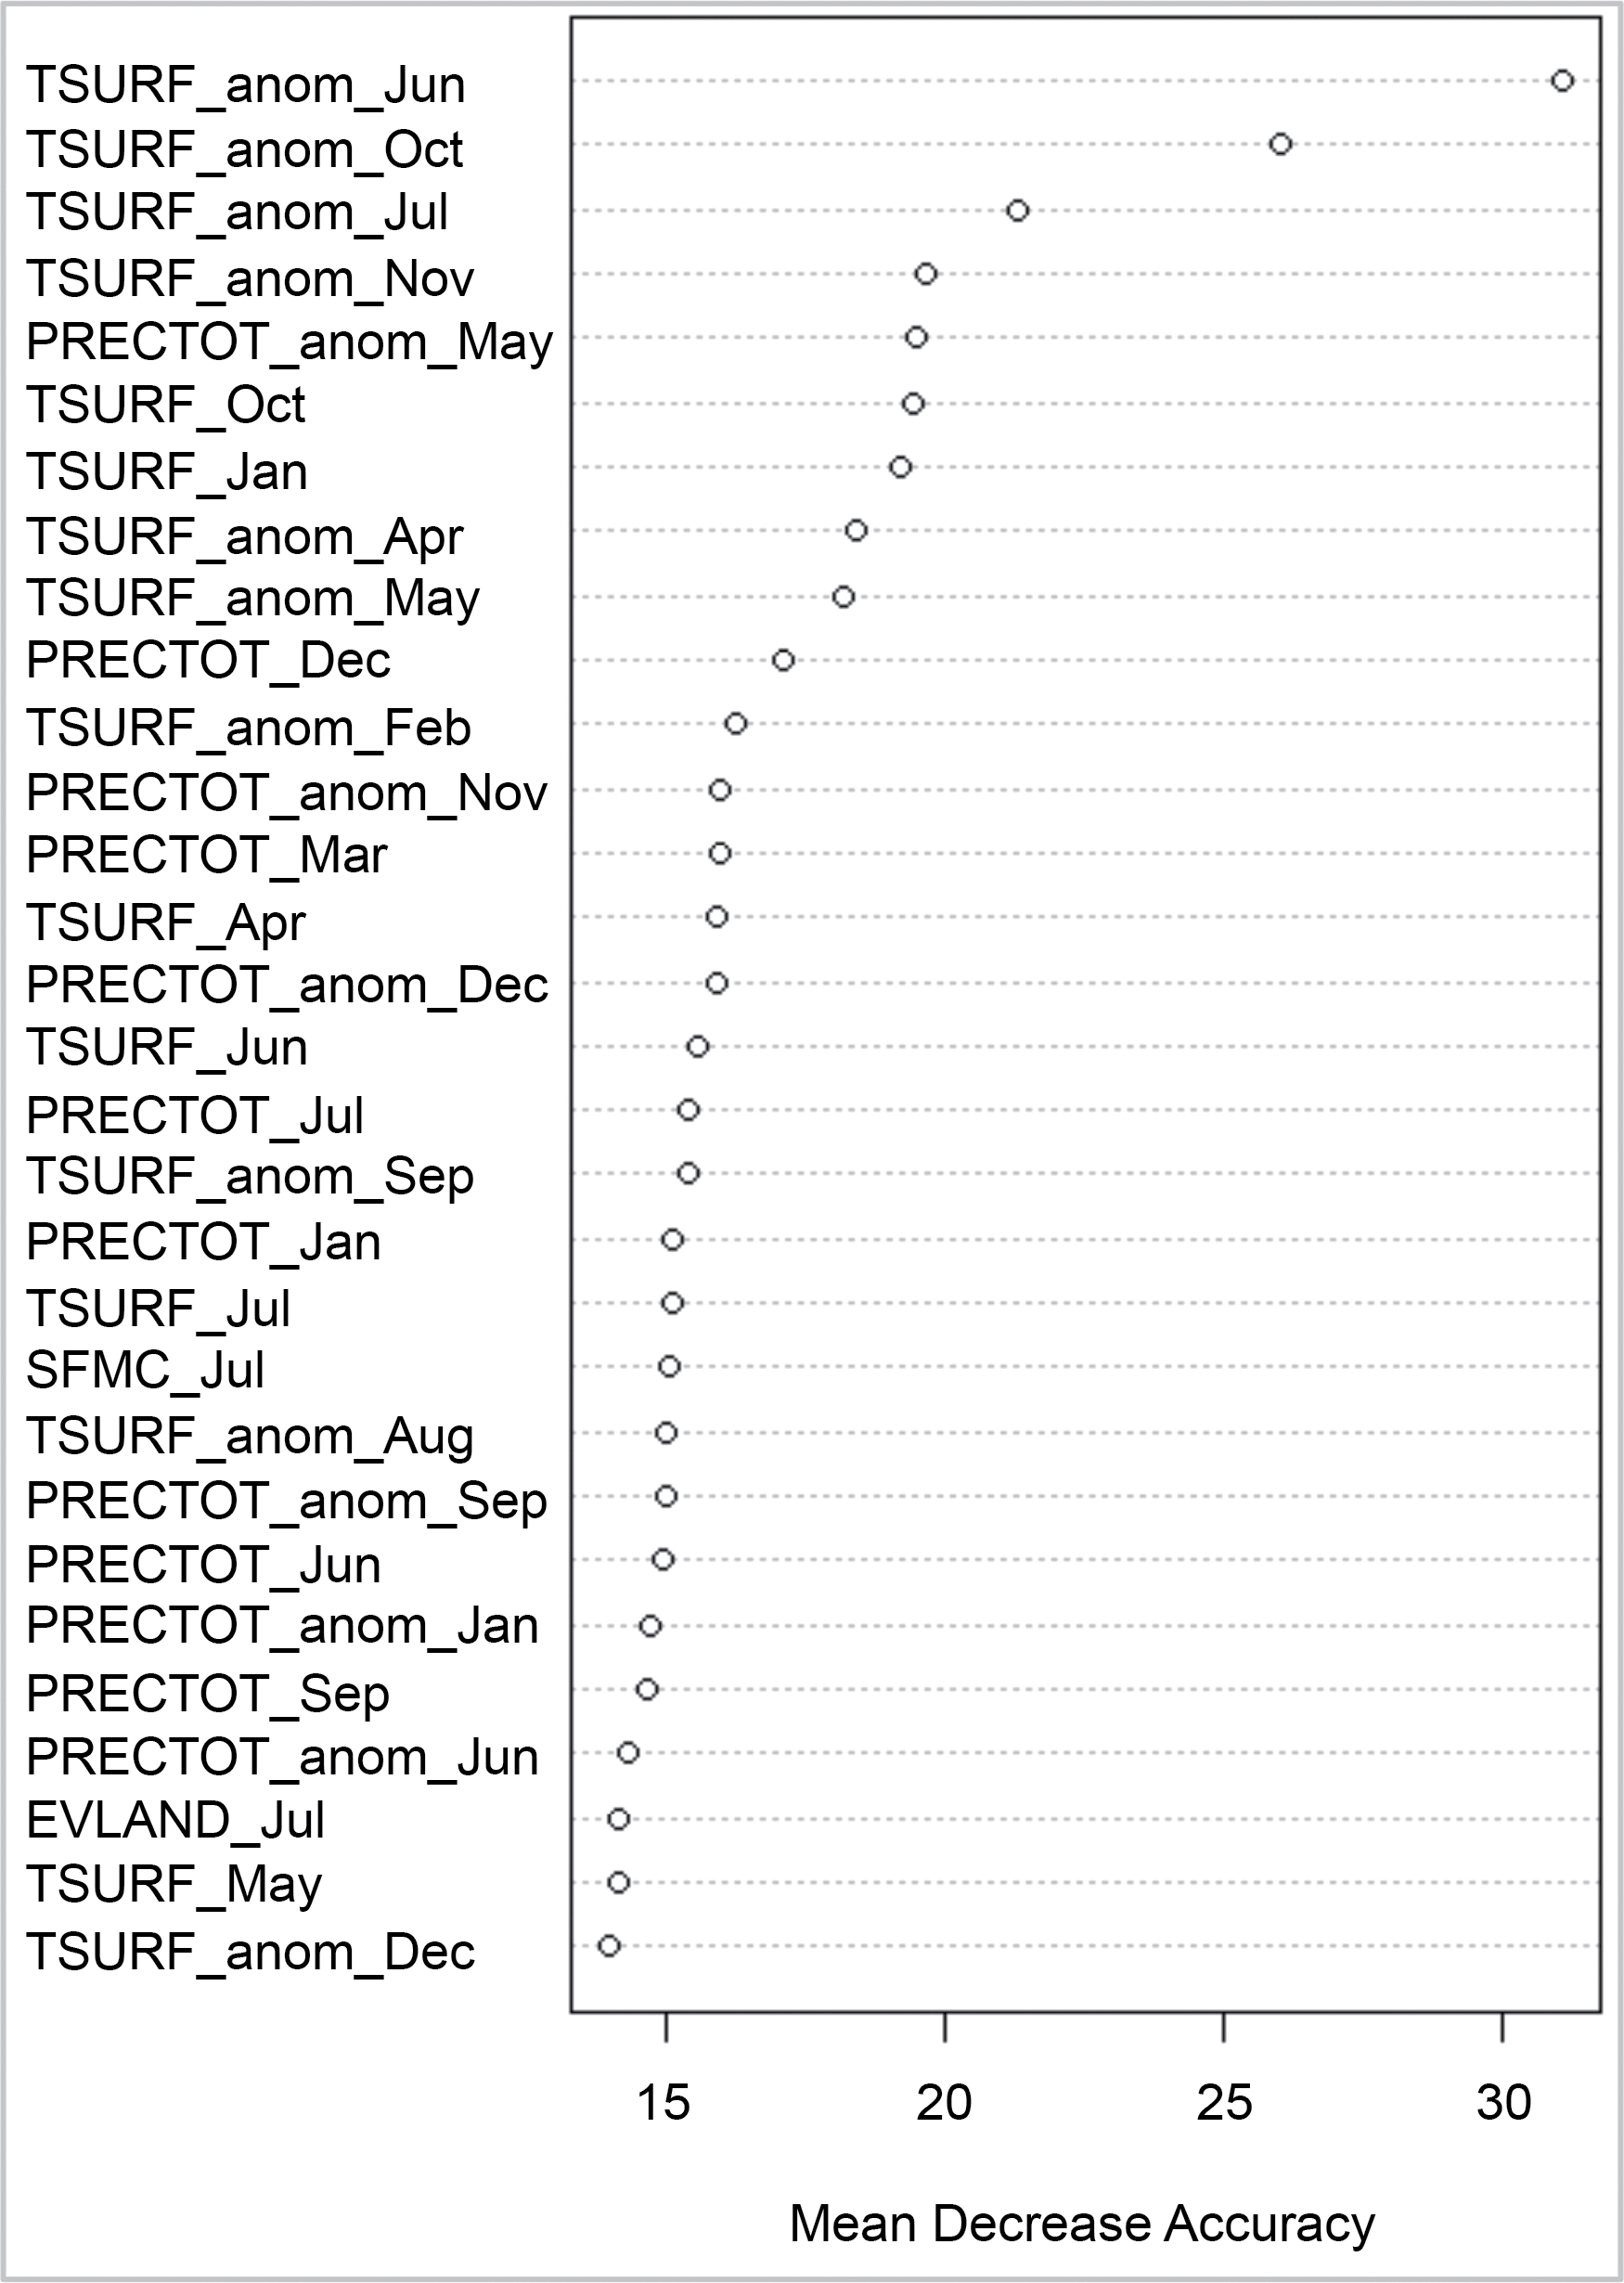
The June surface temperature anomalies (TSURF_anom_Jun in figure 4) were by far the most important variable in determining a yes-wildfire vs. no-wildfire event. Other relatively important climate variables were surface temperatures of summer (July, October) and winter (November, January), and spring (April, May) months. Importantly, both models agreed on the influence of summer surface temperature on tundra wildfire occurrence. Overall, our Scale-2 analysis indicated the influence of a dry and warm spring-summer condition on elevated wildfire occurrences in the Arctic tundra between 2001 and 2015.
3.2.3. Climatic drivers of tundra wildfire intensity
In examining the potential relationship between intensity (FRP) of tundra wildfire events and climatic parameters, we scaled down our analysis to the monthly level (Scale 3). Based on wildfire-ecological perspectives, we hypothesized that climatic characteristics of at-least three months' lag period (prior to the month of a fire event) may have been influential in determining wildfire intensity in the circumpolar tundra. Based on this hypothesis, a linear multiple regression model was developed using average monthly wildfire intensity per grid cell as a response variable and both that month's average and prior three months' average climatic conditions as explanatory variables. We also included number of monthly wildfire events as a predictor variable. The model output (table 4) suggests that climatic conditions were influential in determining wildfire intensity. As per model coefficients, lower surface precipitation, lower land evaporation, and warmer surface temperatures in the three pre-fire months had statistically significant relationships with more intense tundra wildfire events. Additionally, large wildfires (measured by multiple recorded wildfire events) tended to be more intense (more radiant heat output).
Table 4. Scale-3 linear multiple regression output: wildfire event numbers and intensity–climate linkage.
| Response variable: average monthly wildfire intensity | |||
|---|---|---|---|
| Explanatory variables | Slope | p-value | VIF |
| Present month's total wildfire events | 0.19 | 0.00 | 1.04 |
| Previous 3 month's land evaporation | −992054.38 | 0.002 | 3.94 |
| Previous 3 month's surface precipitation | −1947200.42 | 0.00 | 3.42 |
| Previous 3 month's surface temperature | 1.6 | 0.00 | 3.97 |
Adjusted R2: 0.24.
4. Discussion and conclusions
Our spatio-temporal analyses of MODIS-derived active wildfire data identified well-pronounced spatial and seasonal patterns of wildfire activity in the circumpolar Arctic tundra between 2001 and 2015. These high-latitude wildfire events were temporally bounded between May and October, with varying peak prevalence in June, July and August (typical peak summer months in the northern hemisphere). These wildfire events exhibited isolated clusters in space. Our analyses also found that wildfire intensity exhibited positive spatial autocorrelation, which suggests potential control of local climatic and bio-physical (i.e. availability of fuel) characteristics in influencing a tundra wildfire event's spatio-temporal extent and intensity. Most wildfires in Alaska, as well as northwestern and northeastern Russia showed this tendency. Our results are consistent with findings from recent studies that focused on the patterns of tundra wildfires in Alaska (Chipman et al 2015, Hu et al 2010, 2015, Rocha et al 2012, Young et al 2013).
Our multi-scale correlation analyses and statistical models (primarily for an interpretation purpose) found statistically significant associations of tundra wildfire occurrence and intensity characteristics with climatic conditions, including surface temperature, surface precipitation, soil moisture, and land evaporation. These statistical analyses point to the potential influence of elevated surface temperature and lower surface precipitation on a wildfire event likelihood and intensity. During the months preceding a wildfire event, especially between spring to mid-summer, surface temperature and soil moisture content were demonstrated to be important climatic factors in determining wildfire occurrence and wildfire intensity. These results are consistent with findings from recent regional studies (French et al 2015, Hu et al 2015, Rocha et al 2012, Veraverbeke et al 2017, Young et al 2017). Our study extends the current state-of-knowledge on tundra wildfire–climate dynamics to a circumpolar level. For instance, based on paleofire record analysis, Chipman et al (2015) attributed differentiated burning across Alaskan tundra to the spatial heterogeneity of climatic conditions over long time scales. Similarly, results from our pan-Arctic study suggest that diverse climatic conditions across circumpolar tundra landscapes may have been responsible for the spatio-temporal variation in wildfire occurrences and burning intensities.
Our study provides following key insights into space-time patterns and climatic factors associated with Pan-Arctic tundra wildfires between 2001 and 2015.
- Overall, wildfires in the Arctic tundra biome were spatially clustered and wildfire intensities were spatially correlated (i.e. high intensity or low intensity wildfires were locally clustered). Most of the wildfire events occurred in the peak summer months (June, July, and August) (see figures 2 and 3).
- Warm and dry spring (April and May) and summer/fall (June–October) months were strongly influential in determining wildfire occurrence, number of wildfire events (i.e. small or large fires), and wildfire intensity. In other words, higher surface temperature and lower soil moisture content (resulting from less surface precipitation) during the spring and summer months generally increased wildfire occurrence and wildfire intensity (see figure 4 and tables 2, 3 and 4).
- Winter surface temperatures demonstrated influence on the likelihood of wildfire occurrence in the following summer (see figure 4). Moreover, a decrease in the average winter surface precipitation and soil moisture levels were associated with higher intensity wildfire events (see table 2(b)). However, further investigation is required to better capture the influence of individual winter month's (November–March) climatic condition on summer wildfire characteristics.
The tundra wildfire–climate relationships demonstrated in this paper support current understanding of the potential impacts of a warming Arctic on the Arctic's bio-geophysical systems at multiple spatio-temporal scales. As opposed to a local level and per wildfire event impact, here we have provided a broad examination of the climatic associations of tundra wildfires spread across the entire Arctic region. Although an explicit relationship between climatic conditions in the Arctic and tundra wildfires was demonstrated, it should be interpreted with caution (particularly, relationships related to evaporation from land and soil moisture). Although the MERRA climatic data allowed the practical investigation of these relationships at a planetary scale, as a re-analysis product, the MERRA datasets inherently contain a certain amount of uncertainty. For a landscape that covers different continents, and encompasses heterogeneous biogeophysical and climate systems, uncertainty in capturing exact relationships among components is expected. Hence, we suggest future research (especially those that focus on specific regions) to incorporate data on climatic (e.g. 2 m air temperature, precipitation, evapotranspiration, etc) conditions, topographic and fuel/vegetation characteristics, and atmospheric disturbances (e.g. thunderstorms) in statistical models to gain more holistic understanding of the factors that influence tundra burning, similar to the boreal forests study by Veraverbeke et al (2017). These type of future studies could build on this study by helping to more clearly elucidate the drivers of the spatial variability of wildfire occurrence and intensity across the Arctic and explain the clustering patterns evidenced in this study. This understanding will be indispensable as ongoing and future shifts in Arctic climate and vegetation are likely to cause additional warming (Pearson et al 2013) and therefore potentially more wildfire events. As projected by a 2014 study (Romps et al 2014), with each degree Celsius of warming, more thunderstorms will lead to a 12% increase in lighting strikes, which, in turn, may create positive feedback for more wildfire events. Our findings therefore provide a strong incentive and direction for such research initiatives that integrate multiple datasets to estimate future tundra burning under projected warming and lightning scenarios. These types of studies could allow estimating potential carbon emission amounts across circumpolar regions, and would enhance our understanding of circumpolar tundra's contribution to global climate feedbacks in coming decades.
Acknowledgments
We thank Jonathan Voss for his assistance in processing MERRA-Land data, two anonymous reviewers for their constructive feedback, and Donna Peuquet and Cary Anderson for their useful comments on an earlier draft of this manuscript. We are also grateful to Dr Ramathanan Sugumaran (1968–2017) and Jonathon Launspach for contributing at the early stages of this project. This project has been supported in part by the National Science Foundation (NSF) under Award #1338850.