

Abstract
In a changing climate and society, large storage systems can play a key role for securing water, energy, and food, and rebalancing their cross-dependencies. In this letter, we study the role of large storage operations as flexible means of adaptation to climate change. In particular, we explore the impacts of different climate projections for different future time horizons on the multi-purpose operations of the existing system of large dams in the Red River basin (China–Laos–Vietnam). We identify the main vulnerabilities of current system operations, understand the risk of failure across sectors by exploring the evolution of the system tradeoffs, quantify how the uncertainty associated to climate scenarios is expanded by the storage operations, and assess the expected costs if no adaptation is implemented. Results show that, depending on the climate scenario and the time horizon considered, the existing operations are predicted to change on average from -7 to +5% in hydropower production, +35 to +520% in flood damages, and +15 to +160% in water supply deficit. These negative impacts can be partially mitigated by adapting the existing operations to future climate, reducing the loss of hydropower to 5%, potentially saving around 34.4 million US$ year-1 at the national scale. Since the Red River is paradigmatic of many river basins across south east Asia, where new large dams are under construction or are planned to support fast growing economies, our results can support policy makers in prioritizing responses and adaptation strategies to the changing climate.

Original content from this work may be used under the terms of the Creative Commons Attribution 3.0 licence. Any further distribution of this work must maintain attribution to the author(s) and the title of the work, journal citation and DOI.
1. Introduction
More than half of the world's rivers are regulated by dams (Nilsson et al 2005), forming a cumulative storing capacity greater than 20% of the total annual runoff (Vorosmarty et al 1997). In many developed countries the opportunities for constructing new dams are coming to an end (Gleick and Palaniappan 2010), with some cases already experiencing dams' removal (Doyle et al 2003, Kibler et al 2011). On the contrary, developing countries seem still to offer untapped potential, at least according to the World Bank, which estimated total hydropower capacity in Africa and south east Asia exceeding 1,900 GW, i.e., nearly four times the currently installed capacity in Europe and North America (World Bank 2009).
Large storage projects contribute positively to regional growth and development by increasing water availability for different economic sectors, producing relatively carbon-neutral energy, and reducing flood risk (Biemans et al 2007, Fernandez 2013, Giuliani 2014, Vliet and Aerts 2015). Yet, dams alter the natural hydrologic regimes by moving water volumes in space and time (Haddeland et al 2014) with potentially negative impacts on ecosystem services (Ziv et al 2012, Castelletti et al 2014), habitat fragmentation (Grill et al 2015), and sediment transport and dynamics (Wild and Loucks 2014). Pressure on water resources is further raising as a consequence of climate change and growing populations, which are expected to severely affect freshwater availability in many regions of the world (IPCC 2013). This increasing stress mandates rethinking how large storages are operated by enlarging the scope of their operations across sectors and by adopting effective tools to analyze the potential of re-operation options under current and projected conditions (Arnell and Lloyd-Hughes 2014, Harrison et al 2015). Re-designing the existing storages' management strategies has indeed a strong potential for enhancing the flexibility and the adaptive capacity of water systems, without the need of structural upgrades and their associated financial outlays (Anghileri et al 2011, Georgakakos et al 2012).
In this letter, we study the role of large storage operations as flexible means of adaption to changing climatic forcing in south east Asia. We consider the Red River system, China–Laos–Vietnam, as a study site. The Red River is the second largest river basin in Vietnam, the 5th largest in south east Asia, and is paradigmatic of most river basins in the region. The catchment has been experiencing rapid development in terms of population and economic growth (Devienne 2006). People are moving from the rural areas to the main cities and to the capital Hanoi producing an increase in water and energy demands, and also in the potential impact of extreme floods (Hung et al 2010). Around 20 million people currently live in the delta region, with 6.5 million only in the Hanoi metropolitan area, where the population density is higher than 2,000 inhabitants per km2, making it one of the most densely populated places in the world (Devienne 2006). As part of the medium-long term energy and food security national strategy, a number of large dams were constructed on the Red River tributaries over the last 20 years for a cumulated storing capacity of 19.86 billion m3, and other three dams are under construction for an additional total capacity of 3 billion m3.
The daily operations of these dams has been designed on the basis of the observed hydrologic variability and the historical demands to ensure adequate levels of hydropower production, guarantee water supply for multiple uses in the Red River delta, and mitigate downstream flood, primarily in the capital city Hanoi (Hung et al 2010, Le Ngo et al 2008, Castelletti et al 2012a). Yet, no guarantee exists that the existing operations will not fail in coming years under the additional pressures of the rapid economic and demographic national developments (Toan et al 2011), along with the expected detrimental effects of climate change (see Arndt et al (2015) and references therein). Determining the potential of the existing network of large reservoirs for securing energy and food under change does require exploring the following main questions: are the current system operations vulnerable with respect to the projected climate change impacts? Which sector is expected to be more exposed to negative impacts? Which is the cost of no adaptation? A number of works already studied climate change impacts in Vietnam focusing on single specific sectors (Adger 1999, Booth et al 1999, Yu et al 2010, Gebretsadik et al 2012, Chinowsky et al 2015, Neumann et al 2015), predicting positive and negative variations of hydropower production by more than 5% depending on the climate scenario, 10% decrease of the average yields for annual crops, and increased risk of flooding due to higher frequency of extreme events (Arndt et al 2015). Yet, these projections are highly variable, depending on the sector and the climate scenario considered. This emphasizes the need of enlarging the perspective in climate change analysis for better understanding the projected evolution of the system performance across sectors and the associated uncertainties.
In this letter, we contribute a multi-objective assessment of the role of large storages in compensating the adverse effects of climate change. We consider multiple climate projections and different future time horizons to estimate the changes in the overall system performance as well as in the tradeoffs across the Red River system multi-sector services. This scenario-led approach (Wilby and Dessai 2010) allows identifying the main vulnerabilities of current storage operations, understanding the risk of failure across the sectors, quantifying the uncertainty associated to the climate scenarios, and assessing the expected costs if no adaptation is implemented (Prudhomme et al 2010). In particular, we explore the impacts of a perturbed physics ensemble of climate projections (i.e., a set of scenarios obtained with different parameterizations of the same climate model) on the multi-purpose operations of the three largest reservoirs in the basin, namely Son La, Hoa Binh, and Tuyen Quang. Since these future climate patterns are derived from a single global climate model for a given emission scenarios, they probably underestimate the climate variability that can be explored by combining different emission scenarios, global, and regional climate models. Though, the model and the scenario we consider are the ones officially adopted by the Vietnamese Government as future baseline in strategic long-term planning decisions, from economic development and infrastructure expansion to water resources planning. Providing a better understanding of the future system performance and the associated performance uncertainties as predicted by the 'official' climate model holds remarkable policy implications for many water institutions in south east Asia (Vastila et al 2010, Arias et al 2012) and worldwide (Stumpe 2009), which often prefer relying on a single baseline scenario for strategic planning (Haasnoot and Middelkoop H 2012). In fact, the projections of the climate change impacts from the global scale to the variety of stakeholders' objectives impacted by the storage operations allows investigating the evolution over the next century of the system's tradeoffs. The same operating policy designed on the basis of the observed hydrologic variability can perform differently in terms of fairness and equity of water resources sharing (Sokona and Denton 2001, Thomas and Twyman 2005) just because of changed climatic conditions. Finally, the paper also quantifies the operational adaptive capacity of the Red River system, namely the theoretical upper limit for adaptation via improved and more informed operations of the existing storages, in order to support prioritizing policy responses and adaptation strategies.
2. Study site
2.1. The Red River basin
The Red River basin (figure 1) is a transnational basin covering an area of 169,000 km2 between Vietnam (51.3%), China (48%), and Laos (0.7%). The three main tributaries of the Red River (Da, Lo, and Thao) rise in the northern part of the basin and join before reaching the large flood plain in the delta region, which extends over 21,000 km2. The basin is characterized by a tropical monsoon climate with two well distinct seasons: the wet season, from May to October, and the dry season from November to April. The average flow in the Red River measured at Son Tay varies from 8,000 m3/s during the monsoon peak to 1,500 m3/s in the dry months.

Figure 1. The Red River system map.
Download figure:
Standard image High-resolution imageThree main competing sectors drive the current system operations: hydropower production, flood control, and water supply. The first aims at maximizing the energy production, which replaces the profit maximization due to the lack of an energy market. The second sector aims at protecting the city of Hanoi, which is periodically affected by catastrophic floods events during the monsoon season (Kort and Booji 2007). The last sector aims at providing adequate water supply to a variety of water related activities in the Red River delta, where agriculture accounts for 58% of the total water demand and involves around 50% of the local workers in 501,000 ha of cultivated fields fed by a dense artificial canals network. After the Mekong River delta, the Red River delta is the second largest rice production area of the entire Vietnam, which is, in turn, the second-largest rice exporter in the world (Yu et al 2010). All these sectors are expected to be affected by climate change (Arndt et al 2015), thus calling for a better understanding of the climate change impacts on both the overall and the inter-sector system performance. In particular, we measure the system performance in terms of (i) daily average hydropower production(Jhyd (GWh day-1)); (ii) daily average flood damage, quantified by a dimensionless nonlinear function of the water level in the city of Hanoi (Jflood (-)); (iii) daily average squared deficit with respect to the total water demand of the Red River delta (Jsupply (m3 s-1)2).
2.2. Methodology
We adopt a three-step methodology (figure 2) for assessing the impact of climate change on the multiple sectors affected by the storage operations and for identifying their operational adaptive capacity. Core of the procedure is an integrated model of the Red River system combining conceptual and data-driven models to represent catchments, reservoirs, power plants, river stretches and the delta. All these components have been calibrated and extensively validated against observational data. Their accuracy in reproducing the historical data, measured in terms of coefficient of determination, is reported in table 1, while further details about model building and performance are provided in the supplementary material. The methodology is as follows:
- i.The integrated model of the system is used to design the optimal operations of Son La, Hoa Binh, and Tuyen Quang reservoirs under historical conditions (black lines in figure 2) via evolutionary multi-objective direct policy search (Giuliani et al 2015). This step yields a set of Pareto optimal solutions, representing different tradeoffs between hydropower production, flood control, and water supply, which provide the water authorities with a rich context for supporting the identification of candidate compromise alternatives.
- ii.The set of solutions obtained at the previous point is re-evaluated via simulation under multiple climate projections and different future time horizons to discover the main system's vulnerabilities if no adaptation is implemented (blue lines in figure 2). In addition, this step provides a better understanding of the risk of failure across sectors by exploring the evolution in time of the system tradeoffs and by quantifying the performance uncertainty associated to different climate scenarios.
- iii.The adaptation to the new climate is explored by re-optimizing the operations of Son La, Hoa Binh, and Tuyen Quang reservoirs based on the projected climate change scenarios (red lines in figure 2). This step hence identifies the operational adaptive capacity of the existing reservoirs for mitigating the adverse climate change impacts on the system performance.

Figure 2. Schematization of the methodology. The black line shows the historical optimization workflow, the blue line the re-evaluation under climate change, and the red line the identification of the adaptive capacity by full adaptation of the system's operations.
Download figure:
Standard image High-resolution imageTable 1. Performance of the different components of the integrated model of the Red River systems in reproducing historical observations.
| Model | Validation method | R2 in validation |
| HBV Da River | 1975–2004 calibration; 1961–1974 validation | 0.897 |
| HBV Thao River | 1975–2007 calibration; 1961–1974 validation | 0.846 |
| HBV Lo River | 1980–2000 calibration; 1961–1979 validation | 0.815 |
| HBV Gam River | 1980–2001 calibration; 1961–1974 validation | 0.880 |
| Son La reservoir | observed storage 2011–2012 | 0.996 |
| Hoa Binh reservoir | observed storage 2002–2012 | 0.998 |
| Tuyen Quang reservoir | observed storage 2008–2012 | 0.991 |
| Son La power plant | observed production 2011–2012 | 0.997 |
| Hoa Binh power plant | observed production 2007–2012 | 0.995 |
| Tuyen Quang power plant | observed production 2008–2012 | 0.996 |
| Water level in Hanoi emulator | K-fold crossvalidation over 62-years sample dataset | 0.979 |
| Water deficit emulator | K-fold crossvalidation over 62-years sample dataset | 0.940 |
2.3. Climate change scenarios
This work focus on the official climate projections adopted by the Vietnamese authorities, which consider the HadCM3 General Circulation Model (Gordon et al 2000) forced with the A1B emission scenario (IPCC 2000). To study the sensitivity of the system performance with respect to small variations in the climate scenario, we consider a 5-members perturbed physics ensemble of projected temperature and precipitation, provided by the Vietnam Institute of Meteorology, Hydrology and Environment (IMHEN). This ensemble is obtained by using different parameterizations of the HadCM3 General Circulation Model and comprises a baseline scenario (Q0) obtained with the standard model's parameterization; two scenarios using alternative model's parameters that result in smaller and larger temperature increases (Q3 and Q13, respectively); and other two scenarios obtained by model's parameterizations that induce negative and positive precipitation changes, leading to drier (Q10) and wetter (Q11) conditions, respectively (see the supplementary material for further information).
These scenarios are downscaled, first, using the PRECIS regional modeling system (Jones et al 2004) and, then, using the Quantile Mapping statistical downscaling technique (Dèquè et al 2007). The corresponding projected streamflow trajectories in the Da, Thao, Lo, and Gam rivers are obtained by simulating the HBV models of the four sub-catchments forced with the projected trajectories of temperature and precipitation. The control scenario covers the period 1990–2010, while the future scenario spans the entire century. In the following analysis, we focus on two future time periods, namely 2040–2060 to assess medium-term impacts and 2078–2098 for long-term effects.
Figure 3 and table 2 compare the historical streamflow in the four rivers with the simulations over the horizon 2078–2098, as projected by the 5 scenarios. According to these projections, the future streamflow pattern will be characterized by a longer monsoon period (light gray area in figure 3) than the historical one (dark gray area in figure 3), with a general increase in the average annual flow, followed by a shorter but drier period as quantified by the low values of the 10th percentile (see table 2). Under the standard scenario Q0, we expect an average increase of the streamflow (i.e., +33.4% and +17.9% in the median and total annual flow) associated with high variability both in terms of dry and wet conditions (i.e., −29.1% in the 10th percentile and +14.7% in the 90th percentile). Coherently with their definitions, scenario Q10 is the one producing the lowest streamflow, resulting in the smallest average annual flow, while scenario Q11 is producing the highest streamflow peaks, captured by the highest 99th percentile. Finally, Q3 and Q13 show more variable streamflow patterns, with the former more similar to Q10 and the latter to Q0.

Figure 3. Comparison between historical streamflow patterns observed in the period 1990–2010 in the Da, Thao, Lo, and Gam rivers and simulations of HBV models forced with the climate change scenarios in the period 2078–2098 (5 days cyclostationary moving average). Shades illustrate the duration of the monsoon period over history (dark gray) and over climate change scenarios (light gray).
Download figure:
Standard image High-resolution imageTable 2. Summary of changes in the projected streamflow under the climate change scenarios in the period 2078–2098 with respect to the historical observations in the period 1990–2010 (average over the four rivers).
| Percentage (%) | Q0 | Q10 | Q11 | Q3 | Q13 |
| Annual flow | +17.9 | +6.8 | +19.9 | +10.5 | +21.5 |
| 10th percentile | −29.1 | -29.8 | −17.8 | -24.6 | -9.0 |
| 50th percentile | +33.4 | +22.9 | +31.7 | +24.9 | +41.6 |
| 90th percentile | +14.7 | +1.3 | +13.0 | +8.7 | +18.3 |
| 99th percentile | +27.7 | +19.7 | +34.9 | +15.8 | +21.1 |
3. Results and discussion
3.1. Policy performance under historical conditions
The aim of this section is the inter-sector analysis of the system performance, measured in terms of hydropower production Jhyd, flood damages Jflood, and water supply deficit Jsupply, achievable under historical hydroclimatic conditions by adopting alternative operations of the existing network of reservoirs. The performance of each solution is estimated via simulation of the integrated model of the Red River system over the historical horizon 1990–2010 using the observed streamflow trajectories. This analysis allows quantifying the space for a negotiated agreement representing a fair compromise between the conflicting interests involved. Figure 4(a) illustrates the performance of the designed Pareto optimal operating policies, where hydropower production and flood damages are plotted on the primary axes, while the water supply deficit is represented by the dimension of the circles. The black arrows indicate the directions of increasing preference, with the ideal solution (Utopia point) that would be represented by a small circle in the top-left corner of the figure, while each circle represents a different tradeoff between the three objectives.

Figure 4. Performance of the Pareto optimal policies over history (1990–2010), where hydropower production and flood damages are plotted on the primary axes, while the circles' size represents water supply deficit (top panel) and the black arrows indicate the directions of increasing preference. Average storage trajectories of Son La, Hoa Binh, and Tuyen Quang reservoirs obtained with policies PF, PH, and PS (bottom panels).
Download figure:
Standard image High-resolution imageResults show that a clear conflict exists between the maximization of hydropower production and the prevention of flood damages. The best performance in terms of Jflood (solution PF in the bottom-left corner of the figure) is obtained by maintaining the reservoirs' level as low as possible to buffer the monsoon peak of the inflows (see the solid lines in figure 4b). This strategy negatively impacts on the energy production due to the reduction in the water turbined and the losses in terms of hydraulic head during the dry season, when the reservoir is almost empty. On the contrary, given the dimensions of the reservoirs and the large power capacity installed, the best performance in terms of Jhyd (solution PH in the top-right corner of the figure) keeps the reservoirs at their maximum level and releases the full turbine capacity for the entire year (see the dashed lines in figure 4b). Beside reducing the buffering capacity during the monsoon season, this energy-driven operating policy increases the vulnerability of the water supply in the delta and attains very high values of water supply deficit (i.e., large circles). The conflict between flooding and water supply is instead weaker, because the drawdown of the reservoirs' level during the monsoon season is indirectly making available large water volumes in the Red River delta. However, the temporal difference between the peak of the monsoon and the water demand peak in February, associated to the submersion of the rice fields, requires an ad hoc operations of the reservoirs to attain the minimum values of Jsupply (solution PS, associated to the dotted lines in figure 4b), ultimately degrading the performance in terms of Jhyd and Jflood.
Overall, when evaluated over the historical hydroclimatic conditions, the set of Pareto optimal operating policies illustrated in figure 4 provides a rich context for understanding the complex management tradeoffs and dynamics in the Red River system and represents a valuable tool for supporting the identification of candidate compromise solutions. A potentially fair compromise policy (CP) to implement for balancing the three objectives is the one identified by the green cross in figure 4. This solution has been selected according to the criterion of the minimum distance from the Utopia point (Eschenauer et al 1990), which identifies the absolute optima of the three objectives (i.e., a small circle in the top-left corner of the figure). The CP performance is equal to Jhyd = 59 (GWh day-1), Jflood = 8634.7 (–), Jsupply = 55.01 (m3 s-1)2, i.e., better than 49% of the solutions in the Pareto optimal set in terms of hydropower production, 59% in terms of flood damages, and 45% in terms of water supply, thus equitably sharing the benefits within the competing sectors.
3.2. Policy performance under climate change
The variation of the hydrologic regime due to the climate change scenarios illustrated in figure 3 is likely to alter the medium and long term performance of the history-based policies illustrated in figure 4 as well as their tradeoffs between the operating objectives. To assess the vulnerabilities under projected climate of these solutions, we re-evaluated them via simulation over the period 2078–2098 under the five scenarios described in section 2.3. Figure 5 shows that climate change is expected to produce a general degradation of the system performance in all the sectors. The major concern is associated to the projected increase in the flood damages, which are on the average increasing (the circles move to the right) from 35% to 520%. In fact, the duration of the monsoon is expected to increase, with higher streamflow in September and October (figure 3). The history-based policies, however, tend to keep the reservoirs' level high in this period because the flood risk is supposed to be low and, consequently, they fail in controlling floods in Hanoi when exposed to this non-stationary alteration of the hydrologic regime. Ensuring flood protection under the projected scenarios results to be particularly challenging due to the projected increase in the Thao River streamflow during the monsoon season (figure 3), which is critical as this river is not regulated and directly contributes to the floods in Hanoi. Further expanding the flood buffering capacity of the system by damming also the Thao River might be an adaptation option to consider.
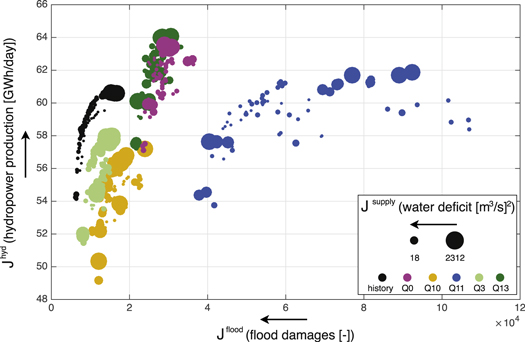
Figure 5. Re-evaluation of the history-based operating policies (black circles) over the period 2078–2098 under the five climate change scenarios (colored circles).
Download figure:
Standard image High-resolution imageOur results also show negative climate change impacts on water supply vulnerability in all the scenarios (colored circles are larger than the black ones), with the values of Jsupply that increase from 15% to 160% due to the expected decrease of the streamflow during the dry season. Given the importance of the Red River delta in terms of rice production, this climate change impact may represent a significant challenge for the future national food security, potentially forcing rice import from China and Thailand. Finally, the smaller variability in the average water availability (see the average annual flow in table 2) produces less pronounced impacts on the hydropower production, with variations in the values of Jhyd from −7% to +5%. Although the two drier scenarios (i.e., Q10 and Q3) induce modest reductions in hydropower production, the other three scenarios (i.e., Q0, Q11, and Q13) allow attaining even better performance in this objective. Yet, we expect increasing climate change impacts on hydropower when an energy market will be introduced in Vietnam (Nguyen 2007). In fact, depending on the energy price patterns, some periods of the year will be more valuable than others in terms of maximizing hydropower revenue, possibly inducing relevant losses if the energy price was high in winter, which is projected to be drier than now.
The analysis of the system performance illustrated in figure 5 allows exploring the full range of potential benefits and risk induced by the changing climate. This contributes in understanding how the uncertainty in the climate scenarios is transferred, and potentially amplified, when evaluated in terms of the operating objectives affected by alternative storage operations, ultimately altering the equity and fairness of the solutions. Under the baseline scenario (Q0), the performance of the candidate Compromise Policy identified in figure 4 is projected to degrade from +170% to +320% in terms of flood damages, and to change in water supply deficit and hydropower production from −63% to +3680% and from −3% to +7%, respectively, depending on the future operating policy adopted. The predicted performance changes under Q10 are more negative for hydropower production (i.e., from −16% to −3%) and water supply deficit (i.e., from −52% to +4100%), with less pronounced impacts on flood damages (i.e., from +20% to +177%). On the contrary, Q11 suggests that the long-term degradation of performance in terms of flood damages with respect to CP can vary from +337% to +1138%, which is 10 times greater than under scenario Q10. Finally, the impacts predicted by Q3 and Q13 are similar to the ones under Q10 and Q0, respectively.
The results in figure 5 also shows that the variability associated to the five scenarios affects the evolution of the system tradeoffs by modifying the shape of the tradeoff curves. The conflict between Jhyd and Jflood against Jsupply is exacerbated under the projected climate, with most of the colored circles in figure 5 that are larger than the ones under historical conditions. Moreover, the clear tradeoff between hydropower and flooding illustrated in figure 4 maintains the same shape only under Q10, though translated toward the bottom-right part of the objective space. This tradeoff curve becomes instead more vertical under Q0, Q13, and Q3, meaning that a small improvement in Jflood induces a large loss in Jhyd. Under Q11, it instead evolves toward a horizontal slope, where a small increase in hydropower production produces large flood damages. This evolution of the tradeoffs towards more pronounced conflicts, combined with the uncertainty in the long-term policy performance, hampers the identification of negotiated compromise solutions.
3.3. Climate change adaptation
The results discussed so far refer to a business-as-usual situation where, despite the evident changes in the hydroclimatic conditions, no adaptation measures are implemented. More realistically, the operations of the system will be adapted to the new conditions. To better understand the system vulnerabilities at different future time horizons and to assess the potential adaptive capacity of the system achievable by modifying the operations of the three reservoirs, we analyze the policy performance attained under the assumption of full adaptation to the projected future, i.e. we assume that the system operator recognizes the change and optimally re-operates the system based on the new hydrological conditions. The analysis is focused on scenarios Q10 and Q11, as these latter are the ones showing the largest impacts on the performance of the baseline operating policies.
Figure 6 contrasts the performance of the history-based solutions over the period 1990–2010 (black circles) first with their re-evaluation in the medium term (i.e., 2040–2060, shown in grey) and long term (i.e., 2078–2098, shown in orange and blue for Q10 and Q11 scenarios, respectively). In addition, the figure shows the performance of fully adapted operating policies over the period 2078–2098 (red circles). Again, the green crosses identify the performance of the candidate Compromise Policy, selected according to the criterion of the minimum distance from the Utopia point in the history-based Pareto optimal set evaluated over the historical period (CPh), along with its re-evaluation in the medium (CPQ10M, CPQ11M) and long (CPQ10L, CPQ11L) term. Using the same criterion, we also selected an Adapted Compromise Policy (ACPQ10, ACPQ11) within the fully adapted Pareto optimal set.

Figure 6. Comparison of the history-based operating policies' performance evaluated over different horizons, namely 1990–2010, 2040–2060, and 2078–2098, with the performance of fully adapted solutions over the long-term horizon 2078–2098 under Q10 (panel (a)) and Q11 (panel (b)) scenarios.
Download figure:
Standard image High-resolution imageResults suggest that the impacts on the policy performance are characterized by a non-stationary and non-monotonic trend. Over the period 2040–2060 under Q10 (figure 6a), we observe significant reductions in hydropower production and larger water supply deficit, while lower flood damages. The difference in the performance of CPQ10M with respect to CPh (measured in terms of Δ Jhyd,Δ Jflood , and Δ Jsupply ) are indeed equal to −12%, −28%, and +280%, respectively. On the long term, characterized by a relative increase in average annual water availability combined with large streamflow reductions in the dry period (see table 2), the history-based operating policy amplifies climate change impacts and produces definitely larger flood damages and larger water supply deficit (+71% and +153% under CPQ10L with respect to CPh), along with a 7% reduction in hydropower production. The adaptation of the operating policies to the changed climate can contribute in reducing these negative impacts. Results in figure 6(a) show that the performance potentially achievable over the period 2078–2098 under full adaptation (red circles) allows bouncing back to adequate levels of performance in all the three objectives. The degradation of performance adopting the compromise policy ACPQ10 with respect to the historical performance of CPh is indeed reduced to -5% in terms of hydropower production, +17% in flood damages, and +9% in water supply deficit, corresponding to a difference in the same objectives relative to policy CPQ10L equal to +2%, -31%, and -57%.
Similar results are obtained on the Q11 scenario (figure 6b), with the non-stationary and non-monotonic climate trend associated to decreasing hydropower production and increasing water supply deficit on the medium term, followed by an average long term increase of 20% in the annual streamflow, combined with a +34.9% in the peaks, which is projected to produce huge flood damages if no adaptation options are implemented. Under this wet scenario, the projected impacts on the performance of CPQ11M and CPQ11L with respect to CPh are equal to −7%, −12%, +112% in the medium term and +2%, +508%, +25% in the long term. However, results show that the performance of the Pareto optimal policies assuming full adaptation successfully exploit this additional water availability to attain better performance in hydropower (i.e., the maximum production increases from 60.62 GWh day-1 in the historical set to 62.73 GWh day-1 in the fully adapted set) and water supply deficit (i.e., the minimum deficit decreases from 18.55 (m3 s-1)2 to 17.64 (m3 s-1)2). Relatively to CPQ11L, the fully adapted ACPQ11 attains +3% in hydropower production and -60% in flood damages, with a small increase in the water supply deficit (+4%). Overall, these results demonstrate that the modification of the reservoirs operations represents an effective adaptation measure for reducing the adverse climate change impacts.
3.4. Analysis of the operating policies
Figure 7 illustrates how the benefits discussed in the previous section can be obtained by relatively simple adaptation of the baseline reservoirs operations to the changed climate conditions. The adaptation to Q10 consists in larger drawdown of Son La and Hoa Binh during the winter period, followed by the possibility of maintaining a higher average storage during the monsoon season, which is predicted to be drier than historically, thus allowing higher hydropower production. The adaptation on Tuyen Quang is more evident and suggests maintaining a higher storage during the first months of the year to better ensure water supply to the Red River delta, while keeping a larger flood pool from August to November to buffer the longer monsoon season, which is particularly evident in the projected streamflow of the Gam River (figure 3).

Figure 7. Comparison of the average storage trajectories of Son La, Hoa Binh, and Tuyen Quang reservoirs obtained with the history-based compromise policy (CPh, black line) and the fully adapted compromise policy (ACP, red line) over the period 2078–2098 under Q10 (panel (a)) and Q11 (panel (b)) scenarios.
Download figure:
Standard image High-resolution image
In the case of Q11, effective adaptation is obtained by balancing the storages in Son La and Hoa Binh in order to improve the hydropower production by increasing the hydraulic head at the Son La power plant without degrading flood control. This strategy is acceptable in terms of flood control because, despite Q11 is the wettest scenario, the projected streamflows in the Da River consists in a longer monsoon season with a reduced peak. The fall peaks predicted both in the Lo and the Gam rivers suggest, instead, to reduce the storage in the Tuyen Quang reservoir to increase the flood protection with respect to the historical operations.
4. Conclusions
Large storage operations are expected to play a key role for increasing water, energy, and food security under changing climate and society. To explore the impacts of climate change on water reservoirs operations as well as their potential in terms of adaptive capacity, in this letter we focus on the Red River system as a representative study site, where the rapid economic and demographic development of the region is already challenging the existing storages' capability of supporting the multiple and competing multi-sector services involved.
Our analysis of the Pareto optimal operating policies under historical hydroclimatic conditions provides a rich context for supporting the identification of candidate compromise solutions, which better address the tradeoffs across the three primary conflicting sectors in the system. The re-evaluation of these solutions under a perturbed physics ensemble of climate change scenarios contributes to the identification of the main system's vulnerabilities. Depending on the climate scenario and the time horizon considered, the history-based solutions are predicted to change on average from −7 to +5% in hydropower production, +35 to +520% in flood damages, and +15 to +160% in water supply deficit. The worst case degradation is up to −16% in terms of hydropower production, 1138% in terms of flood control, and 4100% in terms of water supply deficit. The variability associated to the considered future, non-stationary, uncertain scenarios is therefore amplified by the reservoirs' operations, as the impacts on the statistics describing the projected streamflows' pattern are lower than 30%. We also expect larger impacts on the system performance if more scenarios, produced with different climate models, were considered. In addition, our results show that the uncertainty associated to the climate scenarios produces an evolution in the system's tradeoffs, with the same solutions performing differently depending on the scenario that will realize. Finally, the adaptive capacity offered by changing the operations of the three reservoirs is demonstrated to be effective in reducing the negative impacts of climate change. Under the assumption of full adaptation, the system performance is significantly improved with respect to the non-adaptation alternative both under dry conditions (Q10), with the fully adapted policy recovering the expected negative impacts on hydropower production and water supply deficit, as well as under wet conditions (Q11), with the adaptation of the reservoirs operations saving 60% of the flood damages.
The conclusion from this work is that large storage operations can potentially amplify the impacts of climate change on water, energy, and food security, also expanding the uncertainty associated to the future climate scenarios, and modifying the systems tradeoffs. These negative impacts can be partially mitigated without any financial cost or risk by capitalizing on the flexibility offered by the adaptation of the reservoirs operations to the future hydroclimatic conditions. In the Red River study site, climate change is expected to impact more on flood control and water supply than hydropower production. Still, the predicted 7% reduction of hydropower production by the end of the century under Q10 raises significant concerns about securing energy to support the rapid development of the country, where hydropower currently accounts for 28,542 GWh year−1, corresponding to around 29.3% of the national energy production (Vietnam Electricity(EVN) 2012). With no adaptation of the storage operations, the risk of loosing 1,998 GWh year−1 would imply spending around 120 million US$ year−1 for buying the same amount of energy on the south east energy market, assuming the current price of 0.06 US$/kWh. The adaptation of the storage operations partially mitigates this effect by reducing the loss of hydropower to 5%, thus potentially saving around 34.4 million US$ year−1 .
Future research directions include the exploration of the entire envelope of climate change uncertainties (Wilby and Dessai 2010) by considering other climate scenarios and models. In addition, the analysis of the system response to extreme hydroclimatic forcing, independently from projected climate change scenarios, can be an alternative approach for exploring the vulnerability of the current reservoirs' operations and inform adaptation design. Although this topic has been already discussed for planning new infrastructures (Ghile et al 2014), it has never been developed for complex management problems. Finally, quantifying the impacts of co-varying climate and socio-economic drivers (e.g., water demand, introduction of energy market) can be extremely valuable in fast-developing countries like Vietnam.
Acknowledgments
This work was partially supported by the IMRR—Integrated and sustainable water Management of the Red-Thai Binh Rivers System in changing climate research project funded by the Italian Ministry of Foreign Affair as part of its development cooperation program. The authors would like to thank the Vietnam Institute of Meteorology, Hydrology and Environment (IMHEN), which provided the climate scenarios.