

Abstract
Existing carbon offset protocols for improved cookstoves do not require emissions testing. They are based only on estimated reductions in the use of non-renewable biomass generated by a given stove, and use simplistic calculations to convert those fuel savings to imputed emissions of carbon dioxide (CO2). Yet recent research has shown that different cookstoves vary tremendously in their combustion quality, and thus in their emissions profiles of both CO2 and other products of incomplete combustion. Given the high global warming potential of some of these non-CO2 emissions, offset protocols that do not account for combustion quality may thus not be assigning either appropriate absolute or relative climate values to different technologies. We use statistical resampling of recent emissions studies to estimate the actual radiative forcing impacts of traditional and improved cookstoves. We compare the carbon offsets generated by protocols in the four carbon markets that currently accept cookstove offsets (Clean Development Mechanism, American Carbon Registry, Verified Carbon Standard, and Gold Standard) to a theoretical protocol that also accounts for emissions of carbonaceous aerosols and carbon monoxide, using appropriate statistical techniques to estimate emissions factor distributions from the literature. We show that current protocols underestimate the climate value of many improved cookstoves and fail to distinguish between (i.e., assign equal offset values to) technologies with very different climate impacts. We find that a comprehensive carbon accounting standard would generate significantly higher offsets for some improved cookstove classes than those generated by current protocols, and would create much larger separation between different cookstove classes. Finally, we provide compelling evidence for the inclusion of renewable biomass into current protocols, and propose guidelines for the statistics needed in future emissions tests in order to accurately estimate the climate impact (and thus offsets generated by) cookstoves and other household energy technologies.
Export citation and abstract BibTeX RIS

Content from this work may be used under the terms of the Creative Commons Attribution 3.0 licence. Any further distribution of this work must maintain attribution to the author(s) and the title of the work, journal citation and DOI.
1. Introduction
Roughly one third of the world's population relies on solid, unprocessed biomass fuels burned in traditional stoves to meet daily cooking needs [1]. These fuel and stove combinations typically result in poor combustion and significant emission of products of incomplete combustion (PICs), including aerosol particulate matter (PM) like black carbon (BC) and organic carbon (OC), and ozone precursors such as carbon monoxide (CO). These substances contribute directly to increased morbidity and mortality both for those nearby and for others exposed when indoor air pollution is transported outdoors. Notably, air pollution, a significant faction of which comes from domestic biomass burning, is now estimated to be the single largest environmental risk to humanity [2].
This problem is not new; the literature is replete with studies across disciplines on the impacts of cookstove pollution and attempts to solve the problem with new technologies (e.g., [3–13]). Yet even with decades of experience measuring impacts and piloting interventions, widespread adoption of improved cookstoves has not occurred [14–16]. Studies have shown that socio-cultural and technical issues contribute to this low change-over rate, but economics remains the main driver [15–18]. The world's biomass-dependent populations are poor, and the cost-benefit analysis of the existing suite of technologies does not work in their favor. On the benefits side, the health effects of cleaner cooking technologies may be attenuated if, for example, everyone else in the neighborhood is still using highly polluting stoves [19]. That is, community-based uptake may be necessary for individual households to reap the maximum health gains. In addition, if households have no money to spend on health care to begin with, or if they perceive no opportunity cost to gathering free fuels, the benefits of switching technologies may not be monetized. On the cost side, more affordable options may not be improved enough to incentivize behavior change [13, 14, 20]. Finally, absent financing, the cleanest technologies remain out of reach for the families that could most benefit from them [10, 16, 18, 21, 22].
Carbon markets have received increasing attention in recent years as a potential solution to the cookstove financing problem, and some of the most important carbon markets in the world now include protocols for improved cookstoves [23]. In theory, offset revenue could make these improved technologies more affordable for those who need them most and thus improve health (and other) outcomes for millions of poor families around the world. At present, offset calculations are based on the reduction in CO2 emissions from burning non-renewable biomass in an improved stove versus a traditional, or unimproved, stove. While these protocols are a step in the right direction, they miss a key part of every cookstove's impact: they ignore the fact that biomass cookstoves emit PICs—most importantly, carbonaceous aerosols and carbon monoxide—as well as carbon dioxide. These PICs have important climate and health impacts. BC is the second-or third- most important climate forcing agent after carbon dioxide, and PM as a whole from indoor cooking smoke causes millions of premature deaths each year [2, 24, 25]. Carbon monoxide is a main precursor to tropospheric ozone, a potent warmer and a compound detrimental to both human health and plants [25].
By ignoring PICs and assigning offset values based on an overly simplified representation of combustion, current protocols thus do not likely assign accurate climate values to different types of cookstoves, either in absolute or relative terms. At the extreme, it is possible that CO2-only protocols could mistakenly assign offset values to cookstoves that are in fact worse for climate, depending on the abundance and optical properties of their PIC emissions. The future climate and human health consequences of CO2-only protocols could thus be substantial if markets mistakenly incentivize uptake of technologies that in fact emit more PICs.
Here we explore the hypotheses above within the policy space of existing protocols. We begin with an overview of existing protocols. We then examine how existing carbon markets would value and rank different classes of cookstoves under the current CO2-based formulae. We compare results for these offsets calculated (a) using the protocols' own prescribed emissions factors, and (b) emissions factors derived from a meta-analysis of the existing cookstove testing literature. Finally, we contrast these carbon values and rankings with a new holistic protocol that does account for CO2, CO, and BC and OC emissions. Different outcomes under the two different sets of rules would motivate a more comprehensive carbon accounting in cookstove (and other) offset protocols to properly align market forces with climate goals and overall human wellbeing.
2. Carbon accounting standards
A growing number of carbon accounting standards ('carbon markets') exist around the world for the purpose of certifying carbon-reducing programs. These markets develop protocols to certify projects that demonstrably decrease carbon emissions, and then sell those reductions as credits ('offsets') to polluters who are either seeking to comply with regulations or who are voluntarily participating in a carbon market. In practice, an offset is generated by a technology or other intervention that creates a measurable reduction in emissions compared to status quo, or an appropriate baseline counterfactual; the amount of the reduction (in units of mass of CO2) is then converted to a monetary value within the individual market.
Currently four carbon markets include protocols for improved cookstove projects: the Clean Development Mechanism (CDM) [26], the Verified Carbon Standard (VCS) [27], the American Carbon Registry (ACR) [28] and the Gold Standard (GS) [29]. As of the end of 2013, all but one of the current cookstove offset projects were registered under either the CDM or GS methodologies (the lone exception is registered under ACR) [23]. Over the next 10 years (the accounting period for these protocols), these offset projects are projected to generate around 10 million tons of CO2 reductions [23], equivalent to about 1% of voluntary carbon market trading per year [30]. (See the SI for a more in-depth discussion of existing markets and specific protocol formulae, available at stacks.iop.org/erl/10/084026/mmedia).
Three types of tests are generally used to estimate the climate performance of improved cookstoves. These range in complexity from the relatively simple water boiling test (WBT) [31] to the more complex controlled cooking test (CCT) [32] and kitchen performance test (KPT) [33]. The GS accepts only the KPT for emissions estimates; the other three protocols accept any of the above tests. (See SI for additional information about the specifics of each test.) Importantly, for the purposes of the offset calculation, no actual emissions measurements are required; the only test requirement is a measure of the fuel used by a certain stove versus a traditional stove to complete the test.
At present, the offset protocols use emissions factors drawn from Intergovernmental Panel on Climate Change (IPCC) reports to convert fuel savings to emissions reductions. Two glaring problems exist with this approach: first, emissions factors derived from the literature values appear to differ significantly from the IPCC values. Second, and related, no cookstove methodology currently accounts for statistical uncertainty in measurements. Johnson (2010) showed that under current methodologies, for many (even the majority) of projects there are no statistically significant differences between baseline and improved stoves in terms of emissions factors [34] and this is one of the compelling problems addressed here. In addition Wang et al (2014) address a key data limitation in that most emissions testing papers conduct far too few tests to accurately derive emissions factors (and concomitant uncertainties) [35]. These papers point to a key gap in existing data—the need for statistically-sound emissions factor derivations—and a direction for future research; we discuss our approach to this data gap for the purposes of this analysis in detail below.
3. Methods
3.1. Emissions factor derivations
The protocols used by the CDM, ACR, and VCS are based only on the net weight of non-renewable biomass saved by a given cookstove relative to a baseline technology—typically a three-stone stove, open fire, or the prevailing local version of an unimproved mud hearth. These methodologies include no treatment of uncertainty: the average fuel reduction compared to baseline is simply multiplied by the fraction of fuel that is non-renewable, the market-proscribed emissions factor to convert fuel mass to CO2 mass, and a factor to convert the per-task offset to a per-year or per-stove-lifetime offset value. (See the SI for protocol formulae.)
These protocols assume perfect combustion, or that all carbon in the biomass will be converted to CO2. The GS protocol acknowledges non-CO2 emissions by including a fixed emission factor to account for CH4 and N2O emissions from biomass; none of the protocols include PICs such as BC, OC, or CO. However, because different stoves have different combustion efficiencies, they emit more or less of the total carbon mass as CO2, with the rest being emitted as PICs [36]. Many studies have pointed out the fact that BC and other PICs form the largest contributions of biomass burning to warming (e.g., [37]), but this knowledge has not been incorporated into protocols.
To understand the role of uncertainty and the contributions of non-greenhouse gas emissions to true climate impacts of different cookstove technologies, we conducted a meta-analysis of cookstove emissions studies and derived emissions factor distributions (means, medians, standard errors) for CO2, CO, OC, and BC. We derived emissions factors for each major cookstove class represented in the literature—traditional or three-stone stoves, natural draft or rocket stoves, forced draft stoves, gasifier, and charcoal stoves. Natural draft, or rocket stoves, are typically cylindrical shaped stoves that feature passive structural modifications intended to enhance airflow to the combustion chamber (and thus combustion efficiency); forced draft stoves feature an external fan that actively drives air into the combustion chamber. Gasifier stoves use two-stage combustion in which biomass is first burned in the primary combustion chamber (typically in oxygen poor conditions); the CO produced in the primary combustion cycle is then oxidized to CO2 in a secondary combustion cycle. Finally, charcoal stoves, as their name suggests, use charcoal as their primary fuel and are often promoted in peri-urban areas where households cannot easily access biomass like wood or crop residues.
While this aggregation blurs distinctions between individual stove models within a class, it does capture much of the technology differentiation in the improved cookstove landscape and helps provide generalized insight into the offset protocols. Moreover, very few studies have sufficient statistical power for appropriate analysis at the individual stove level. Mathematically speaking, a sample size (N) of six is the minimum to know with 95% confidence that the population median value lies between the sample minimum and sample maximum. More generally,  is considered a small sample. Unfortunately most studies use only 3–4 tests per stove, and individual stoves, testing conditions or even the test conducted are not standardized across studies [35]. The aggregation by stove class therefore provides added statistical power by pooling like technologies across studies. Emission factor averages and standard errors for each stove class were weighted by number of tests conducted in each study. We similarly derived fuel use efficiency distributions from the same studies for each stove class to convert emissions and offsets to a per-task basis.
Our meta-analysis to derive fuel use and emissions factor distributions was complicated by several realities. First, the state of cookstove measurements has evolved rapidly over time, and formalization of different testing methods has happened fairly recently. Hence, existing studies include a broad range of lab vs. field tests, conducted with various fuels, etc. Second, studies report results in very different ways—including, but not limited to, emissions per test, emissions per unit of energy output, emissions per kg of biomass, and molar ratios of carbon. We calculated conversions to standardize all emissions factors to units of g per kg of biomass fuel. Third, very few studies measure the emissions of BC (also called elemental carbon or EC) and OC rather than concentrations of total suspended particulates (TSP), PM10, or  . Measurements of the optical properties of the emitted PM are critical because BC is a potent warmer, but OC is (more weakly) cooling. The relative abundances of the two types of carbonaceous aerosols is thus a critical factor in the net climate impact of a given cookstove's emissions. The studies that do provide data on the optical properties of stove particulate emissions also use different methods and report different metrics: some report the total EC:OC ratio from filter-based measurements, while others measure the single-scattering albedo (SSA), a measure of the fraction of extinction due to scattering (versus absorbing) aerosols.
The initial scope of our project included every study that measured cookstove emissions. Many of these studies included fuel sources other than wood. Because the only data on BC and OC emissions comes from wood and charcoal burning stoves, we only consider emissions from wood and charcoal burning stoves (excluding fuels such as dung, crop residue, and others). Not nearly as many studies measure BC and OC emissions as those that measure CO2 or CO emissions, so our BC and OC estimates stem from a smaller number of tests than estimates for other PICs. The full list of included sources can be found in table 1. Data and methods for harmonizing data across studies can be found in SI; the final derived emissions factor distributions for CO2, BC, OC, and CO are shown in table 2.
Table 1. Previous studies and measurement parameters used to conduct meta-analysis of emissions by cookstove type. With the exceptions of Roden (2006) [17] Johnson (2007) [53] and Preble (2014) [42] every study conducts three tests per stove. We aggregate data from all stoves of the same class: traditional, or unimproved (T), charcoal (C), natural draft (ND), forced draft (FD), and gasifier. Measured species vary by study: TSP = total suspended particles, CO = carbon monoxide, CO2 = carbon dioxide, BC = black carbon, OC = organic carbon. Details of each study and procedures to harmonize data can be found in the SI.
| Paper | Stove types | Tests per stove class | Species measured |
|---|---|---|---|
| Joshi (1989) [3] | T, ND | 3 | TSP, CO |
| Ballard-Treemer (1996) [4] | T, ND | 6,17 | TSP, CO |
| Smith (2000) [36] | T, ND, C | 9, 18, 6 | TSP, CO, CO2 |
| Venkataraman (2001) [52] | T, ND | 4, 12 | PM10, CO |
| Roden (2006) [17] | T | 13 | PM10, CO, BC, OC |
| Johnson (2008) [53] | T, ND | 13, 17 | CO, CO2, BC |
| MacCarty (2008) [54] | T, ND, FD, G, C | 3 each | PM10, CO, BC, OC |
| Jetter (2009) [7] | T, ND, FD | 3, 6, 3 | PM10, PM2.5, CO |
| MacCarty (2010) [55] | T, ND, FD, G, C | 3, 66, 15, 9, 12 | PM10, CO |
| Jetter (2012) [56] | T, ND, FD, G, C | 6, 18, 3, 3, 21 | PM2.5, CO, CO2 |
| Preble (2014) [42] | T, ND | 21, 20 | PM2.5, CO, CO2, BC, OC |
Table 2. Literature-derived mean emissions factors (g kg−1 fuel) and normalized fuel use (kg fuel / task, relative to traditional stove) shown, with standard deviations shown in parentheses.
| Traditional | Charcoal | Gasifier | Natural draft | Forced draft | |
|---|---|---|---|---|---|
| Emissions factor | (T) | (C) | (G) | (ND) | (FD) |
| CO2 | 1570 (83.7) | 2710 (216) | 1940 (186) | 1582 (115) | 1901 (72.2) |
| CO | 57.4 (24.8) | 192 (41.0) | 29.4 (11.3) | 40.0 (6.65) | 9.81 (4.25) |
| BC | 1.28 (0.59) | 0.28 (0.12) | 0.28 (0.10) | 1.26 (0.52) | 0.060 (0.044) |
| OC | 2.97 (1.63) | 1.54 (0.93) | 0.82 (0.29) | 1.47 (0.11) | 0.14 (0.10) |
| Fuel use | 1(0) | 0.65 (0.10) | 0.67 (0.20) | 0.61 (0.13) | 0.52 (0.12) |
3.2. Resampling calculations
We created a database of 1000 simulated tests for each cookstove class using random draws from the derived emissions factor and fuel use distributions (table 2); this resampling method addresses uncertainty related to within-class stove differences and non-standardized testing conditions. These 'observations' for each cookstove class were then used to conduct three analyses. First, we calculated the emissions (in mass of CO2) for each class using the formulae from existing protocols (CDM, ACR, and GS; see the SI for formulae and details). We calculated stove-class emissions using (a) the CO2 emissions factor prescribed by the given protocol, and (b) our resampled values from the literature. We generated an emissions distribution for each stove type under each protocol, at 10% intervals of fraction of non-renewable biomass (fNRB) (from 0% to 100%). We then subtracted the distribution of total emissions for the traditional (baseline) stove from each of the improved stove types to get a distribution of total offset in terms of grams of CO2 per cooking task.
Second, we calculated offsets by stove class for a new, modified offset protocol that included BC, OC, and CO emissions resampled from the literature-derived emissions factor distributions, in addition to CO2. Again, we generated an emissions distribution for each stove type under each protocol, at 10% intervals of fNRB (from 0% to 100%), and subtracted the emissions distribution of the traditional stove to get the net offset. For the modified protocol, however, the fNRB was only applied to CO2 emissions (as CO2 is the species ostensibly sequestered annually with renewable biomass fuels). To convert the different emissions species to CO2 equivalents, we use 100-year global warming potentials (GWPs) from the fifth assessment report (AR5) of the IPCC [24].
3.3. Treatment of uncertainty
Four uncertainty sources are likely in the estimation of carbon offsets from a cookstove project. The first is due to estimation of the amount of renewable biomass versus non-renewable biomass harvested in the project area. Because this uncertainty is location-based and expected to be independent of stove type, we do not include it in our estimations. We run our offset calculations for range of different values as a fNRB to provide bounds on this dimension.
The second source of uncertainty comes from fuel use measures. Current protocols are are based on fuel use reductions (the mass of non-renewable fuel used relative to baseline over the reporting period), but the quantities of fuel used necessarily vary depending on location, the type of cooking task, the volume of food or water to be heated, etc. (In all cases, fuel weights refer to fuel dried to within test-specific moisture standards, though both standards and moisture content differ between studies.) To harmonize across tests and studies, we calculate per-task fuel savings compared to traditional stoves by normalizing fuel use distributions of improved stoves to the distributions for a traditional stove within the same study. The per-task metric is more intuitive for comparing stove models or classes (versus, for example, to a strict per kg fuel comparison), an is easily scaleable over the reporting period. We account for fuel use efficiency in all calculations and note that this means that some stoves that produce higher quantities of pollutants on a per-kg of fuel basis have a lower emissions footprint on a per-task basis. (It is also worth noting that most existing fuel use data come from studies employing the WBT, which does not account for many of the complexities of using a stove in the field, including fuel characteristics, thermal power of the stove, accessories including the pot and (whether or not there is a) hood, how the stove is lit, and what is being cooked, to name a few.)
The third source of uncertainty comes from the measurements of different emissions components. Emissions measurements have evolved rapidly with advances in the understanding of aerosol PM and its impacts on health and climate. On the health side, the discovery that smaller particles pose greater threats to human health has led to a change in measurement strategy for air pollution monitoring; on the climate side, information about the chemical composition and optical properties of PM is necessary to understand its climate impacts. Consequently, the majority of the literature about emissions from cookstoves falls under two categories: one is the literature about health impacts of cooking indoors and the other is about climate impacts of burning biofuels. The health literature was the first to examine emissions other than CO2, but it tends to disaggregate particulates by size (PM2.5 and PM10) rather than by climate forcing potential (e.g., absorbing versus scattering). Only more recently have climate-conscious studies focused on speciated measurements of particulates; that is, quantifying how much of emitted PM is BC (absorbing) versus neutral or scattering OC [38–41].
The studies included in our analysis (table 1) are described in greater detail in the supporting information. Currently, the only study that measures the optical properties of particulate emissions with enough tests to generate statistical confidence only examined one stove; several multi-stove studies include BC and OC measurements, but lack sufficient statistics and do not report uncertainties. In order to bound the variance on BC and OC emissions by stove class, we therefore used the coefficient of variance (COV) of overall particulate emissions data to estimate the BC and OC fractions of PM for different stoves. This process is described in more detail in the SI.
Because we group many stove models into overarching stove classes, both efficiency and emissions uncertainties are higher than they would be for a study that used a large number of tests on a single stove model. We use the results of one recent study [42] to demonstrate that this is especially the case with natural draft stoves—by far the largest class in terms of number of different models. This case study on the Berkeley–Darfur stove is the only existing study featuring both a large number of tests and measurements of BC, OC, and CO.
The fourth source of uncertainty comes from the radiative forcing effects of BC and OC. GWP estimates for these particulates vary widely, due to their short atmospheric lifetimes, their complex effects on weather patterns and snowpack, and regional climatic and source differences [24, 25, 43–45]. The IPCC AR5 gives a broad range of possible values for the global GWP of BC and OC: 900 (range of 100–1700) for BC and −46 (range: −18 to −92) for OC (we use the 100-year time horizon because this is the standard for measuring GWPs across offset protocols) [24, 46]. We use the central values for BC and OC for the main portion of our analysis, and a GWP of 2.2 for CO [24]. We discuss the implications of GWP uncertainties below and in the SI (figure S4).
4. Results
4.1. Fuel savings
The cookstove classes considered here are all considered improved because they use less fuel than traditional cookstoves. These average fuel savings across stoves classes are shown in table 2. For each study (table 1) we normalized the fuel savings of the different improved stoves to 1 kg of fuel in a traditional stove to account for different tests used across studies (with uncertainties calculated appropriately). The fuel use numbers in table 2 thus represent the fuel-use-per-task value that would be scaled (i.e., task value * tasks per day * days) to calculate the total offset credit for a project. Figure 1 shows two sets of boxes for each type of stove; the left-hand set ('P') corresponds to the emissions values (in g CO2 per task) for each stove when literature-derived fuel use values are used to calculate the offset for each protocol (using default protocol CO2 emissions factors). This inclusion of variance in fuel savings illustrates the importance of proper treatment of uncertainty in emissions protocols. The assigned emissions values for each stove type, based on fuel use changes relative to 1 kg of biomass burned in a traditional stove, vary by a factor of 2 or more for each improved stove type and protocol.

Figure 1. Emissions values assigned to different classes of cookstoves by the Clean Development Mechanism (CDM), the American Carbon Registry (ACR), and Gold Standard (GS). The protocol for the Verified Carbon Standard (VCS) is almost identical to the ACR protocol and omitted in figures for clarity; see the SI for details. The left three bars for each stove class show the emissions value when the internal protocol emissions factors are used ('P'); the right three bars show the calculated emissions value when literature-derived values for emissions factors are used, with resampling as described in the methods section ('L'). Distributions in the default protocol ('P') values arise from resampling of fuel use data, used to convert emissions to a per-task basis. Fuel use efficiency is included by normalizing fuel use by improved stoves to that of the traditional stove in the same study, including uncertainty where such data exist. Horizontal lines within the boxes show the median offset value, the boxes give the interquartile range of sample means (25th–75th percentile) and whiskers give the 95% confidence interval, defined by the mean value +/−1.96 times the standard error of each sample mean.
Download figure:
Standard image High-resolution image4.2. Protocol v. literature-derived emissions factors
We then compare the value of CO2 emissions using the values proscribed by each protocol and the CO2 emissions factors derived from the literature, assuming a renewable fraction (fNRB) of 50%. The CDM proscribes a value of 1244 g CO2 kg−1 fuel. The GS uses a value of 1747 g kg−1 of fuel, and an additional value of 455 g kg−1 fuel meant to account for other long-lived greenhouse gas emissions (methane, CH4, and nitrous oxide, or N2O). The ACR and VCS protocols fix the value at 1792.5 g kg−1 for wood and the ACR sets a separate value of 1747.5 g kg−1 for charcoal. These CO2 emissions estimates for different stove types on a per-task basis are illustrated in the right-hand ('L') set of boxes in figure 1.
Comparing the protocol and literature-derived emissions factors in figure 1 shows that the median values proscribed by the protocols are often significantly different from the values measured in actual tests. The CDM underestimates the CO2 emissions for every stove type except the gasifier stove at 95% confidence (the distributions do not overlap). The ACR and GS provide good estimates of the amount of CO2 emitted by gasifier, natural draft, and forced draft stoves, but underestimate CO2 emissions from charcoal stoves and underestimate the emissions from traditional stoves. GS values are higher than the other protocol values, across stove types, due to the inclusion of non-CO2 greenhouse gas emissions in the GS protocol. The error bars for the traditional stoves are smaller than for other stove classes because there is no fuel use uncertainty for the traditional stoves (they are all assigned the value of 1 kg biomass). This suggests that even when comparing CO2 emissions the current protocols are often different from literature values, vary substantially from one another, and are likely substantially wrong for Traditional and charcoal stoves.
The 95% confidence intervals (CIs) in figure 1 represents the distribution of means of different samples. Conceptually, these intervals are for the 'average stove' within a class—something that does not exist in practice, but is useful concept for writing an emissions offset protocol, or differentiating between stove classes. In practice, testing protocols with a large N and procedures that mimic conditions in the field would remove the need for stove class groupings or finding the emissions profile of an 'average' stove of any class. [35] At present, however, the lack of individual stove model studies with sufficient statistics necessitates the class grouping. The distributions indicate that there are stoves in the natural draft, gasifier, and particularly the charcoal class that may perform worse than traditional stoves under some conditions. See the SI figures S5 and S6 for more details.
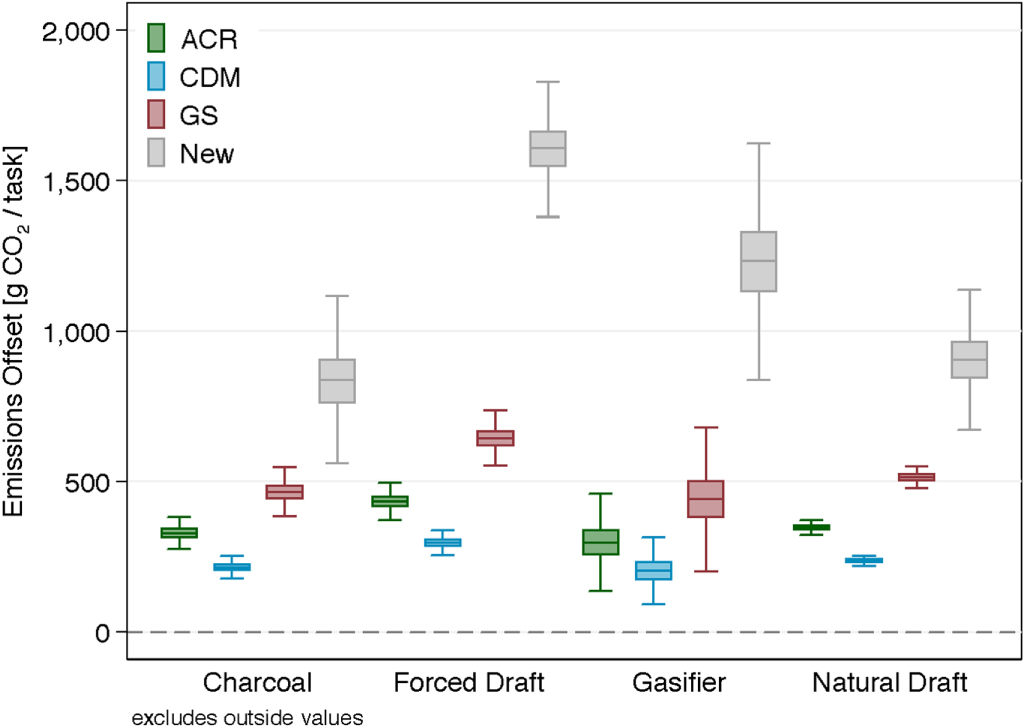
4.3. Emissions offsets by stove class
By subtracting the traditional stove emissions distribution for each protocol from each stove class emissions distribution under the same protocol, we are able to derive the emissions offset that would be assigned to each stove class, on a per-task basis. (This amount would scale by the number of cooking tasks over the project time period or cookstove lifetime.) In addition to calculating the offset for the existing protocols, we also calculate the offset for our proposed ('new' or 'modified') protocol that takes into account literature-derived emissions factors for BC, OC, and CO and their GWPs (see the SI for formulae). These results, by stove class, are shown in figure 2, for fNRB = 50%. Most clearly, a protocol that includes emissions of PICs produces a higher median offset value for each class of stove. This is particularly notable for the forced draft and gasifier stoves where including PICs more than doubles the median offset, and is statistically different (at 95% from all existing protocols). Charcoal and natural draft stoves also see increased offset sizes, with the new lower bound of the 95% CI located near the current GS offset estimate. For charcoal stoves, the increased efficiency and decreased BC emissions are partially offset by increased CO and CO2 emissions. For natural draft stoves increased efficiency is responsible for the majority of the offset. Most notable here is that existing protocols fail to differentiate between cookstove classes (e.g., the CIs overlap for all classes within each protocol); the comprehensive carbon accounting protocol creates significant separation in carbon values between stove classes.
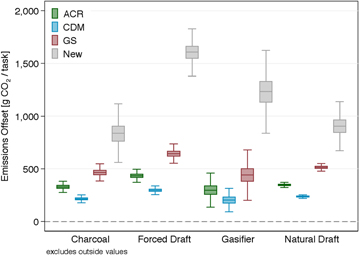
Figure 2. Offset values relative to traditional stoves assigned to each cookstove class by the the American Carbon Registry (ACR), Clean Development Mechanism (CDM), Gold Standard (GS), and the protocol proposed in this study (New). Values are shown for 50% non-renewable biomass. Error bars show 95% confidence interval, defined by the mean value +/− 1.96 times the standard error of each sample mean, derived from resampling literature-derived distributions of emissions factors and fuel use for each stove class.
Download figure:
Standard image High-resolution image4.4. Renewable v. non-renewable biomass
Existing offset protocols (aside from the GS) only assign offsets based on reductions in non-renewable biomass. The assumption here is that emissions from renewably-harvested biomass, like dung, crop residues, or sustainably-harvested wood, are sequestered each year in biomass growth. For example, the growth of corn stalks sequesters CO2 from the atmosphere; combustion of those corn stalks in cookstoves releases CO2 back into the atmosphere, but there is no net emission or sequestration on an annual basis. Calculated emissions offsets for each protocol and stove class, across fNRB are shown in figure 3. The ACR and CDM protocols give no offset credits when 100% renewable biomass is used (panel (c)). The GS protocol assigns still credits the non-CO2 greenhouse gas emissions from renewable biomass (CH4 and N2O), because those compounds—although presented in CO2-equivalent terms in the final calculation—cannot actually be sequestered by biomass growth.

Figure 3. Offset values (versus traditional stove) assigned to each improved cookstove class by the the American Carbon Registry (ACR), Clean Development Mechanism (CDM), and Gold Standard (GS), for existing protocols using literature-derived values (blue bars) and our modified protocol taking into account emissions of black carbon and carbon monoxide with literature-derived emissions factors (green bars). Values shown for (a) 100% non-renewable biomass (in which all true CO2 emissions reductions are credited); (b) 50% non-renewable biomass (in which half of all true CO2 emissions reductions are credited; the other half are assumed to be sequestered by the renewable fuel source); and (c) 0% non-renewable biomass (all CO2 emitted in combustion is assumed to be sequestered again by the renewable fuel source; offset credit is only given for non-CO2 emissions). In this figure the error bars show the 95% confidence interval, defined by the mean value +/− 1.96 times the standard error of each sample mean, derived from resampling literature-derived distributions of emissions factors and fuel use for each stove class: C = charcoal, FD = forced draft, G = gasifier, ND = natural draft.
Download figure:
Standard image High-resolution imageWe compare these values across fNRB to our new (modified) protocol that accounts for the emission of BC, OC and CO. As in the GS protocol, the new protocol only takes fNRB into account for emissions of CO2, as CO, OC and BC cannot be sequestered by plants. Across stove type, these results show similar patterns to figure 2. (The results from figure 2 are shown in the middle panel (b) of figure 3.) Again, forced draft stoves stand out as the stove class generating the largest offsets with statistical certainty; in addition, the modified protocol suggests significantly higher climate offset values for forced draft and gasifier stoves when PICs are included. These results also suggest that there is significant positive climate impact to be had through improved combustion of renewable biomass across all stoves. Also of note is that while, as a class, natural draft stoves outperform charcoal stoves at 100% non-renewable biomass, charcoal stoves generate larger offsets at 0% non-renewable biomass.
4.5. Analysis of uncertainty
A key result of the above analysis is that the inclusion of BC, OC, and CO emissions raises the calculated offset value across stove classes. That is, on average most improved stoves reduce emissions of PICs relative to traditional stoves, and that improved combustion, combined with fuel savings, results in an average climate benefit that is much larger than when only CO2 is considered. However, the literature-derived emissions factors for PICs have much larger uncertainties than the literature-derived emissions factors for CO2. The contributions of each pollutant to both the overall magnitude of the new (modified) offset proposed here, and the uncertainty in that offset, are shown in the top panel of figure 4. Our derived point estimates are in agreement with previous studies that have aggregated emissions data from previous studies, both in that their estimates fall inside of our 95% CI, and in that the result of aggregating data across studies is a wide CI [37, 47].
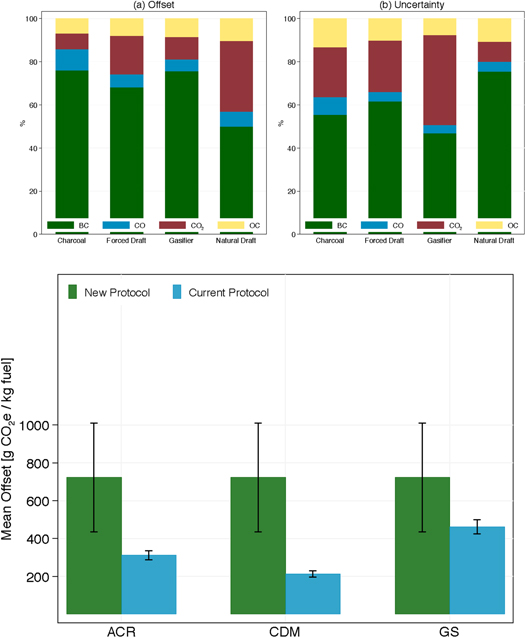
Figure 4. (Upper panel) (a) Percentage of the total emissions offset value (CO2e) in the revised protocol attributable to each carbon species. (b) Percentage of the total uncertainty in the emissions offset value attributable to uncertainty in emissions of each species. (Lower panel) Current (blue bars) and revised (green bars, as proposed in this study) offset protocol values for the natural draft (ND) stoves studied in Preble et al (2014) [42]. This study conducted far more tests on each stove than has been the practice (see table 1) and as a result the error bars from statistical resampling of the emissions factor distribution derived from the study result in statistically significant offsets for this natural draft stove, unlike across the other studies (e.g., figure 3). However, the improved protocol which takes into account PICs (green bars) still has very large uncertainty, indicating the need for higher numbers of repetitions in cookstove emissions tests, particularly if PICs are to be included, as this study argues they should.
Download figure:
Standard image High-resolution imageBC is the largest contributor to both offset magnitude and uncertainty, suggesting that from a carbon markets perspective, better measurements of BC emissions factors for all stove types (including traditional stoves) should be a priority for future research. (This is in agreement with previous research on the impact of residential combustion, e.g., [37].) However, because size of the uncertainty tends to match the size of the total offset (the coefficient of variance is similar for each pollutant, with a few exceptions) there are opportunities for large-n tests on specific stoves to reduce the errors and generate a larger offset with strong statistical certainty.
Our resampling procedures assume that each individual cookstove test is sampled from the same population, an assumption that is strained when grouping stoves by class. However, when we look at the standard deviation between the means of different tests, it tends to be fairly close to the standard deviation within tests. This suggests that much of the error can be attributed to differences in individual stove performance across tests, and not large differences across models within a stove class. As a case study, we show the estimated offsets across protocols (and our modified protocol) for one particular natural draft stove (the Berkeley–Darfur stove) in the bottom part of figure 4. For this estimate, we draw on the one study with  for an individual stove model and its traditional comparison stove [42]. The error bars are much lower for CO2-based emissions due to the higher number of tests. And while the error bars are still very wide when BC, OC and CO are included, the small reduction in standard error (due to higher N) results in a statistically significant offset for the stove at 95% confidence.
Finally, we conducted our analysis using the central global GWP values for BC and OC from the IPCC AR5 [24, 46]. However, uncertainty related to BC and OC GWP values could swamp the statistical uncertainty related to stove fuel use efficiency and emissions factors. To demonstrate the relative importance these different uncertainties, we simulated the total GWP for 1 kg of wood fuel combusted in different conditions, with results presented in figure 5. Total GWP is a function of combustion efficiency (the amount of carbon in the wood fuel that is fully combusted to CO2), the optical properties of the remaining carbon emissions (here conceptualized as the EC:OC ratio, though this could also be inferred from SSA measurements, as in [40, 48]), and GWP values for BC and OC. The red dots across the three panels—at representative values of combustion efficiency and EC:OC—illustrate that GWP uncertainty leads to estimates that vary by more than two orders of magnitude.

Figure 5. Simulation illustrating the total global warming potential (GWP) of 1 kg of wood fuel as a function of combustion efficiency (here represented as the fraction of carbon combusted to CO2) and the ratio of elemental carbon (EC or BC) to organic carbon (OC) of PM emissions. Simulation is shown for three different sets of GWP values for EC and OC: the low ( ), central (
 ), and high (
 ) values from the IPCC fifth assessment report [24, 46]. The simulation assumes that 50% of the mass of the wood fuel is carbon, and that any carbon not directly combusted to CO2 is emitted as either elemental or organic carbon PM (we ignore other pathways like CO for simplicity). The red dots indicate the range of calculated climate impacts across GWP values for a combustion efficiency of 0.95 (corresponding to the CO2 emissions factor used in the CDM protocol), and an EC:OC ratio of 0.33 (which lies in the range of many of the stove classes).
Download figure:
Standard image High-resolution image
5. Discussion
Encouraging widespread uptake of improved cooking technologies has been of sustained interest to the public health, REDD, climate, and development communities for several decades. And in the past few years, attention has coalesced on carbon markets as a means of financing these technologies, which often remain out-of-reach economically for the households that would most benefit from them. This concept, while theoretically win–win, remains flawed at present, with important consequences. Here, we apply appropriate statistical techniques to account for the uncertainty in fuel savings and emissions factors of different improved cookstoves. Then, by calculating the offsets that would be generated for different classes of stoves in existing protocols, using these literature-derived values for fuel use and emissions factors, we show that existing protocols underestimate the global warming potential of many types of improved cookstoves.
When we then incorporate PICs into a modified protocol to account for combustion efficiency; we find that that the simple biomass-to-CO2 calculation at the heart of current protocols further distorts the market. Existing protocols underestimate the climate impacts of the best technologies: accounting for PICs like BC, OC, and CO results in a sizable separation of average offsets across stove types, and the average climate benefit of improved cookstoves is higher than currently accounted for due to reductions in emissions of BC and CO relative to traditional stoves. In particular, forced draft stoves stand out as the best technology, generating more than double the climate benefits that they are currently assigned by any protocol when PIC emissions are included. We also find that inclusion of PICs implies a need to rethink the renewable v. nonrenewable biomass distinction in current protocols. That is, reduction in PIC emissions should be valued even when renewable biomass is used. Inclusion of PIC offset credits for renewable biomass use could expand the benefit of carbon financing to many more families currently relying on agricultural residues and dung (considered renewable) as their fuel sources.
We find that uncertainty in emissions factors of PICs means that certain stove classes have large uncertainties associated with their calculated offsets, and when stoves are considered individually they often generate offsets statistically indistinguishable from zero. This finding points to the need—acknowledged elsewhere in the theoretical literature, but not yet the norm in experimental literature—for more rigorous statistics in emissions testing. Ideally, 30–50 tests would be conducted on each stove model to sufficiently narrow the variance on emissions factors for estimation of offsets. Furthermore, testing needs to move away from simple laboratory tests and towards field testing that emulates the conditions in which a stove will actually be used. This includes using more realistic protocols like the KPT, testing at a range of thermal powers, using different fuels with varying moisture contents, and using different pots and accessories for different tasks. Only when this more rigorous testing is the norm will offset protocols accurately reflect climate benefits and incentivize the best technologies.
Finally, a comprehensive carbon market that accurately values the full radiative forcing impacts of technology changes (beyond just CO2) will also necessitate standardization of emissions testing protocols to include particulate and gas-phase measurements. Equally important, a comprehensive carbon market will require agreement on GWP values to be used for PICs. As mentioned above, the GWP ranges for carbonaceous aerosols are large, reflecting the rapidly evolving science of short-lived climate pollutant impacts.
Having accurate and more precise estimates of the true climate impacts of improved cookstove technologies is critical for making the carbon market work as intended; to accomplish these goals, inclusion of PICs in carbon accounting standards and a new paradigm for rigorous testing are needed. More broadly, the lack of uncertainty estimation and lack of fidelity to true GWP estimates for cookstove emissions may be damaging the ability of cookstove projects to generate offset-funded implementation. The collapse of CER prices in the CDM was a result of violation of the principle of additionality and an over-estimation of the offsets generated by projects [49–51]. As the number of non-credible carbon credits generated outpaced demand, prices collapsed to less than  per ton of CO2, where they are expected to stay through about 2020. Improving estimation methods by correctly estimating uncertainty should prevent a similar collapse in VER prices for cookstove offsets, while ensuring that offsets take into account all of the climate forcing agents emitted should improve the credibility and size of cookstove-generated carbon offsets.
Acknowledgments
This work was supported by a Robertson Summer Research Fellowship through UC San Diego's School of Global Policy and Strategy and the Qualcomm Institute.