


Abstract
Maize yield is sensitive to high temperatures, and most large scale analyses have used a single, fixed sensitivity to represent this vulnerability over the course of a growing season. Field scale studies, in contrast, highlight how temperature sensitivity varies over the course of development. Here we couple United States Department of Agriculture yield and development data from 1981–2012 with weather station data to resolve temperature sensitivity according to both region and growth interval. On average, temperature sensitivity peaks during silking and grain filling, but there are major regional variations. In Northern states grain filling phases are shorter when temperatures are higher, whereas Southern states show little yield sensitivity and have longer grain filling phases during hotter seasons. This pattern of grain filling sensitivity and duration accords with the whole-season temperature sensitivity in US maize identified in recent studies. Further exploration of grain filling duration and its response to high temperatures may be useful in determining the degree to which maize agriculture can be adapted to a hotter climate.
Export citation and abstract BibTeX RIS

Content from this work may be used under the terms of the Creative Commons Attribution 3.0 licence. Any further distribution of this work must maintain attribution to the author(s) and the title of the work, journal citation and DOI.
1. Introduction
Most large-scale empirical studies of the effects of extreme temperatures upon maize yield have employed a single, fixed sensitivity [1–7]. A more resolved analysis is useful, however, because sensitivity varies substantially across development phases, and accounting for these variations permits for better discernment of physiological controls and quantification of the relationship between weather and yield.
Early field-scale work [8] demonstrated that the sensitivity of maize yield to temperature peaks at a value approximately three times above the average around 90 days after planting, during silking. Since that time, many further field-scale studies have confirmed that maize yield is particularly sensitive to elevated temperatures during silking as well as grain filling [9]. Several large-scale empirical analyses have also analyzed sensitivity during portions of maize development. For example, moderate sensitivity to high temperatures prior to silking, exceptional sensitivity during silking, and increased yields with elevated temperatures after the silking period were demonstrated for sub-Saharan maize yields [10]. Similarly, sensitivity to high temperatures during early reproductive stages has been demonstrated for US maize [11–13].
Complementary to temporal variation in sensitivity is to explore regional variations in sensitivity. Trials on various cultivars show that those planted in the South produce more heat shock proteins, lose less water, and have morphologies better adapted to hot environments relative to those typically planted in the North [14]. It has also been shown that temperate cultivars accelerate development in response to high temperatures more so than tropical varieties [15, 16]. Consistent with these variations amongst cultivars, maize has been found to be more sensitive to high temperatures in the US North than South [7, 17].
Also suggested is that the observed spatial variations in sensitivity may permit for inference of adaptability to future increases in temperature [7], though the appropriateness of such an inference depends on the basis for present spatial variations in sensitivity, and whether these qualities could be advantageously imported to new regions given warmer conditions [17–19]. Here we focus on identifying physiologic adaptations to high temperatures in rainfed maize that may underlie variations in spatial sensitivity.
2. Methods
We first characterize spatial variation in temperature sensitivity using a model with a single fixed sensitivity over the course of the entire growing season, similar to the approach in many previous studies [1–7], and then introduce a technique to incorporate developmental data into a regression model in order to explore how temperature sensitivity varies through the growing season.
As input to the regression model we use development data from the United States Department of Agriculture/National Agriculture Statistics service1
and temperature data from the United States Historical Climatology Network weather stations [20]. Development data are available for 17 states within the Eastern United States, all extending from 1981–2012 except for Georgia (1981–1999) and Texas (1985–2012). Virginia, Tennessee, and North Dakota also have development data but are omitted because less than 15 years of data makes reliable parameter estimation difficult. Temperature data are maximum daily temperature, denoted  , and minimum daily temperature,
  . These daily temperature values are interpolated from a subset of 444 weather stations using a Delaunay Triangulation [21] to the center point associated with each county contained within the 17 states having sufficient development data
Heavily irrigated counties are excluded from our analysis because irrigation significantly reduces temperature sensitivity [7] and to ensure a more homogeneous sample. Specifically, irrigation data are averaged across three available census years (1997, 2002, 2007) and counties whose average irrigation exceeds 10% of its total harvested area are excluded. Colorado is removed entirely for having only a single unirrigated county with a sufficiently long record of maize planting, bringing the total number of states analyzed to 16.
We use growing degree days (GDD) as an estimate of the beneficial effects of temperature. GDDs are typically used as a measure of the thermal time required for a specific cultivar to develop, but in this aggregate analysis there are many maturity classes within any given state on any given year, and yearly GDDs help determine which of those cultivars are most successful. This approach is in keeping with previous aggregate statistical studies [7, 10, 22]. The daily heat unit,  , is defined on each day, d, using the representation of [23]:

where,
 is defined with analogous bounds. Similarly, damaging heat units, killing degree days (KDDs), are used to quantify temperatures that may reduce yields, for example, through desiccation or accelerated development, and are defined as,
In the above, Tlow is set to 9 °C and Thigh to 29 °C, similar to typical values for GDDs [23]. A Thigh value of  for damaging temperatures is consistent with previous statistical studies of the influence of high temperature on yield [2, 5–7, 10], though is notably cooler than thresholds established for protein denaturing (
 ) [24] or photosynthetic inhibition (
 ) [25]. This discrepancy can be explained in that KDDs represent many negative effects of high temperature, which begin to accrue at temperatures just above the optimum. It is also noteworthy that discrepancies can exist between ambient air temperature—for which data are widely available—and crop canopy temperature [26]. We also experimented with including freezing days, precipitation, and potential sunshine hours in the model but these were ultimately rejected for adding little explanatory power relative to the increased number of free parameters, particularly in that our focus is on variations in the sensitivity to temperature.
Summing GDDd and KDDd across each year's growing season and removing the sample mean across all years, y, gives anomalies in accumulated temperature measures, GDD and KDD
 , with which we formulate a panel regression model for the yield,

 represents the yield in county c and year y expressed in metric tons per hectare (t/ha). The
  term is a county dependent intercept, whereas other β terms are uniform across each state, i. The inclusion of a state-wide linear time trend sensitivity,
  , accounts for technological improvement over the study period, 1981–2012. Overall positive yield trends are a result of both cultivar and management improvement, with the greatest increase generally attributed to greater stand densities, which have increased by approximately 1000 plants per hectare per year [27–29]. In addition, kernel weight has increased over the course of plant breeding and contributes to the higher yields of modern varieties [30]. Although the estimated
  ,
,  , and
, and  would not change if the magnitude of GDD and KDD were used instead of anomalies, the value of
  would then not be interpretable as the mean county yield. This model is similar to that used in other recent studies [6, 22], though here it is employed to estimate spatial variation in parameter estimates, as in [7].
Resolving temporal as well as spatial variations in yield sensitivity requires additional analysis. First, we develop and employ a technique to combine state-level development data with county-level yields and weather station temperatures. The United States Department of Agriculture/National Agriculture Statistics Service development data indicates when crops pass through six distinct developmental stages: planting, silking, doughing, dented, mature, and harvested. These stages are used to define four phases of maize development: (1) planting to silking is collectively referred to as the vegetative phase; (2) silking to doughing is the early grain filling phase, (3) doughing to mature is the late grain filling phase; and (4) mature to harvested is the drydown phase. Note that phase three encompasses passage through the dented developmental stage, making the early and late grain filling phases of similar duration. Although yield is largely biologically insensitive to most environmental stresses during phase 4, the model is ultimately constrained by actual yields as reported, and omitting possible influences such as sufficiently high temperature for crop drydown, which can influence harvesting, could introduce biases in the parameters inferred for the other phases.
Developmental values are reported as percentages of total acreage having attained a particular stage on a weekly basis. We linearly interpolate these data to daily values and, if the data do not cover 0 or 100%, linearly extrapolate to these end values in the adjacent weeks. Cumulative distributions of development stage are converted into instantaneous daily fractions by subtracting the total percentile of acreage in the following stage of development and dividing by a factor of 100, 
 represents the fraction of the planted area in each state within each phase, p, on day, d (figure 1). Note that crops across a state can be in several phases on any given day, and in many states this is indeed the case during the middle of the growing season.
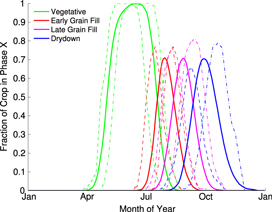
Figure 1. The fraction of planted area in Iowa in each of four development phases. Solid lines show the mean developmental phase distributions across all reported years, dashed lines are for the earliest planting date (March 26th, 2012), and dot-dashed lines are for the latest planting date (April 21st, 2008), nearly a full month later. Iowa is the largest producer of maize in the US, with over a third of the state's area dedicated to maize cultivation.
Download figure:
Standard image High-resolution imageIncorporating this detailed temporal information on growing phases is important because of the variability in both the seasonal cycle of temperature and cropping calendars. Planting has shifted about two weeks earlier across the US corn belt over the last three decades [31], and Southern maize is typically planted about a month earlier than in the North. There is also substantial interannual variability in the timing and amplitude of the seasonal cycle in temperature, as well as evidence for a general shift toward earlier seasons by a few days over the last century [32]. The combined effects of variations in the seasonal cycle and planting date permit for substantial changes in the temperatures that a crop may experience during a given growth phase.
To incorporate development data into predictor variables, daily GDD is weighted by the fraction of crop in a given phase,  , where the sum is over the days comprising a given growth period as a function of state and year. KDDp is calculated analogously.
  and
and  are then used as predictors for county yield in a multiple linear regression
Here, as in equation (3), the β terms are defined for each state, i, as dictated by the scale at which the development data are reported, and values are estimated using ordinary least squares. As with equation (3), primes on GDD and KDD indicate that the mean has been removed to prevent interaction with the  term. These model results have a mean coefficient of determination of 0.69, with generally better fits in the North than the South and, of course, superior fits than the single season sensitivity (figure S1). We note that it is also possible to select a different Thigh for each growing phase [9] within each state, but that such an approach would introduce a large number of adjustable parameters that would be partially redundant with the sensitivity parameters.
The use of specific crop phase dates for defining GDD and KDD is critical to the performance of our model. The supplemental material, available at stacks.iop.org/erl/10/034009/mmedia, contains a counterfactual example where phase dates are fixed to their average times across years, whereupon the inferred sensitivities are unphysical, and the explained variance is reduced. Also see [11–13] for further discussion regarding the importance of correctly resolving growth stages in considering yield sensitivity.
Generally, the sensitivity to GDDs are found to have a positive coefficient across each phase and state, whereas KDDs have a negative coefficient across states (figure 2). As each state contains various cultivars having different GDD maturity ratings, the generally positive coefficient of GDD is interpreted as reflecting greater yields for longer maturing varieties [33]. That an increase in GDD may further benefit yield is also likely related to the degree to which carbon uptake, chlorophyll production, and growth may be inhibited at lower temperatures [9, 34, 35] as well as the fact that GDDs and mean temperature are strongly correlated. Specifically, the correlation between daily GDDs and the daily average temperature calculated for each county included in our analysis gives an average Pearson's coefficient of r = 0.94. Also in keeping with the inferred sign of the response, KDDs are expected to damage yield through desiccation, accelerated development, and, at especially high temperatures, tissue and protein damage [15, 24, 25].

Figure 2. Yield sensitivity to growing and killing degree days. Phase sensitivity is indicated by shading within the wheels corresponding to: (1) vegetative, (2) early grain filling, (3) late grain filling, and (4) drydown. The whole season sensitivity is indicated by the background shading of each state. (a) Growing degree day (GDD) sensitivity is largest in the northern states during early and late grain filling. (b) Killing degree day (KDD) sensitivity is generally largest during early grain filling, but late grain filling is of a comparable magnitude in the North.
Download figure:
Standard image High-resolution imageUncertainties associated with  sensitivities are calculated using bootstrap resampling. Each county is resampled 1000 times using individual years as independent replicates. In addition, we perform a more conservative block resampling in which all counties within a given state and year are resampled together as a unit. This reduces the effective degrees of freedom by a factor of nearly 100 and provides an upper estimate for the uncertainty (figure S2), but in this case GDD and KDD sensitivity in many state and stage combinations are difficult to distinguish, which runs counter to the the overall consistency observed between states and physiological expectation. County based bootstrap estimates are, therefore, used for cited uncertainties.
3. Results
Each phase of development represents a unique period of the maize plant's phenological cycle and entails a different response to environmental conditions. The overall life cycle is divided between vegetative and reproductive phases, with roughly half of each growing season spent in each. During the vegetative phase a seedling expands its surface area and the leaf area index of the plant is set, influencing the amount of radiation that can be intercepted over the remainder of its lifecycle [23, 36]. Sensitivity to both KDDs and GDDs are low relative to other stages (see figure 2 and table S1), though Texas shows pronounced sensitivity to KDDs at −0.017 ((t/ha)/( C day)) (95% c.i. −0.019 to −0.016), possibly because overall hotter temperatures make seedlings particularly vulnerable [37].
The early grain filling phase, as defined here, begins with the emergence of silks from the ends of the ears and begins the reproductive portion of the plants' life cycle. As has long been recognized [8, 38], yields are highly susceptible to elevated temperatures during silking and early grain filling [9, 10, 12, 30, 39, 40]. Indeed, we find that average sensitivity to KDDs across states during this phase is a factor of four greater than during the vegetative phase at −0.025 ((t/ha)/( C day)) (95% c.i. −0.024 to −0.026). Sensitivity to high temperatures results from damage to silks and fewer kernels being fertilized or other factors influencing kernel viability [41–44]. This phase also accounts for about 20% of final kernel dry mass [23] and, therefore, entails responses similar to those found during late grain filling, discussed below.
Late grain filling is the combination of the doughing and dented stages, and is when the majority of photosynthate and carbon reserves are transferred into the growing kernels. At this point, yield damages are generally a result of lower final kernel mass rather than lower total kernel number. High temperatures are known to directly reduce kernel mass [45, 46], consistent with the high sensitivity we find. In addition, high temperatures can lead to acceleration through the growth phase, reducing the total number of days of grain filling and lowering kernel mass [47–53]. On average, yield sensitivity during late grain filling is smaller than during early grain filling, with mean losses from KDDs of −0.014 ((t/ha)/( C day)) (95% c.i. −0.013 to −0.015). Wisconsin has the greatest sensitivity with −0.05 ((t/ha)/(
 C day)) (95% c.i. −0.04 to −0.06) losses and Texas is the least vulnerable to KDDs at 0.006 ((t/ha)/(
 C day)) (95% c.i. 0.004 to 0.008).
With regard to GDDs during late grain filling, the greatest increase in yield occurs in Minnesota with values of 0.015 ((t/ha)/( C day)) (95% c.i. 0.014 to 0.016). The mean increase is 0.0055 ((t/ha)/(
 C day)) (95% c.i. 0.005 to 0.006), consistent with cultivars that are able to take advantage of greater accumulation of moderate temperatures and longer period of radiation interception having a higher yield [45, 47, 54]. The fact that Texas has a positive late grain filling KDD sensitivity estimate and a negative GDD sensitivity may be because collinearity of the predictors confounds some of the results, similar to Iowa's negative GDD sensitivity during early grain filling. Note that whereas high KDDs usually shorten the duration of grain filling, the total accumulated GDDs are still higher in years with higher KDDs, consistent with previous work on development under hotter conditions [53].
The end of the plant's life cycle is the drydown phase, when the plant ceases to photosynthesize and kernels lose water, generally drying from just over 30% moisture to about 20% moisture when ready for harvest. Sensitivity parameters indicate a positive effect from KDDs in many northern states, possibly because insufficient drydown is most probable there, with consequences for vulnerability to pests, mold, or other pre-harvest losses. Statistical studies including but not independently resolving the drydown phase presumably conflate the positive effects of KDDs during drydown with negative effects during grain development. Some states in the eastern corn belt still indicate strong GDD sensitivity during the drydown phase possibly because the late grain filling interval in the USDA data extends into the drydown phase, or that the higher GDDs play a similar role to KDDs in promoting drying. Altogether, these results highlight the variability of the temperature response according to developmental phase.
It is useful to make a direct comparison between whole-season sensitivity and the phase-based sensitivity estimates. Whole season sensitivity implicitly sums over the product of the distribution of KDDs (or GDDs) and sensitivity throughout the growing season. A development phase that was highly sensitive but experienced no KDDs, for example, would not contribute to whole-season KDD sensitivity. Thus, in order to provide a direct comparison of whole-season sensitivity to phase-based sensitivity, we weight each phase according to the fraction of KDDs that it accounts for and estimate the slope between the two measures. Slope is estimated using a York fit [55], which has the advantage of accounting for uncertainties in both the ordinate and abscissa.
The best-estimate slope between weighted drydown-phase KDD sensitivity and whole-season KDD sensitivity is weak and negative at −0.1 (95% c.i., −0.2 to 0.1), consistent with the foregoing discussion that KDDs can be beneficial for drydown in the most Northern states, whereas they are typically detrimental during other growth phases. The slope for the vegetative phase is also negative and weak at −0.2, as well as uncertain (95% c.i., −0.5 to 1.1), consistent with generally low KDD sensitivity during this phase. Of greater pertinence is that the slope between KDD sensitivity for whole season and early grain fill is 1.1 (95% c.i., 0.5 to 2.8), indicating that the spatial variation observed over the whole season are substantially determined by variations in early grain filling (figure S3). Similarly, the slope with late grain fill is 0.6 (95% c.i., −1.2 to 1.7) indicating a further correspondence (figure S3). Together, the grain filling phases of development account for the observed pattern of sensitivity to KDD, and are the focus of attention hereafter.
The estimated spatial variations in grain filling sensitivity are consistent with field trials where the responses of temperate and tropical maize to heat exposure were examined prior to and through early reproductive development [15]. In these trials, well-watered temperate and tropical varieties gave similar yields under normal temperature conditions, but when exposed to higher temperatures during what was likely the late blister, milking, and doughing stages, the temperate varieties responded by accelerating through grain filling and having larger yield reductions. Specifically, temperate varieties showed a 21 day decrease in the duration of the reproductive period as a consequence of heating, compared to a five day decrease in tropical hybrids and no decrease in temperate–tropical hybrids. Furthermore, temperate varieties had a greater decline in conversion of radiation to biomass when exposed to higher temperatures during early grain filling.
The USDA development data permits for an examination of changes in the duration of grain filling in response to high temperatures across the Eastern US. We find that the durational response to KDDs closely follows the number of KDDs experienced in a given state. States whose climatological average KDDs during early grain filling are below the median (<37 KDDs for MI, WI, MN, PA, IA, OH, SD, and IN) show an average decrease in the duration of early grain filling by 0.04 days per KDD. States clustered in the third quartile of exposure to KDDs ( ; IL, NE, KY, and MO) show a shortening of the early grain filling phase by 0.01 days per KDD. And three out of four states in the upper quartile (>66 KDDs; NC, GA, TX, but not KS) show the opposite sign of response, on average across the four states, increasing the duration of early grain filling by 0.09 days per KDD (figure 3(a)). Similar to early grain filling, late grain filling at the low end of the KDD climatology shows an average decrease in duration of 0.12 days per KDD(<50 KDDs); those at the mid-range (
 ) show a weaker decrease at 0.06 days per KDD; and those at the highest range (>85 KDDs) show an increase in duration of 0.04 days per KDD (figure 3(b)). Although the climatological values of KDDs differ between early and late grain filling, the same states are kept in each climatological category.

Figure 3. Relationship between killing degree days and duration of grain filling. Northern states show a decrease in the duration of both (a) early grain filling and (b) late grain filling in seasons with greater KDDs, whereas Southern states show an increase in duration. These regional variations in duration may represent a physiological trait important in determining differential sensitivities to KDDs. For readability, the axes for early grain filling truncate the most extreme values for Georgia, Texas, and North Carolina
Download figure:
Standard image High-resolution image
Changes in the duration of grain filling are primarily associated with interannual variability, as opposed to long term trends. The detrended length of early grain filling has an average standard deviation across states of 3 days, whereas the average trend is toward lengthening at 0.16 days/year. Similarly, late grain filling varies by nearly 4 days and has a lengthening trend of only 0.05 days/year. Standard deviations are similarly larger than trends in just the three Southern states with elongated grain filling phases during hotter seasons. These results strongly suggest that steady technological changes are not the source of the KDD-duration relationship, and are consistent with variations in the duration of grain filling as features of given cultivars.
The variations of grain filling duration as a response to high temperatures found here generally accord with the aforementioned field trial results [15], presuming that hybrids in the South are most similar to those of tropical or temperate–tropical origin. That both early and late grain filling phases indicate similar patterns with respect to climatological KDDs also suggests that these results are robust. Combining early and late grain filling into a single phase gives a similar result but with smaller fractional changes in duration because high KDDs do not generally persist equally across the early and late phases.
4. Discussion and conclusion
Longer grain filling with hotter temperatures can be associated with lower sensitivity to high temperatures on account of pattern correspondence between acceleration and sensitivity across the US, similar responses seen in field trials, and on the physiological basis of longer duration leading to greater kernel mass, so long as crops remain adequately watered [15, 29]. The physiological pathway by which temperature variation influences the timing of the transition out of grain filling is unclear, though evidence for the role of reaching a critical moisture content [56] suggests that increased drying associated with higher temperatures and higher vapor pressure deficits would lead to an earlier transition, as observed in the North. Refining our understanding of how temperature influences grain filling duration, especially in the South and in tropical varieties, may lead to a better understanding of how to reduce damages from a hotter climate.
Correspondence between KDD sensitivity and climatology over the whole season was identified in an earlier study and offered as a basis for inferring the adaptability of cultivars to higher temperatures [7]. The association of yield sensitivity to KDDs and variations in grain filling duration documented here (also see figure S4) provides a more physiologically based perspective on patterns of KDD sensitivity. An important question, however, is why has a modification such as increasing the duration of grain filling in response to higher temperature not yet been introduced into Northern states if it reduces yield losses? More general versions of this question have been raised elsewhere [17], and one possibility is that such a modification only becomes physiologically feasible under warmer conditions, possibly because of a longer growing season [12, 18]. In this speculative case, lengthening of grain fill duration in response to higher temperatures would constitute a climate change adaptation in the sense articulated by [19]. The question remains, of course, as to whether elongated duration of Southern grain filling would be transferrable to Northern cultivars under conditions of a warming climate and whether it would prove effective in mitigating yield losses that would otherwise accrue.
Building from previous controlled field-scale studies of yield loss in the presence of altered temperature [15, 16] appears useful for furthering our understanding of potential adaptation to climate change. Field trials could be conducted to determine whether Southern varieties could be advantageously grown at Northern latitudes under higher temperatures, or, more elaborately, Northern cultivars could be similarly tested after breeding for longer duration of grain fill in response to higher temperatures.
The risks posed by climate change for agricultural production remain uncertain, as highlighted by the fact that the Fourth Intergovernmental Panel on Climate Change Assessment Report [57] suggested an increase in maize production under conditions of moderate warming with adaptation, whereas the most recent Fifth Assessment Report [58] suggested losses. This variability appears to result from the ensemble of available studies having substantial spread, and that subtle shifts in modeling frameworks can have significant influences on individual results. It is suggested that increasing the physiological interpretability of simple statistical models used to explore large-scale changes in production may help to reduce some of this ambiguity through better bridging their results with more complete agricultural models [59] and facilitating testing of results against field-scale trials.
Acknowledgments
Comments that led to improvements in this manuscript were provided by Nathan Mueller, N Michelle Holbrook, an anonymous editor, and an anonymous reviewer. Funding was provided by the Packard Foundation and NSF grant 1304309.
Footnotes
- 1
Of Agriculture/National Agriculture Statistics Service U S D Quickstats URL http://quickstats.nass.usda.gov/