

Abstract
Climate change, with increased temperatures and varied rainfall, poses a great challenge to food security around the world. Appropriately assessing the impacts of climate change on crop productivity and understanding the adaptation potential of agriculture to climate change are urgently needed to help develop effective strategies for future agriculture and to maintain food security. In this study, we studied future maize yield changes under 1.5 °C (2018–2037) and 2 °C (2044–2063) warming scenarios and investigated the adaptation potential across China's Maize Belt by optimizing the sowing date and cultivar using the APSIM-Maize model. In comparison to the baseline scenario, under the 1.5 °C and 2 °C warming scenarios, we found that without adaptation, maize yields would increase in the relatively cool regions with a single-cropping system but decrease in other regions. However, in comparison with the baseline scenario, under the 1.5 °C and 2 °C warming scenarios with adaptation, maize yields would increase by 11.1%–53.9% across the study area. Across the maize belt, compared with the baseline scenario, under warming of 1.5 °C, the potential sowing window would increase by 2–17 d, and under warming of 2 °C, this sowing window would increase by 4–26 d. The optimal sowing window would also be significantly extended in the regions with single-cropping systems by an average of 10 d under the 1.5 °C warming scenario and 12 d under the 2 °C warming scenario. Late-maturing cultivar achieved higher yield than early-middle maturing cultivars in all regions except the north part of Northeast China. Adjusting the sowing date by increasing growth-period precipitation contributed more (44.5%–96.7%) to yield improvements than shifting cultivars (0%–50.8%) and climate change (−53.1% to 23.0%) across all maize planting regions except in the wet southwestern parts of the maize belt. The differences among the maize planting regions in terms of high adaptation potential provide invaluable information for policymakers and stakeholders of maize production to set out optimized agricultural strategies to safeguard the supply of maize.
Export citation and abstract BibTeX RIS

Original content from this work may be used under the terms of the Creative Commons Attribution 4.0 licence. Any further distribution of this work must maintain attribution to the author(s) and the title of the work, journal citation and DOI.
1. Introduction
Global grain demand is likely to increase further to safeguard food security with the rapidly growing human population (Regmi and Meade 2013, Keating et al 2014, West et al 2014, Ehrlich and Harte 2015). However, global climate change poses significant pressure on crop production, especially because rising temperatures shorten the crop growth period and therefore decrease the accumulation of photosynthetic assimilation (Liu et al 2014, Hunt et al 2019). Therefore, climate change is a key challenge for increasing harvested grain.
Maize (Zea mays L.) is a staple grain and feed crop with the greatest world production (IPCC 2014). China is the second largest maize producer in the world, accounting for 17.7% of the total worldwide maize planting area and 18.6% of worldwide production (FAO 2017). Achieving high maize yields and maintaining maize yield stability are of vital importance in China due to the high demand for maize production for a population of more than 1.3 billion (Huang et al 2017). However, the mean annual air temperature in China has increased by 1.2 °C since the 1960s (Piao et al 2010, Yu et al 2018), which becomes a major obstacle to safeguard the supply of maize due to its negative impacts on maize production (Lobell et al 2011, Wang et al 2014, Li et al 2016, Liang et al 2018). Although the impacts of climate change on maize yields depend on local climate conditions, climate warming has decreased maize yields in most maize planting regions of China mainly by shortening the maize growth period (Mo et al 2016, Liu et al 2017, Chen et al 2018, Huang et al 2018).
Climate change could have positive impacts on maize production if effective adaptation options are used (Asseng et al 2019, Hunt et al 2019). Many studies have investigated the impacts of various climate change adaptation options on maize yield and found adjusting sowing date and selecting suitable cultivars were two cost-effective adaptation options (Wang et al 2012, Tachie-Obeng et al 2013, Zhao et al 2015, Abbas et al 2017). In general, planting maize cultivars with longer growth periods could compensate for the negative impact of rising temperatures on maize yield (Wang et al 2014, Bu et al 2015, Huang et al 2018). Earlier maize sowing was recommended for adapting to climate change in most maize planting regions in China (Tao and Zhang 2010, Liu et al 2013). This approach is recommended because adjusting the sowing date could help reduce the risk of high temperatures and droughts during the key growth stages to maize yields (Rahimi-Moghaddam et al 2018).
Temperature is projected to further increase in the future (Harrison et al 2014). Therefore, the impacts of future climate change on maize production have been investigated worldwide (Rurinda et al 2015). In China, simulation studies have shown that future climate change would further increase maize yields in the northern part of the northeast spring maize planting region due to an elevated CO2 concentration and more precipitation events (Xiong et al 2007, Wang et al 2011, Xu et al 2014, Liang et al 2018), while climate change characterized by rising temperature would decrease maize yields in other maize planting regions mainly by shortening the crop growing period (Xiong et al 2007, Tao and Zhang 2011, Lin et al 2017, Chen et al 2018). Limited studies in Northeast China and the North China Plain showed that adjusting the sowing date and cultivar shifting could be used to adapt to future climate change (Tao and Zhang 2010, Lin et al 2015). However, the adaptation potential of maize production to future climate change, especially under the target warming of within 1.5 °C and 2 °C across the whole maize growing regions of China, has not been investigated. The contrasting climates and cropping systems across the maize belt imply that there could be large regional differences in the adaptation potential of maize production to climate change. Moreover, the relative contribution rates of adjusting sowing dates and shifting cultivars need to be identified to understand the adaptation mechanism of maize production to future warming of 1.5 °C and 2 °C. Overall, understanding the adaptation potential of agriculture to climate change and the adaptation mechanism could help in the development of effective strategies to maintain grain security and design future maize production layouts in China.
The objectives of this study are to (1) explore the impacts of climate change on maize yields under two warming scenarios, (2) determine the optimal sowing windows and suitable cultivars in six maize growing regions of China under baseline and warming scenarios, (3) investigate the adaptation potential of adjusting the sowing date and shifting the cultivar in response to climate change, and (4) identify the relative contribution rates of adjusting the sowing date and shifting the cultivar to yield increases under climate change.
2. Materials and methods
2.1. Study area, historical climate, crop and soil data
China's Maize Belt was divided into six maize planting regions (figure 1) based on geographic location and different cropping systems (table 1). We focused on 163 weather stations with observed climate data in the belt for rainfed maize plantings. Historically observed daily climate data of 163 weather stations from 1980 to 2016 were available from the China Meteorological Administration to drive the maize model and calculate the thermal time of different growing seasons and maize cultivars, including maximum temperature (°C), minimum temperature (°C), precipitation (mm) and sunshine hours (h). Daily solar radiation (MJ m−2) was estimated using the Angstrom equation with sunshine hours (Wang et al 2015a). Observed phenological data during 1980–2011 by 100 agro-meteorological observational sites across China's Maize Belt were used to set the actual maize sowing date and derive the potential sowing window. Observed data on maize cultivar, phenology (e.g. sowing, flowering, and maturity dates), yield and field management practices from 12 experimental sites were used to calibrate and validate the maize model. These field experiments were conducted across China's Maize Belt to investigate the responses of maize growth and development to sowing date. Detailed information on soil data can be found in supplementary S1 and table S1 is available online at stacks.iop.org/ERL/15/024015/mmedia.
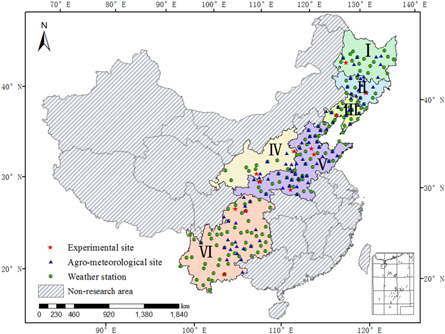
Figure 1. Six planting regions across China's Maize Belt and the distribution of the 163 weather stations, 100 agro-meteorological sites and 12 experimental sites.
Download figure:
Standard image High-resolution imageTable 1. Division of the maize planting regions and cropping systems across China's Maize Belt.
| Region | Location | Cropping system | Growing season | Number of weather station | Number of agro-meteorological site | Number of experimental site |
|---|---|---|---|---|---|---|
| I | Northeast China | Single | 1/May–30/September | 17 | 10 | 1 |
| II | Northeast China | Single | 1/May–30/September | 12 | 11 | 1 |
| III | Northeast China | Single | 1/May–30/September | 20 | 13 | 1 |
| IV | Northwest China | Single | 1/May–30/September | 9 | 8 | 3 |
| V | North China Plain | Double | 1/June–30/September | 49 | 36 | 3 |
| VI | Southwest China | Mixed | 1/April–30/September | 56 | 22 | 3 |
2.2. Future climate change scenarios
Future time series of daily temperature, precipitation and solar radiation data for the study area were statistically downscaled from monthly gridded climate data (with the resolution of 2°× 2.5°) obtained from the GISS-E2-H-CC (GE2) global circulation model (GCM), using NWAI-WG downscaling model (Liu and Zuo 2012). The spatial inverse distance-weighted (IDW) interpolation method was used to downscale gridded monthly data to sites, followed by bias-correction using qq-plotting approach by comparing observed and the GCM projected data for the period of 1960–1999. Then, the modified WGEN stochastic weather generator was used to downscale the bias-corrected monthly data to daily data. These climate outputs based on this downscaling approach have been extensively applied in climate change impact studies (Liu et al 2014, Anwar et al 2015, Wang et al 2016, 2017, 2018, Feng et al 2019, Yao et al 2020). In this study, we selected the GE2 model because it is superior in its ability to capture historical climate for China compared to the ability of other GCMs (Yang et al 2019).
To generate warming scenarios of 1.5 °C and 2 °C, 1986–2005 was set as the baseline period given that 1986–2005 is 0.61 °C warmer than the preindustrial period (IPCC 2013, UNFCCC 2015). The 1.5 °C and 2 °C warming scenarios were derived using 20 year time slice periods following the methods of previous studies (Gosling et al 2017, Leng 2018). Using the 20 year moving mean temperature method, 1.5 °C and 2 °C warming scenarios, additional warming of 0.89 °C and 1.39 °C above the baseline were anticipated during 2018–2037 and 2044–2063, respectively, for the GE2 model under representative concentration pathway (RCP) 4.5 (Schleussner et al 2016), which represents a moderate greenhouse gas emission scenario which is more closely to meet 1.5 °C and 2.0 °C target under current socio-economic conditions. Supplementary S2 and table S2 showed projected climate change during the maize growing season.
2.3. Derivation of cultivar parameters in the APSIM-Maize model
The Agricultural Production Systems sIMulator (APSIM) maize model (version 7.7) was used to investigate the future climate change adaptation potential of maize production by adjusting the sowing date and shifting the cultivar. APSIM simulates maize growth, development and yield formation in response to solar radiation, temperature, photoperiod, soil water and nitrogen (Keating et al 2003, Holzworth et al 2014). Maize phenology is determined by temperature together with photoperiod sensitivity of a given cultivar. Daily aboveground biomass accumulation is calculated by daily solar radiation interception and radiation use efficiency, reduced by soil water and nitrogen stress. Grain yield of maize is determined by grain number, daily grain-filling rate and assimilate re-translocation. Precipitation affects crop biomass accumulation and yields significantly by impacting soil water content in the APSIM. APSIM has been well evaluated and applied in China's Maize Belt and performed well in capturing the impacts of changes in climate and agronomic management practices on crop growth, development and yield (Liu et al 2013, Wang et al 2014, Bu et al 2015, Dai et al 2016). Here, we further evaluated the performance of the APSIM-Maize model in simulating the phenology and yield of maize in terms of different cultivars, sowing dates and regions across China's Maize Belt. The statistical metrics for model evaluation were shown in supplementary S3.
Three representative cultivars at different cultivar maturities (early-, middle- and late-maturing) were selected for each maize planting region to minimize the possible spatial heterogeneity in local cultivars (table 2). For regions I–III, the same representative cultivars were used due to similar cropping system and management options. Genetic parameters for four cultivars used in the APSIM were referenced directly from the literature, and the genetic parameters of the other eight cultivars were derived by model calibration and validation based on experimental field data with 'trial-and-error' method. Genetic parameters for maize phenology were determined by comparing observed and simulated flowering and maturity dates while genetic parameters for maize yields were determined by comparing observed and simulated maize yields. We also referenced the traits of maize cultivars given by breeders to ensure the physiological means of parameters. Experimental field data from the literature were extracted using WebPlotDigitizer software (https://automeris.io/WebPlotDigitizer/) from the figures in the literature. To calibrate and validate the APSIM-Maize model, field experimental data were separated into independent calibration and validation data by different sowing dates and years.
Table 2. Detailed information on cultivar, cultivar maturity, calibration and validation data, experimental site, and different sources of genetic parameters obtained across six maize planting regions.
| Maize planting region | Cultivar | Maturity | Calibration (day/month/year) | Validation (day/month/year) | Observed data for calibration and validation | Experimental site and data source | Genetic parameter source |
|---|---|---|---|---|---|---|---|
| I–III | Jidan120 | E | 4/5/1998, 6/5/1999 | 1/5/2002, 1/5/2004 | Flowering and maturity dates, grain yield | Huadian agro-meteorological site, Liu et al (2012) | Liu et al (2012) |
| Zhengdan958 | M | 7/5/2012, 15/5/2013,15/5/2014 | 27/4/2012, 17/5/2012, 8/5/2013, 22/5/2013, 8/5/2014, 22/5/2014 | Flowering and maturity dates, grain yield | Lindian experimental site, Han et al (2016) | This study | |
| Danyu39 | L | 30/4/2012, 30/4/2013 | 20/4/2012, 10/5/2012, 20/4/2013, 10/5/2013 | Flowering and maturity dates, grain yield | Jinzhou experimental site, Cui (2017) | This study | |
| IV | Shaandan9 | E | 14/6/1990, 19/6/1991 | 14/6/1992, 19/6/1993 | Flowering and maturity dates, grain yield | Wugong agro-meteorological site | This study |
| Shaandan609 | M | 10/4/2012, 10/4/2013 | 16/4/2012, 28/4/2012, 16/4/2013, 28/4/2013 | Flowering and maturity dates, grain yield | Changwu experimental site, Lu et al (2017) | This study | |
| Nongda108 | L | 2/5/2003, 28/4/2004, 30/4/2005 | 2/5/2006, 4/5/2017, 6/5/2008 | Flowering and maturity dates, grain yield | Xiyang agro-meteorological site | This study | |
| V | Yunong704 | E | 28/5/1981 | 2/6/1982, 6/6/1984 | Flowering and maturity dates, grain yield | Nanyang agro-meteorological site, Xiao et al (2016) | Xiao et al (2016) |
| Yedan22 | M | 15/6/1998, 15/6/1999, 15/6/2000, 15/6/ 2001 | 15/6/2003, 15/6/2004, 15/6/2005 | Flowering and maturity dates, grain yield | Yucheng experimental site, Chen (2009) | Chen (2009) | |
| Nongda4 | L | 21/5/2010, 21/5/2012 | 30/4/2010, 11/6/2010, 30/4/2012, 11/6/2012 | Flowering and maturity dates, grain yield | Wuqiao experimental site, Zhu (2013) | This study | |
| VI | Luodan5 | E | 6/4/2005, 3/5/2006 | 21/5/2007 | Flowering and maturity dates, grain yield | Mengzi agro-meteorological site, Dai et al (2016) | Dai et al (2016) |
| Chendan30 | M | 26/3/2015, 10/4/2015 | 25/4/2015, 10/5/2015, 25/5/2015 | Flowering and maturity dates, grain yield | Nanchong experimental site, Dou et al (2017) | This study | |
| Zhongyu3 | L | 5/5/2016, 15/5/2016 | 25/5/2016, 4/6/2016, 14/6/2016 | Flowering and maturity dates, grain yield | Zhongjiang experimental site, Ren et al (2017) | This study |
E, M and L represent early-, mid- and late-maturing cultivars, respectively.
2.4. Setting up simulations in APSIM
To evaluate the adaptation potential of maize production to climate change, long-term simulations driven by projected daily climate data including solar radiation, maximum and minimum temperatures and precipitation, for the baseline scenario and 1.5 °C and 2 °C warming scenarios were conducted without any nitrogen stress during the maize growth period under rainfed conditions. Nitrogen fertilizer was applied automatically within 50 cm depth in the soil to keep mineral nitrogen no less than 300 kg ha−1 to avoid of any nitrogen stress. All simulations were conducted under rainfed conditions. For single-cropping maize planting regions (I–IV), the simulation of the first 10 years was discarded as a 'spin up' period to minimize the effect of the initial condition (Teixeira et al 2015, Tang et al 2019). For the double-cropping system (V–VI), the initial soil water content at the maximal root depth at sowing was reset at 30% and 81% of the plant available water holding capacity for regions V and VI, respectively, according to the observed historical averaged initial soil water content at sowing from agro-meteorological experimental sites. For all maize planting regions, the maize planting density was set as 67 500 plant ha−1. The planting depth and row spacing were set as 5 cm and 60 cm, respectively. Our study also considered the impact of an increase in CO2 concentration on maize (supplementary S4). For C4 crop, the elevated CO2 concentration mainly affects plant transpiration. Pervious study has showed that transpiration efficiency was increased linearly by 37% with CO2 concentration increasing from 350 to 700 ppm (Lobell et al 2015), and therefore we nested this function into APSIM-Maize model.
2.5. Sowing window and cultivar with and without adaptation
In the case of without adaptation options, actual sowing date at each weather station used the average sowing date from historically observed values at each nearest agro-meteorological sites and actual maize cultivar was selected from local typical cultivars in table 2 based on the heat condition at the planting region (supplementary S5 and table S3).
When considering adaptation strategies, the optimal combination of sowing date and maize cultivar was selected from three typical cultivars in table 2 and the sowing date within the potential sowing window for each planting region. The potential sowing window for each region was defined as the period between the earliest and latest planting dates for the early-maturing cultivar at each planting region. The earliest planting date was set as the first day when the five-day moving average of daily average temperature was >8 °C, which is the baseline temperature for maize used in the APSIM-Maize model and is based on a literature review (Sánchez et al 2014) in regions I–IV. In region V, with a double-cropping system, the earliest planting date constrained by the harvesting date of the previous crop was set 3 d after harvesting the previous crop recorded in agro-meteorological sites. In region VI, with a mixture of a single-cropping system and a double-cropping system, the earliest planting date was set as the recorded averaged maize planting date from agro-meteorological sites. The latest planting dates in regions I–IV were set as the last day maize could mature before the first frost day calculated as the daily minimum temperature below 0 °C. In regions V–VI, the latest planting date was set as the day maize could mature at 7 d before sowing the next crop. Maize was harvested when one of the following three conditions was achieved: (1) at the physiological maturity date, (2) before the first frost day and (3) 3 d before sowing next season crop.
The optimal sowing window was prescribed as the sowing dates that achieve over 80% of the highest yield within the potential sowing window. Cultivar harvested the highest yield was chosen as the optimal cultivar for a given region.
2.6. Simulated yield change analyses
There were four types of simulated yield changes (%) in our study compared with that of the baseline scenario: (1) ΔY1.5/2.0 was the yield change under the 1.5 °C or 2.0 °C warming scenarios compared with baseline, (2) ΔY1.5/2.0,s was the yield change caused by climate change from baseline to 1.5 °C or 2.0 °C warming scenarios and the adjusting sowing date, (3) ΔY1.5/2.0,c was the yield change caused by climate change from baseline to 1.5 °C or 2.0 °C warming scenarios and the shifting cultivar, and (4) ΔY1.5/2.0,s&c was the yield change when considering climate change from baseline to 1.5 °C or 2.0 °C warming scenarios, changing the sowing date and shifting the cultivar.


where subscripts s and c represent adjusting sowing date and shifting cultivar, respectively. Ybl/1.5/2.0 was the simulated average yield for baseline or under warming of 1.5 °C or 2 °C without adaptation, Y1.5/2.0,s was the simulated yield with the adjusted sowing time alone under warming of 1.5 °C or 2 °C, Y1.5/2.0,c was the simulated yield with the shifted cultivar alone under warming of 1.5 °C or 2 °C, and Y1.5/2.0,s&c was the simulated yield with the adjusted sowing date and shifted cultivar under warming of 1.5 °C or 2 °C.
2.7. The relative contribution rate of adjusting the sowing date and shifting the cultivar to yield change
ΔYs, ΔYc and ΔYs&c (intermediate variables) were the yield changes that occurred after adjusting the sowing date, shifting the cultivar and combining the adjusted sowing date and shifted cultivar under the 1.5 °C or 2.0 °C warming scenarios compared with the yield under the baseline scenario. The relative contribution rate of climate change (ΔR1.5/2.0), change in sowing date (ΔRs), change in cultivar (ΔRc), and combined change in sowing date and cultivar (ΔRs&c) on yield change was calculated as follows:


3. Results
3.1. Performance of the APSIM-Maize model across China's Maize Belt
Figure 2 shows the comparison of the simulated and observed phenology and yield of maize for eight typical local cultivars across China's Maize Belt. APSIM-Maize simulated the duration from sowing to flowering and from sowing to maturity well with root-mean-square error (RMSE) values of 2.1 and 4.1 d for the calibration period and 2.9 and 3.9 d for the validation period, respectively. The simulated maize yield was in good agreement with the observed maize yield with an R2 of 0.89 for the calibration and 0.79 for the validation period. For the calibration period, the RMSE was 0.97 t ha−1, the NRMSE was 9.9%; for the validation period, the RMSE was 1.38 t ha−1, and the NRMSE was 17.7%. All cultivar parameters were shown in table S4.
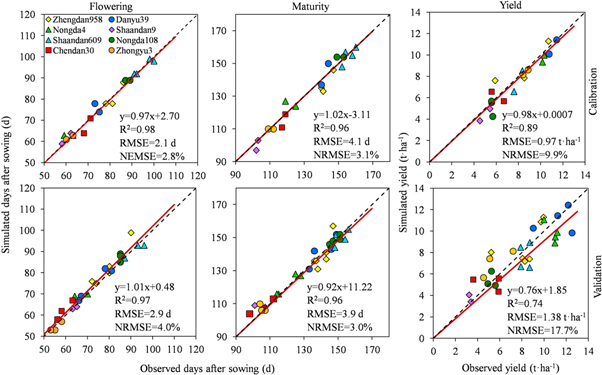
Figure 2. Comparison of simulated and observed duration from sowing to flowering (days after sowing), duration from sowing to maturity (days after sowing) and grain yield of maize. Flowering and maturity dates are defined as 50% plants flowering and 80% plants maturity. The dashed line and solid line are the 1:1 line and regression line, respectively. This figure shows calibration and validation results for eight cultivars in this study, and the parameters of other four cultivars are directly referenced from the literature. The calibration is shown in the first row with one group of experimental data (n = 18), and the validation is shown in the second row with another group of experimental data (n = 29).
Download figure:
Standard image High-resolution image3.2. Future maize yield change under different scenarios
The simulated average rainfed yield without adaptation was 5.8–10.0 t ha−1 across China's Maize Belt under the baseline climate scenario, with the highest yield in region III and the lowest yield in region IV (figure 3). In comparison with the baseline scenario, without adaptation, warming of 1.5 °C and 2 °C would increase maize yields by 0.9%–4.9% and 2.6%–7.9% in regions I–IV, respectively, and would reduce maize yields by 6.3%–7.6% and 0.1%–12.5% in regions V–VI, respectively. The factors resulting in yield change varied with region. An increasing CO2 concentration would lead to maize yield increases in regions I, II and IV (figure 4 and table S5). For region III, the combined increase in growing period precipitation and CO2 concentration would increase maize yield. However, a decrease in growing period precipitation would decrease maize yield in region V. A decrease in growing period solar radiation and an increase in growing period temperature would decrease maize yield in region VI.
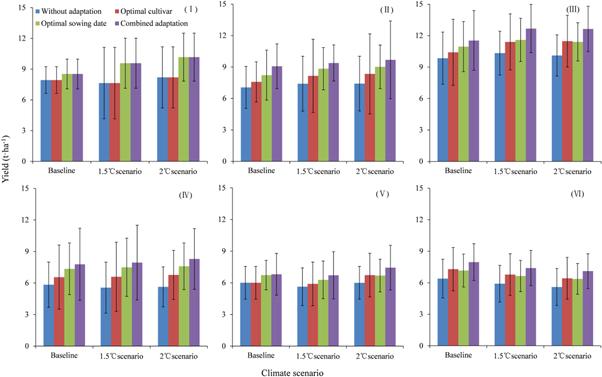
Figure 3. Simulated 20 year average maize yield without adaptation, with optimal sowing date, with optimal cultivar and combined adaptation of sowing date and cultivar under the baseline scenario (1986–2005) and the 1.5 °C (2018–2037) and 2 °C (2044–2063) warming scenarios in six maize planting regions. Error bars show the standard deviation of the simulated maize yield at different weather stations in each planting region.
Download figure:
Standard image High-resolution image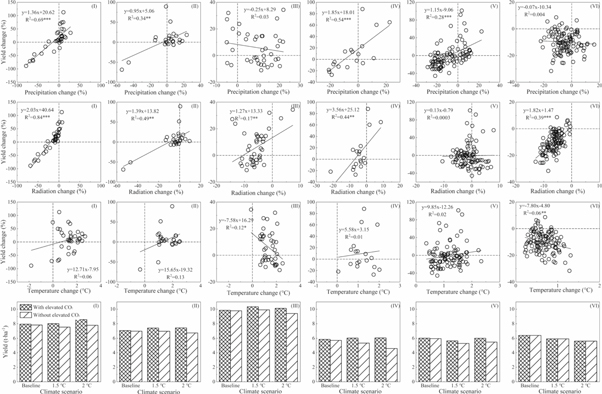
Figure 4. Relationships between simulated yield change (%) without adaptation and the changes in growing period total precipitation (%), total solar radiation (%) and average temperature (°C) in six maize planting regions. The bar plot shows maize yield without adaptation under an elevated CO2 concentration and without an elevated CO2 concentration for each scenario. The solid line is the regression line. *P < 0.05; **P < 0.01; ***P < 0.001.
Download figure:
Standard image High-resolution imageConsidering adaptation to climate change through the optimization of the sowing date and cultivar, the simulated average maize yield would increase under all scenarios (figure 3 and table S6). Across China's Maize Belt, simulated average maize yield would increase by 11.1%–53.9%, with the highest increase in regions II and IV and the lowest increase in region VI. Compared with the baseline scenario, under the warming scenarios, only adjusting the sowing date could increase the yield by −0.5% to 40.7%, while only shifting the cultivar could increase the yield by −1.8% to 24.9%.
Contribution rate of 44.5%–96.7% on yield improvement by adjusting the sowing date was higher in comparison with that of shifting the cultivar (0%–50.8%) and climate change (−53.1% to 23.0%) in most maize planting regions, except in regions III and V under warming of 2 °C and in region VI under both warming scenarios (table 3). Optimal cultivar would not change in region I implying rising heat resource under future scenarios of warming 1.5 °C and 2 °C could still not meet the thermal time required by middle-late maturing cultivars. The contribution rate of shifting the cultivar to yield improvement would increase with climate change in all maize planting regions. The combined effect of sowing date and cultivar shifting was not equal to the sum of their individual impacts in regions II–VI, suggesting an interaction effect between changing the sowing date and shifting the cultivar on maize yield change.
Table 3. The individual and combined contribution rates of climate change, adjusted sowing date and shifting cultivar in different maize planting regions.
| Planting region | Climate change scenario | ΔR1.5/2.0 (%) | ΔRs (%) | ΔRc (%) | ΔRs&c (%) |
|---|---|---|---|---|---|
| I | 1.5 °C | 3.3 | 96.7 | 0 | 96.7 |
| 2 °C | 23.0 | 77.0 | 0 | 77.0 | |
| II | 1.5 °C | 14.9 | 61.7 | 32.4 | 85.1 |
| 2 °C | 13.8 | 60.9 | 35.0 | 86.1 | |
| III | 1.5 °C | 17.1 | 44.5 | 37.9 | 82.9 |
| 2 °C | 9.3 | 46.6 | 49.2 | 90.7 | |
| IV | 1.5 °C | 6.1 | 76.3 | 40.6 | 93.9 |
| 2 °C | 6.3 | 69.1 | 39.9 | 93.7 | |
| V | 1.5 °C | −53.1 | 92.0 | 38.0 | 153.1 |
| 2 °C | −0.5 | 47.9 | 50.8 | 100.5 | |
| VI | 1.5 °C | −48.3 | 73.2 | 86.7 | 148.3 |
| 2 °C | −112.7 | 108.6 | 117.1 | 212.7 |
Note: ΔR1.5/2.0, ΔRs, ΔRc and ΔRs&c are the relative contribution rates of climate change, change in sowing date, cultivar shift, and combined change in sowing date and cultivar on maize yield change, respectively.
3.3. Potential sowing window, optimal sowing window and cultivar across China's Maize Belt
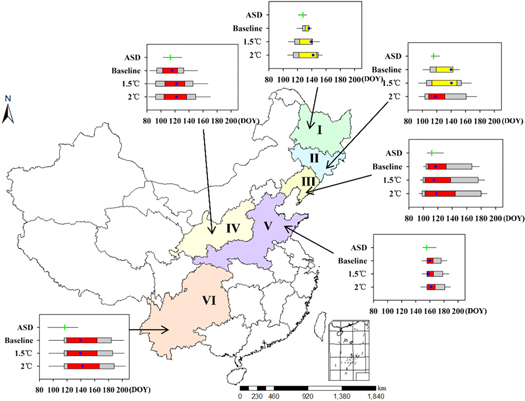
Figure 5 shows the potential sowing window, the optimal sowing window and the optimal maize cultivar maturity level across China's Maize Belt under the baseline scenario and the 1.5 °C and 2 °C warming scenarios. The earliest potential sowing date started in mid-April in regions III and IV, while the latest potential sowing date started in early June in region V under the baseline scenario. The longest potential sowing window was in region VI, with an average of 68 d, while the shortest potential sowing window was only 6 d in region I under the baseline scenario. With climate warming, the earliest potential sowing date advanced for all the maize planting regions except those in regions V and VI, where sowing dates were constrained by the harvest of the previous crop. The latest potential sowing date was delayed for all the maize planting regions. Therefore, the potential sowing window increased by 2–17 d under warming of 1.5 °C and 4–26 d under warming of 2 °C across the maize belt with a higher extension rate in higher latitude regions (e.g. regions I–III). The change in the optimal sowing window under climate change was consistent with the change in the potential sowing window. Significant advances in the start date of the optimal sowing window occurred in region I by 8 d and in region II by 10 d, while the end date of the optimal sowing window was delayed in all the maize plating regions, with a more significant delay in regions I–IV under the warming scenarios compared with under the baseline scenario. Therefore, climate warming would significantly lengthen the optimal sowing window, especially in regions I–IV, by an average of 10 d under warming of 1.5 °C and by 12 d under warming of 2 °C relative to under the baseline scenario. The actual sowing windows in regions I–II and VI occurred slightly earlier than the optimal sowing window, while they were close to the optimal sowing window in regions III–V. The optimal cultivar maturity level would change from an early-maturing cultivar under the baseline scenario and warming of 1.5 °C to a late-maturing cultivar in region II under warming of 2 °C but would not change with climate change for the early-maturing cultivar in region I and the late-maturing cultivar in other planting regions.
Figure 5. The actual sowing window (ASD) and the potential sowing window, the optimal sowing window and the optimal maize cultivar maturity across China's Maize Belt under the baseline scenario and the 1.5 °C and 2 °C warming scenarios. DOY in the x-axes of the timeline plots represents day of year. The green gaps show the actual sowing window recorded at the agro-meteorological sites, and the whiskers around the green gaps represent the standard deviation of the actual sowing date. The gray gaps show the potential sowing window, and the whiskers around the gray gaps represent the standard deviation of the earliest and latest potential sowing dates. The red or yellow gaps show the optimal sowing window, and the yellow and red shadings represent the early- and late-maturing maize cultivars, respectively. The blue dots show the optimal sowing date with the highest yield.
Download figure:
Standard image High-resolution image
4. Discussion
China's Maize Belt is one of the World's Golden Maize Belts and therefore is significant to securing global food safety. However, maize yield was significantly affected by ongoing climate change. Our simulated results show that climate change would enhance maize yields in regions I–IV mainly due to elevated CO2 concentrations together with the increase in growing period precipitation. At the same time, future maize yields in regions V–VI would decrease as a result of the decline in precipitation and solar radiation due to warming temperatures accelerating growth phases. These findings are consistent with the results of previous studies in all maize planting regions except Northwest China, where other studies found that future maize yields would decrease (Xiong et al 2007, Tao and Zhang 2011, Kang et al 2014, Lin et al 2017, Liang et al 2018). This inconsistency is possibly because our study considered the impacts of an increase in CO2 concentration on transpiration efficiency by decreasing stomatal conductance, therefore relieving water stress during the maize growing period in Northwest China (Lobell et al 2015, Zhang et al 2018).
Optimizing sowing date is recognized as one of most effective adaptation options to address climate change by matching the supply and requirement of crops to climate resources (Kamara et al 2009, Tsimba et al 2013) and mitigating climate risks such as drought and heat stress (Yang et al 2017, Rahimi-Moghaddam et al 2018, Tian et al 2019). Comparing the current potential sowing window across six regions, regions I and V have shorter sowing windows. This result occurred because region I has a shorter frost-free period, while the maize growing period of region V is constrained by a double-cropping system. With climate change, the future potential sowing window was lengthened because of the advance of the earliest potential sowing date and the delay of the latest sowing date across all six regions, which could provide more opportunities to optimize the sowing date. In addition, the potential sowing window in higher latitude regions would be extended more than that in other regions in our study due to more significant warming in northern China (Piao et al 2010), which suggests a large opportunity to adjust the sowing date to adapt to climate change in northern China.
We find that late sowing dates in regions I–II, middle sowing dates in region IV and early sowing dates in regions III and V–VI can have beneficial impacts on maize yield increases because of increased precipitation during longer growing periods (table S7). In contrast, previous studies recommend early sowing dates in regions I–II (Liu et al 2013, Bu et al 2015, Huang et al 2018). This difference is caused by the interaction between the sowing date and cultivar choice. Previous studies used a late-maturing cultivar in these regions and therefore recommended early sowing to obtain a longer growth period. However, we identified early-maturing cultivars suitable in regions I–II due to the shortage of thermal time in higher latitude regions. Late sowing becomes possible under warming scenarios, which could result in addition growth period precipitation. However, testing the adaptive potential of early sowing late-maturing cultivars in regions I–II will be the priority in future work. In contrast, our study recommended late-maturing cultivars in regions III–VI to obtain a longer growing period (table S8), which is consistent with the results of previous studies (Liu et al 2013, Bu et al 2015, Huang et al 2018).
Our study also found that there were significant interactions between sowing date and cultivar on maize yield. For example, the optimal cultivar under the current sowing date in region II is a middle-maturing variety under warming of 1.5 °C (table S9), but the optimal cultivar shifts to an early-maturing variety under an optimal sowing date (figure 5). For regions IV, late sowing is suitable to the current maize cultivar (figure S1), while middle sowing with the optimal maize cultivar harvested higher yields (figure 5) (Tsimba et al 2013). A middle sowing date interacts well with the current maize cultivar in regions V–VI (figure S1), but early sowing with the optimal maize cultivar results in a higher yield (figure 5). Furthermore, in comparison with shifting the cultivar, adjusting the sowing date contributes more in most planting regions except region VI because adjusting the sowing date increases maize yield mainly by increasing growing period precipitation, while this region is not limited by precipitation (Lu et al 2017).
Analyzing adaptation potential is helpful for decreasing yield gaps in different planting regions and distinguishing effective adaptation options for future climate change (Guan et al 2017, Rahimi-Moghaddam et al 2018). Positive adaptation potential indicates that maize yield can be increased by optimizing sowing date and cultivar choices in China under warming of 1.5 °C and 2 °C. However, the lower adaptation potential in regions V–VI than that in the other regions implies that these areas might be vulnerable to future climate change and need to be analyzed further.
The adaptation potential based on our results provides different opportunities and challenges for maize production over maize growing regions. For example, in regions I–III, climate warming lengthens the growing season making it possible to plant maize cultivars with longer growing periods (Liu et al 2013, Huang et al 2018). For region IV, the high yield of maize is still limited by low growing-season precipitation, although climate change with adaptation would increase maize yields. Therefore, selecting drought- and heat-resistant cultivars should be further studied to improve maize yields. As decreased precipitation and limited growth periods under double-cropping systems are likely to continue reducing yields in region V, improving water use efficiency by adjusting the sowing date and planting late-maturing maize cultivars in spring as well as changing the wheat-maize rotation system to a single-maize cropping system would be feasible adaptation strategies (Zhao et al 2018, Sun et al 2019). Low solar radiation in region VI could be more severe in the future; thus, breeding new cultivars with higher radiation use efficiency will alleviate the extent of this yield loss. The differences in adaptation potential and adaptation options among different maize planting regions provide useful information for decision makers and growers to optimize maize production layouts and develop effective adaptation strategies under future climate.
However, there were still some uncertainties in our study. We did not consider future cultivars, including rapidly updated higher heat- and drought-resistant cultivars, which may lead to increased adaptation (Singh et al 2014, Guan et al 2017, Tesfaye et al 2017). All simulation assumed under rainfed and no nitrogen stress conditions. There may be nitrogen fertilization and irrigation interactions with sowing date and cultivar which significantly impact maize yields. However, in China's Maize Belt, the application amounts of nitrogen fertilizer by farmers are always very high (Xu et al 2014, Xiao et al 2019), which could meet the requirement of maize growth (Chen et al 2018). Moreover, irrigation is not used frequently during maize growing season because precipitation concentrates in maize growing season such as regions I–III and V–VI or because there is no available irrigation water resource e.g. in region IV (Wang et al 2010, Yin et al 2015). Therefore, our assumptions are close to actual production conditions although optimal sowing dates and cultivars may change with different amounts of nitrogen fertilization and irrigation. Simulated maize yields are also sensitive to initial soil water content at sowing especially in the double-cropping regions implying optimal sowing dates and cultivars would change with initial soil water content. In addition, our study used a relatively optimistic climate change scenario because international efforts have been implemented to mitigate climate warming to realize the target of warming within 1.5 °C and 2 °C according to the Paris Agreement (UNFCCC 2015). Climate change would decrease maize yields more significantly under the more pessimistic climate change scenarios than under other scenarios (Xiong et al 2007, Tao and Zhang 2011). However, the design of this study based on limited scenarios and a single model could provide feasible guidance for more climate change impact assessments with multiple global climate models and multiple crop models (Araya et al 2015, Wang et al 2015b, Rahman et al 2018, Yang et al 2019).
5. Conclusion
Our study explored the impacts of future climate change on maize yield and investigated the adaptation potential across China's Maize Belt by optimizing the sowing date and cultivar with the validated APSIM-Maize model under warming 1.5 °C and 2 °C scenarios. Adaptation is necessary as maize yield declined in region V–VI without adaptation. With adaptation maize production keeps stable for increasing yield under temperature limited warming 2 °C. Adjusting sowing date increased more yield than shifting cultivar in regions I–V, and shifting cultivar produced more in region VI. The late sowing in regions I–II, the middle sowing in region IV and the early sowing in regions III and V–VI coupling with current early-maturing cultivar in regions I and later-maturing cultivar in other regions produced higher yields.
Acknowledgments
This work is supported by the National Key Research and Development Program of China [2017YFD0300304, 2017YFD0300404] and CMA/Henan Key Laboratory of Agrometeorological Support and Applied Technique (AMF201905). We are also grateful to editor and the anonymous reviewers for helpful comments on the manuscript.
Data availability
The data that support the findings of this study are available from the corresponding author upon reasonable request.