


Abstract
In view of the fact that the fast-neutron experimental cross-section data of hafnium which is an important structural material of fusion reactor are few and there are the great differences in their evaluation values, several activation cross sections of (n, 2n), (n, p), (n, a) and (n, n') reactions on hafnium isotopes have been investigated by neutrons generated from the T(d, n)4He reaction at the K-400 Neutron Generator at China Academy of Engineering Physics (CAEP). The gamma activities of the product nuclei were measured by a high-resolution gamma-ray spectrometer with a coaxial high-purity germanium detector. The 93Nb(n, 2n)92mNb reaction was used as neutron fluence standard, these experimental cross sections of the 174Hf(n, 2n)173Hf, 176Hf(n, 2n)175Hf, 178Hf(n, α)175m+gYb, 178Hf(n, p)178gLu, 178Hf(n, p)178mLu, 180Hf(n, 2n)179m2Hf, 180Hf(n, α)177m+gYb and 180Hf(n, n')180mHf reactions were obtained in the neutron energy range of 13.5–14.8 MeV. These measured cross sections were discussed and compared with some previous experimental results from the literature and with the evaluation data from ENDF/B-VIII.0, CENDL-3.1, JEFF-3.3 and the theoretical results by using the computer code system Talys-1.9.
Export citation and abstract BibTeX RIS

Original content from this work may be used under the terms of the Creative Commons Attribution 4.0 licence. Any further distribution of this work must maintain attribution to the author(s) and the title of the work, journal citation and DOI.
1. Introduction
Hafnium and its alloys have been widely used in the atomic energy industry, aerospace industry, electronic industry, chemical industry and so on. The accurate and reliable experimental cross-section data on hafnium isotopes around the neutron energy of 14 MeV are of great importance for verifying the accuracy of nuclear models used in the calculation of cross sections and for practical applications, such as for integral calculations on the first wall, blanket and shield of a conceptual fusion power reaction, and other related nuclear engineering calculations. However, until now, only a few laboratories (two to five) reported the experimental cross-section data on hafnium isotopes around the neutron energy of 14 MeV and most of them are at single neutron energy and there was disagreement in those data, which can be found in experimental nuclear reaction data (EXFOR) [1], except for the 176Hf(n, 2n)175Hf reaction whose cross-section data have been reported by as many as ten laboratories [2–11]. For example, for the 174Hf(n, 2n)173Hf reaction, we found just five laboratories [2–4, 12, 13] reported the experimental cross-section data induced by neutrons from the D–T reaction and all of them have only one cross-section value at single neutron energy; for the 178Hf(n, α)175m+gYb reaction, we found just four laboratories [2, 14–16] reported the experimental cross-section data induced by neutrons from the D–T reaction and three of them have only one cross-section datum at single neutron energy; for the 178Hf(n, p)178gLu reaction, we found just two laboratories [17, 18] reported the experimental cross-section data induced by neutrons from the D–T reaction and both of them have only one cross-section datum at single neutron energy; for the 178Hf(n, p)178mLu reaction, we found just three laboratories [17–19] reported the experimental cross-section data induced by neutrons from the D–T reaction and two of them have only one cross-section datum at single neutron energy; for the 180Hf(n, 2n)179m2Hf reaction, we found just four laboratories [3, 8, 14, 20] reported the experimental cross-section data induced by neutrons from the D–T reaction and three of them have only one cross-section datum at single neutron energy; for the 180Hf(n, α)177m+gYb reaction, we found just four laboratories [2, 4, 14, 15] reported the experimental cross-section data induced by neutrons from the D–T reaction and three of them have only one cross-section datum at single neutron energy; for the 180Hf(n, n')180mHf reaction, we found just two laboratories [4, 14] reported the experimental cross-section data induced by neutrons from the D–T reaction and one of the two laboratories has only one cross-section datum at single neutron energy. Furthermore, there are also great differences in the evaluation cross-section values on hafnium isotopes around the neutron energy of 14 MeV which can be found in several major libraries of International Atomic Energy Agency (IAEA) [21]. For example, for the 178Hf(n, α)175m+gYb reaction, the evaluation cross-section data of CENDL-3.1 (China, 2009) [22] are about twice the data of JEFF-3.3 (Europe, 2017) [23] around the neutron energy of 14 MeV; for the 178Hf(n, p)178gLu reaction, the evaluation cross-section values of ENDF/B-VIII.0 (USA, 2018) [24] are about twice the data of CENDL-3.1, about 4 times the data of JEFF-3.3 around the neutron energy of 14 MeV; for the 180Hf(n, α)177m+gYb reaction, the evaluation cross-section values of JEFF-3.3 are twice more than the data of ENDF/B-VIII.0 around the neutron energy of 14 MeV. Thus it is necessary to make further precision measurements for the cross-sections of the above-mentioned reactions on hafnium isotopes around the neutron energy of 14 MeV. In the present work, the cross-sections of the 174Hf(n, 2n)173Hf, 176Hf(n, 2n)175Hf, 178Hf(n, α)175m+gYb,178Hf(n, p)178gLu, 178Hf(n, p)178mLu, 180Hf(n, 2n)179m2Hf, 180Hf(n, α)177m+gYb and 180Hf(n, n')180mHf reactions were measured around the neutron energies of 13.5–14.8 MeV and a gamma-ray counting technique was applied using high-resolution gamma-ray spectrometer and data acquisition system. The reaction yields were obtained by absolute measurement of the gamma activities of the product nuclei using a coaxial high-purity germanium (HPGe) detector. During the irradiation, the samples were wrapped in pure cadmium foil in order to avoid the effects of the 174Hf(n, γ)175Hf, 178Hf(n, γ)179m2Hf and 179Hf(n, γ)180mHf reactions induced by thermal neutron to 176Hf(n, 2n)175Hf, 180Hf(n, 2n)179m2Hf and 180Hf(n, n')180mHf reactions, respectively. The present results were discussed and compared with previous works and with the evaluation data of ENDF/B-VIII.0, CENDL-3.1, JEFF-3.3 as well as the theoretical results by using the computer code system Talys-1.9 [25].
2. Experimental details
Nuclear reaction cross sections were measured by activation and identification of the radioactive products. There are details described in some publications [26–29]. Only some salient features relevant to the present measurements were showed here.
2.1. Samples and irradiations
The natural hafnium foils of 99.99% purity and 3 mm thickness were made into circular samples with a diameter of 20 mm. Each of them was sandwiched between two neutron flux monitor foils of niobium (whose purity and thickness are of 99.99% and 1 mm, respectively) of the same diameter as the circular hafnium foil, and was then wrapped in 1 mm thick cadmium foil (99.95% purity) in order to reduce the influence of the 174Hf(n, γ)175Hf,178Hf(n,γ)179m2Hf and 179Hf(n, γ)180mHf reactions induced by thermal neutron on 176Hf(n, 2n)175Hf, 180Hf(n, 2n)179m2Hf and 180Hf(n, n')180mHf reactions , respectively.
Irradiation of the samples was carried out at the K-400 Neutron Generator at Institute of Nuclear Physics and Chemistry, China Academy of Engineering Physics and lasted for 3–7 h with a yield of about 5 × 10¹⁰ n s−1. Neutrons in the 14 MeV region were produced from the T(d, n)4He reaction with an effective deuteron beam energy of 255 keV and a beam current of 350 μA. The solid tritium–titanium (T–Ti) target used in the neutron generator was about 2.19 mg cm−2 thick. During the irradiation, the neutron flux was monitored by the accompanying α-particles, which were measured with a Au–Si surface barrier detector used at the anger of 135°, so that corrections could be made for small variations of neutron flux. The groups of samples were placed at angles of 0°, 45°, 90° and 135° respectively, which are relative to the direction of the deuteron beam. The distances of samples from the center of the T–Ti target were about 3–5 cm.
The neutron energies in the measurements were determined beforehand from the cross section ratios of 90Zr(n, 2n)89m+gZr to 93Nb(n, 2n)92mNb reactions [30]. The measured neutron energies were 14.8, 14.4, 14.1 and 13.5 MeV at the irradiation positions of 0°, 45°, 90° and 135° angles relative to the beam direction, respectively.
2.2. Measurement of radioactivity
The samples were cooled about 5–2970 min after irradiation, these gamma-ray activities of 173Hf,175Hf,175m+gYb,178gLu,178mLu,179m2Hf,177m+gYb,180mHf and 92mNb were determined by a well-calibrated GEM-60P coaxial HPGe detector (whose crystal diameter and crystal length are 70.1 mm and 72.3 mm, respectively) with a relative efficiency of ∼68% and an energy resolution of 1.69 keV at 1.332 MeV. Each hafnium sample is measured twice at a distance of 90 mm from the detector cap, the time of each measurement is about 110–760 min. The efficiency of the detector was pre-calibrated using various standard γ sources. Figures 1 and 2 show a part of γ-ray spectrum acquired from the hafnium samples about 5 min and 491 min after the end of irradiation, respectively.

Figure 1. Part of γ-ray spectrum of hafnium about 5 min after the end of irradiation.
Download figure:
Standard image High-resolution image
Figure 2. Part of γ-ray spectrum of hafnium about 491 min after the end of irradiation.
Download figure:
Standard image High-resolution imageThese reactions and the relevant radioactive decay properties of the reaction products and the natural abundance of the target isotopes in the present investigation are presented in table 1. Most of this information is derived from NuDat 2.7 [31], but the abundance of 93Nb comes from [32] because no abundance of 93Nb is given in NuDat 2.7. The two intensities of characteristic gamma-ray of 175m+gYb come from NuDat 2.7 and [32], respectively. The intensity given in NuDat 2.7 is about twice that given in [32]. The half-life, energy and intensity of the characteristic gamma-ray of 178mLu come from [32] because there's nothing about them given in NuDat 2.7.
Table 1. Reactions and the relevant radioactive decay properties of activation products involved in the present investigation.
| Reaction | Abundance of target isotope (%) | Activation products | T1/2 | Eγ (keV) | Iγ (%) |
|---|---|---|---|---|---|
| 174Hf(n, 2n) | 0.16 | 173Hf | 23.6 h | 311.239 | 10.7 |
| 176Hf(n, 2n) | 5.26 | 175Hf | 70 d | 343.40 | 84 |
| 178Hf(n, α) | 27.28 | 175m+gYb | 4.185 d | 396.329 | 13.2 (6.4a) |
| 178Hf(n, p) | 27.28 | 178gLu | 28.4 min | 1340.8 | 3.4 |
| 178Hf(n, p) | 27.28 | 178mLu | 23.1 mina | 426.36a | 97.02a |
| 180Hf(n, 2n) | 35.08 | 179m2Hf | 25.05 d | 453.59 | 68 |
| 180Hf(n, α) | 35.08 | 177m+gYb | 1.911 h | 1080.5 | 5.9 |
| 180Hf(n, n') | 35.08 | 180mHf | 5.53 h | 332.274 | 94 |
| 93Nb(n, 2n) | 100a | 92mNb | 10.15 d | 934.44 | 99.15 |
aThese values given in [32].
3. Experimental results and their uncertainties
3.1. Experimental cross section values
The measured cross sections were calculated by the following formula [33]:

where σ0 is the monitor reaction cross-section value, the subscript 0 represents the term corresponding to the monitor reaction and the subscript x corresponds to the measured reaction, ε is the full-energy peak (FEP) efficiency of the measured characteristic γ-ray, Iγ is the γ-ray intensity, η is the abundance of the target nuclide, M is the mass of sample,  is the counting collection factor, t1 and t2 are the time intervals from the end of the irradiation to the start and the end of counting, respectively, A is the atomic weight, C is the measured FEP area, λ is the decay constant, F is the total correction factor of the activity:

where fs, fc and fg are correction factors for the self-absorption of the sample at a given γ-energy, the coincidence sum effect of cascade γ-rays of the investigated nuclide and in the counting geometry, respectively. fc was calculated by the method of [34]. fs and fg were calculated by the following equations:


where μm (in cm2 g−1) is the mass attenuation coefficient at each gamma energy, dm (in g cm−2) is the areal density, d (in mm) is the thickness of the sample and h (in mm) is the distance from the surface of sample to the effective detection cross section of the crystal in the HPGe detector.
K is the neutron fluctuation factor:
where L is the number of time intervals into which the irradiation time is divided, Δti is the duration of the ith time intervals, Ti is the time interval from the end of the ith interval to the end of irradiation, Φi is the neutron flux averaged over the sample during Δti, Φ is the neutron flux averaged over the sample during the total irradiation time T and  is the growth factor of product nuclide.
The cross-section values of the 174Hf(n, 2n)173Hf, 176Hf(n, 2n)175Hf, 178Hf(n, α)175m+gYb, 178Hf(n, p)178gLu, 178Hf(n, p)178mLu, 180Hf(n, 2n)179m2Hf, 180Hf(n, α)177m+gYb and 180Hf(n, n')180mHf reactions were obtained relative to those of the monitor reaction 93Nb(n, 2n)92mNb which were 457.9 ± 6.8, 459.8 ± 6.8, 459.8 ± 6.8 and 459.7 ± 5.0 mb at the neutron energies of 13.5, 14.1, 14.4 and 14.8 MeV, respectively [35]. The measured cross sections are presented in table 2 and plotted in figures 3–10. The previous cross section measurements of these nuclear reactions around the neutron energy of 14 MeV are also summed up in table 2 and plotted in figures 3–10 for comparison. The evaluation cross-section curves of these reactions mentioned above from ENDF/B-VIII.0, CENDL-3.1 and JEFF-3.3 and the theoretical calculation curves in the neutron energy range from the threshold to 20 MeV by using the computer code system TALYS-1.9 with the default values of parameters are also plotted in figures 3–10 for comparison.
Table 2. Summary of the cross-sections of hafnium isotopes around the neutron energy of 14 MeV.
| This work | Literature Values | ||||
|---|---|---|---|---|---|
| Reaction | En(MeV) | σ(mb) | En(MeV) | σ(mb) | References |
| 174Hf(n, 2n)173Hf | 13.5 ± 0.2 | 2018 ± 83 | 14.7 | 1834 ± 100 | [2] |
| 14.1 ± 0.2 | 2053 ± 87 | 15.4 | 2750 ± 180 | [3] | |
| 14.4 ± 0.2 | 2024 ± 83 | 14.5 | 860 ± 60 | [4] | |
| 14.8 ± 0.2 | 2091 ± 88 | 14.2 | 1968 ± 148 | [12] | |
| 14.7 | 1886 ± 145 | [13] | |||
| 176Hf(n, 2n)175Hf | 13.5 ± 0.2 | 2020 ± 83 | 14.7 | 2090 ± 100 | [2] |
| 14.1 ± 0.2 | 2061 ± 87 | 15.4 | 1770 ± 60 | [3] | |
| 14.4 ± 0.2 | 1994 ± 80 | 14.5 | 2000 ± 100 | [4] | |
| 14.8 ± 0.2 | 2070 ± 85 | 13.40 | 2106 ± 84 | [5] | |
| 13.67 | 2089 ± 84 | [5] | |||
| 14.06 | 2093 ± 84 | [5] | |||
| 14.45 | 2122 ± 85 | [5] | |||
| 14.69 | 2137 ± 85 | [5] | |||
| 14.80 | 2130 ± 85 | [5] | |||
| 14.30 | 1990 ± 100 | [6] | |||
| 14.70 | 2050 ± 100 | [6] | |||
| 14.20 | 2081 ± 108 | [7] | |||
| 14.70 | 2166 ± 112 | [7] | |||
| 18. 00 | 1730 ± 173 | [7] | |||
| 14.70 | 1915 ± 151 | [8] | |||
| 14.7 | 2076 ± 150 | [9] | |||
| 14.2 | 2124 ± 128 | [10] | |||
| 14.7 | 2220 ± 115 | [11] | |||
| 178Hf(n, α)175m+gYb | 13.5 ± 0.2 | 0.74 ± 0.07a (1.52 ± 0.15)b | 14.7 | 1.7 ± 0.2 | [2] |
| 14.1 ± 0.2 | 0.95 ± 0.09a (1.95 ± 0.17)b | 13.36 | 1.68 ± 0.42 | [14] | |
| 14.4 ± 0.2 | 1.16 ± 0.11a (2.39 ± 0.23)b | 13.99 | 2.34 ± 0.61 | [14] | |
| 14.8 ± 0.2 | 1.36 ± 0.11a (2.80 ± 0.22)b | 14.69 | 3.04 ± 0.75 | [14] | |
| 14.96 | 3.57 ± 0.88 | [14] | |||
| 14.7 | 1.6 ± 0.3 | [15] | |||
| 14.5 | 2 ± 0.2 | [16] | |||
| 178Hf(n, p)178mLu | 13.5 ± 0.2 | 1.15 ± 0.09 | 14.54 | 1.8 ± 0.4 | [17] |
| 14.1 ± 0.2 | 1.57 ± 0.11 | 14.8 | 1.72 ± 0.17 | [18] | |
| 14.8 ± 0.2 | 2.08 ± 0.11 | ||||
| 178Hf(n, p)178gLu | 13.5 ± 0.2 | 0.31 ± 0.02 | 14.54 | 0.98 ± 0.08 | [17] |
| 14.1 ± 0.2 | 0.42 ± 0.02 | 14.8 | 1.02 ± 0.10 | [18] | |
| 14.8 ± 0.2 | 0.63 ± 0.03 | 13.4 | 0.21 ± 0.12 | [19] | |
| 13.65 | 0.21 ± 0.13 | [19] | |||
| 13.88 | 0.37 ± 0.12 | [19] | |||
| 14.28 | 0.44 ± 0.20 | [19] | |||
| 14.58 | 0.61 ± 0.15 | [19] | |||
| 14.87 | 0.63 ± 0.16 | [19] | |||
| 180Hf(n, 2n)179m2Hf | 13.5 ± 0.2 | 14.22 ± 0.59c (17.06 ± 0.70)d | 15.4 | 16.7 ± 1.9 | [3] |
| 14.1 ± 0.2 | 16.56 ± 0.70c (19.62 ± 0.83)d | 14.7 | 21.8 ± 1.9 | [8] | |
| 14.4 ± 0.2 | 18.49 ± 0.76c (21.70 ± 0.89)d | 13.35 | 13.5 ± 1.2 | [14] | |
| 14.8 ± 0.2 | 20.18 ± 0.85c (23.72 ± 1.00)d | 13.99 | 17.6 ± 1.5 | [14] | |
| 14.68 | 22.8 ± 2.0 | [14] | |||
| 14.95 | 24.2 ± 2.1 | [14] | |||
| 14.77 | 25.1 ± 0.5 | [20] | |||
| 180Hf(n, α)177m+gYb | 13.5 ± 0.2 | 0.42 ± 0.03 | 14.7 | 0.9 ± 0.2 | [2] |
| 14.1 ± 0.2 | 0.53 ± 0.03 | 14.5 | 2.2 ± 0.2 | [4] | |
| 14.4 ± 0.2 | 0.78 ± 0.07 | 14.43 | 0.9 ± 0.54 | [14] | |
| 14.8 ± 0.2 | 0.78 ± 0.04 | 14.67 | 0.9 ± 0.53 | [14] | |
| 14.94 | 0.95 ± 0.55 | [14] | |||
| 14.7 | 0.8 ± 0.15 | [15] | |||
| 180Hf(n, n') 180mHf | 13.5 ± 0.2 | 13.97 ± 0.57 | 14.5 | 12.4 ± 0. 5 | [4] |
| 14.1 ± 0.2 | 13.69 ± 0.57 | 13.32 | 13.27 ± 0.74 | [14] | |
| 14.4 ± 0.2 | 13.46 ± 0.54 | 13.56 | 13.03 ± 0.72 | [14] | |
| 14.8 ± 0.2 | 14.44 ± 0.60 | 13.98 | 12.1 ± 0.67 | [14] | |
| 14.42 | 11.97 ± 0.66 | [14] | |||
| 14.66 | 11.72 ± 0.65 | [14] | |||
| 14.92 | 11.65 ± 0.65 | [14] | |||
aThese are the results based on the intensity of characteristic gamma-ray of 175m+gYb given in [31]. bThese are the results based on the intensity of characteristic gamma-ray of 175m+gYb given in [32]. cThese are the results which subtracted the contribution of the 179Hf(n, n')179m2Hf reaction with the data obtained by fitting the experimental values of Konno et al [14]. dThese are the results which subtracted the contribution of the 179Hf(n, n')179m2Hf reaction with the data obtained by fitting the experimental values of Konno et al [14].
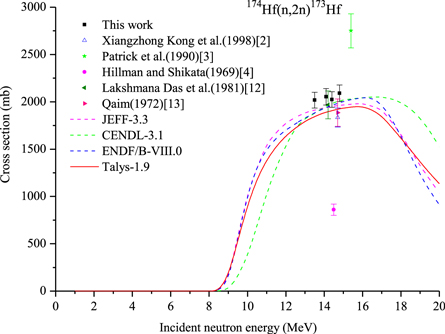
Figure 3. Cross section of the 174Hf(n, 2n)173Hf reaction.
Download figure:
Standard image High-resolution imageThe complete description of Talys can be found in the Talys-1.9 manual [25]. Talys is a computer code system for the analysis and prediction of nuclear reactions based on physics models and parameterizations. It is a versatile tool for the analyses of basic microscopic scientific experiments or to generate nuclear data for applications. It can simulate nuclear reactions involving neutrons, photons, protons, deuterons, tritons, 3He, and α-particles in the 0.001–200 MeV energy range and for target nuclides of mass of 12 and heavier [25]. To deal with the neutron induced nuclear reactions, we use the optical model. All optical model calculations are performed by ECIS-06 [36] which is implanted as a subroutine in Talys.
Since natural hafnium samples were used in the experiment, more than one reaction may lead to the same product nucleus. For example, for the 176Hf(n, 2n)175Hf reaction, the cross-section values measured in this work contained the contribution of the 174Hf(n, γ)175Hf reaction around the neutron energies of 13.5–14.8 MeV, and also contained that of the 177Hf(n, 3n)175Hf reaction at the neutron energy of 14.8 MeV which is above this reaction threshold (14.63 MeV). However, the contribution of the 174Hf(n, γ)175Hf reaction can be neglected because its cross-section value is quite small (μb) around the neutron energy of 14 MeV, and the samples were wrapped in pure cadmium foil during the irradiation and the influence of the 174Hf(n, γ)175Hf reaction induced by thermal neutron was reduced to a low level (negligible). At the same time, the contribution of the 177Hf(n, 3n)175Hf reaction at the neutron energy of 14.8 MeV can also be neglected because its cross-section value is also small (mb) compared to that of the 176Hf(n, 2n)175Hf reaction (103 mb).
For the 178Hf(n, α)175m+gYb reaction, two sets of cross-section values in this work were calculated by using two intensities of characteristic gamma-ray of 175m+gYb from NuDat 2.7 and [32] for comparison. In table 2, two sets of cross-section values are marked with the superscripts a and b, respectively. The previous cross section measurements in [2, 14, 15] are the results based on an intensity that is approximately the same as the intensity given in [32] and is about half that gamma-ray intensity from NuDat 2.7 [31]. In addition, the cross-section values measured in this work contained the contribution of the 179Hf(n, n'α)175m+gYb reaction around the neutron energies of 13.5–14.8 MeV. However, the contribution of the 179Hf(n, n'α)175m+gYb reaction can be neglected because its cross-section value is quite small (10–2 mb) around the neutron energy of 14 MeV.
The product 178gLu came from the 178Hf(n,p)178gLu, 179Hf(n, d*)178gLu [(n, d*) = (n, d) + (n, n + p)] and 180Hf(n, t)178gLu reactions. So the cross-section values of the 178Hf(n, p)178gLu reaction were calculated according to the first reaction in this work , we subtracted the contributions of the 179Hf(n, d*)178gLu and 180Hf(n, t)178gLu reactions by using their evaluated values from CENDL-3.1.
The cross-section values of the 178Hf(n, p)178mLu reaction are actually those of the 178Hf(n, p)178mLu + 179Hf(n, d*)178mLu + 180Hf(n, t)178mLu reactions which were computed by using the target isotope abundance of the first mentioned isotope and equation (1). For the 179Hf(n, d*)178mLu and 180Hf(n, t)178mLu reactions, since there is no corresponding evaluation cross-section value in the evaluation database of IAEA [21] and no corresponding experimental value in experimental nuclear reaction data [1], their contribution cannot be deducted.
The ground state of 179Hf is stable so its direct formation by the (n, 2n), (n, n') and (n, γ) reactions is not measurable by activation methods. 179Hf has two isomers of 179m1Hf and 179m2Hf. The first isomer 179m1Hf has a very short life whose corresponding reaction cross-section values were not measured. The second isomer 179m2Hf decays to the ground state, bypassing 179m1Hf. Consequently, the cross-section values of the 180Hf(n, 2n)179m2Hf reaction were measured. The second isomer 179m2Hf came from the 180Hf(n, 2n)179m2Hf, 179Hf(n, n')179m2Hf, 178Hf(n, γ)179m2Hf reactions. The contribution of the 178Hf(n, γ)179m2Hf reaction can be neglected because its cross-section value is tiny (μb) around the neutron energy of 14 MeV, and the samples were wrapped in pure cadmium foil during the irradiation and the contribution of the 178Hf(n, γ)179m2Hf reaction induced by thermal neutron was reduced to a low level. Since there is no evaluation cross-section values of the 179Hf(n, n')179m2Hf reaction in the evaluation database of IAEA, in the calculation process of the cross-section values of the 180Hf(n, 2n)179m2Hf reaction, we subtracted the contributions of the 179Hf(n, n')179m2Hf reaction by using the data obtained by fitting the experimental values of Konno et al [14] and neglected the contribution of the 178Hf(n, γ)179m2Hf reaction. The values are marked with the superscript c in table 2. The cross-section values of the 180Hf(n, 2n)179m2Hf + 179Hf(n, n')179m2Hf + 178Hf(n, γ)179m2Hf reactions which are marked with the superscript d in table 2 were also calculated by using the target isotope abundance of the first mentioned isotope and equation (1) for comparison. From table 2 we see that the contribution of the 179Hf(n, n')179m2Hf reaction cannot be neglected because the abundances of 179Hf and 180Hf are comparable and the cross-section values are also comparable between the 179Hf(n, n')179m2Hf and 180Hf(n, 2n)179m2Hf reactions around the neutron energy of 14 MeV.
For the 180Hf(n, n')180mHf reaction, although the measured cross-section values in this work contained the contribution of the 179Hf(n, γ)180mHf reaction, its contribution can be neglected because its cross-section value is tiny (10–1 mb) around the neutron energy of 14 MeV, and the samples were wrapped in pure cadmium foil during the irradiation and the contribution of the 179Hf(n, γ)180mHf reaction induced by thermal neutron was reduced to a low level (negligible).
3.2. Experimental uncertainties
The main uncertainties in present work come from the counting statistics (0.2%–8.5%), the standard cross sections uncertainties (1.1%–1.5%), detector efficiency (2%), the weight of samples (0.1%), the sample geometry (1%), the self-absorption of γ-ray (1.0%), and the fluctuation of the neutron flux (1%), etc. In addition, some other uncertainty contributions from the parameters of these measured nuclei and the standard nucleus, such as uncertainties of the abundance of target isotope, uncertainties of the half-life of the radioactive product nuclei , all are considered.
4. Discussion
4.1. 174Hf(n, 2n)173Hf reaction
We can see from table 2 and figure 3 that the trends of these evaluation excitation curves of JEFF-3.3, CENDL-3.1, ENDF/B-VIII.0 are basically the same as the theoretical excitation curve by using the computer code system Talys-1.9 and the trend of our experimental results around the neutron energy of 14 MeV, which are increase with the increasing neutron energy around 14 MeV, but there are slight differences between them. The fitting line of our experimental results is slightly higher than the three evaluation excitation curves and the theoretical excitation curve around the neutron energy of 14 MeV, whereas at the neutron energy of 14.4 MeV, our result, within experimental error, is consistent with those of the three evaluation excitation curves at the same energy, and at the neutron energy of 14.8 MeV the measured cross-section value in this work is also consistent, within experimental error, with that of the evaluation excitation curves of CENDL-3.1 at the corresponding energy. In addition, the values of the fitting line of our experimental results at the corresponding energies, within experimental error, are consistent with those of Lakshmana Das et al [12] and Qaim [13]. The cross-section value of Patrick et al [3] is much higher than those of the three evaluation excitation curves and the theoretical excitation curve at the same energy, and the result of Hillman and Shikata [4] is much lower than those of the three evaluation excitation curves, the theoretical excitation curve and ours at the corresponding energy.
4.2. 176Hf(n,2n)175H reaction
So far ten laboratories have reported their cross-section data, whose experimental cross-section data are most in experimental nuclear reaction data database on hafnium isotopes around the neutron energy of 14 MeV mentioned above. This provides a good basis for verifying the reliability of the experimental results and the correctness of theoretically calculated model used. We can see from table 2 and figure 4 that the shapes and trends of excitation curves of JEFF-3.3, CENDL-3.1, ENDF/B-VIII.0 are basically the same as those of the theoretical excitation curve by using the computer code system Talys-1.9 in the neutron energies from the threshold to 20 MeV with slight differences between them. Our experimental values, within experimental error, are consistent with those of the three evaluation excitation curves and the theoretical excitation curve at the corresponding energies. In addition, the cross-section values of Chuanxin Zhu et al [5] are slightly higher than ours (whose possible reason is that the cross-section values contained the contribution of the 174Hf(n, γ)175Hf reaction because the samples were not wrapped in cadmium foil during the irradiation), but they are consistent at the corresponding energies within the experimental error. The cross-section values of Kiraly et al [6] at the neutron energies 14.3 and 14.7 MeV and the cross-section values of Hanlin Lu et al [7] at the neutron energies 14.2 and 14.7 MeV, within experimental error, are consistent with those of the fitting line of our experimental results at the corresponding energies. The cross-section values of Hillman and Shikata [4], Meadows et al [8], Qaim [9], Lakshmana Das et al [10] and Dilg et al [11], within experimental error, are also consistent with those of the fitting line of our experimental results at the corresponding energies. Whereas the cross-section value of Patrick et al [3] is significantly lower than that of the three evaluation excitation curves and the theoretical excitation curve at the corresponding energy. The above facts show that our experimental results are reliable and the theoretically calculated model used to the Talys-1.9 code is suitable for the 76Hf(n, 2n)175Hf reaction around the neutron energy of 14 MeV.

Figure 4. Cross section of the 176Hf(n, 2n)175Hf reaction.
Download figure:
Standard image High-resolution image4.3. 178Hf(n, α)175m+gYb reaction
We can see from table 2 and figure 5 that there are very great differences in the three evaluation excitation curves and the theoretical excitation curve because the experimental data are few and there are differences between them. The trend of the experimental results marked with the superscript b, within experimental error, is consistent with that of Konno et al [14] around the neutron energy of 14 MeV. The value of Coleman et al [16] at 14.5 MeV neutron energy is in agreement, within experimental error, with that of the fitting line of our experimental values marked with the superscript b at the same energy. Whereas the fitting line of our experimental values marked with the superscript a is between the three evaluation excitation curves and the theoretical excitation curve, and close to the theoretical excitation curve. The value of the fitting line of our experimental values at 14.7 MeV neutron energy, within experimental error, is consistent with that of Qaim [15].
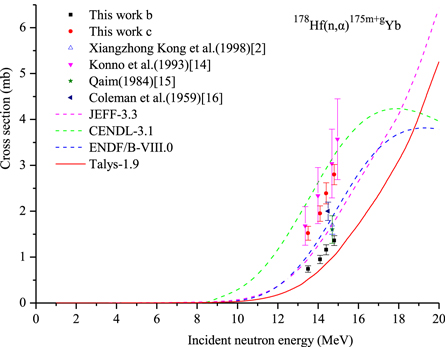
Figure 5. Cross section of the 178Hf(n, α)175m+gYb reaction.
Download figure:
Standard image High-resolution image4.4. 178Hf(n,p)178gLu reaction
We can see from table 2 and figure 6 that there are very great differences in the three evaluation excitation curves and the theoretical excitation curve. The fitting line of our experimental values, within experimental error, is consistent with the evaluation excitation curve of JEFF-3.3 around the neutron energy of 14 MeV, and the values of the fitting line of our experimental values at the corresponding energies, within experimental error, are consistent with those of Kirov et al [17] and Meason et al [18].

Figure 6. Cross section of the 178Hf(n, p)178gLu reaction.
Download figure:
Standard image High-resolution image4.5. 178Hf(n, p)178mLu reaction
There is no evaluation cross-section values in the evaluation database of IAEA for the 178Hf(n, p)178mLu reaction. We can see from table 2 and figure 7 that the fitting line of our experimental values, within experimental error, is consistent with the fitting line of Murahira et al [19] around the neutron energy of 14 MeV, which is much lower than the theoretical excitation curve. The values of Kirov et al [17] and Meason et al [18] , within experimental error, are consistent with those of the theoretical excitation curve at the corresponding energies, which are much higher than the values of the fitting line of our experimental values at the corresponding energies.
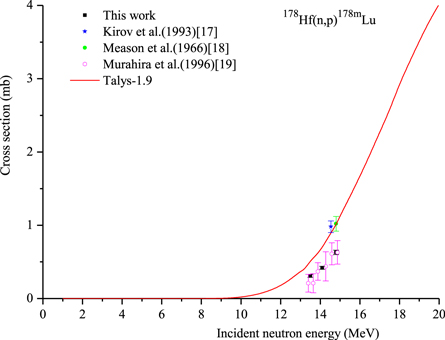
Figure 7. Cross section of the 178Hf(n, p)178mLu reaction.
Download figure:
Standard image High-resolution image4.6. 180Hf(n, 2n)179m2Hf reaction
There is no evaluation cross-section values in the evaluation database of IAEA. We can see from table 2 and figure 8 that the theoretical excitation curve much higher than that of Konno et al [14] and ours around the neutron energy of 14 MeV, whereas the fitting line of our experimental values marked with the superscript c is slightly lower than that of Konno et al [14] around the neutron energy of 14 MeV, but they are consistent within experimental error, and the fitting line of our experimental values marked with the superscript d is slightly higher than that of Konno et al [14], but they are also basically consistent within experimental error. The value of Patrick et al [3] is significantly lower than the other experimental and theoretical values. The value of Meadows et al [8] at 14.7 MeV neutron energy is in agreement, within experimental error, with that of our two experimental excitation curves at the same energy. Whereas the value of Weixiang Yu et al [20] at 14.77 MeV neutron energy is in agreement, within experimental error, with that of the fitting line of our experimental values marked with the superscript d at the same energy.
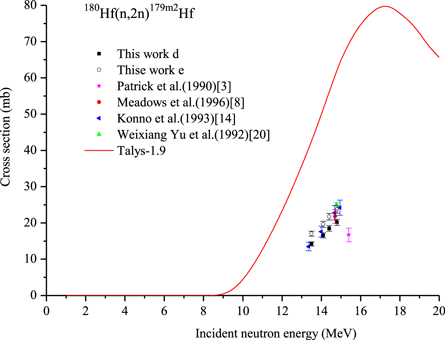
Figure 8. Cross section of the180Hf(n, 2n)179m2Hf reaction.
Download figure:
Standard image High-resolution image4.7. 180Hf(n, α)177m+gYb reaction
We can see from table 2 and figure 9 that there are very great differences in the three evaluation excitation curves and the theoretical excitation curve because the experimental data are few and there are differences between them. The fitting line of our experimental values, within experimental error, is consistent with that of Konno et al [14] and with the evaluation curve of ENDF/B-VIII.0 around the neutron energy of 14 MeV. The values of the fitting line of our experimental results at the corresponding energies, within experimental error, are consistent with those of Xiangzhong Kong et al [2] and Qaim [15]. Whereas the value of Hillman and Shikata [4] is significantly higher than the other experimental and theoretical values.
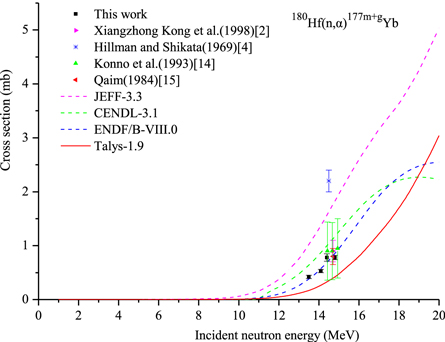
Figure 9. Cross section of the 180Hf(n, α)177m+gYb reaction.
Download figure:
Standard image High-resolution image4.8. 180Hf(n, n')180mHf reaction
There is no evaluation cross-section values in the evaluation database of IAEA. We can see from table 2 and figure 10 that the theoretical values are much higher than all experimental values around the neutron energy of 14 MeV. Our experimental value at 13.5 MeV neutron energy, within experimental error, is consistent with that of the excitation curve of Konno et al [14] at the corresponding energy. Whereas the value of Hillman and Shikata [4] at 13.5 MeV neutron energy, within experimental error, is consistent with that of the fitting line of our experimental results at the corresponding energy.

Figure 10. Cross section of the 180Hf(n, n')180mHf reaction.
Download figure:
Standard image High-resolution image
5. Conclusions
The activation cross sections for the 174Hf(n, 2n)173Hf, 176Hf(n, 2n)175Hf, 178Hf(n, α)175m+gYb, 178Hf(n, p)178gLu, 178Hf(n, p)178mLu, 180Hf(n, 2n)179m2Hf, 180Hf(n, α)177m+gYb and 180Hf(n, n')180mHf reactions on hafnium isotopes induced by 13.5–14.8 MeV neutrons have been measured. These measured cross sections were discussed and compared with the literature data and with the evaluation data from ENDF/B-VIII.0, CENDL-3.1, JEFF-3.3 and the theoretical results by using the computer code system Talys-1.9. In general, our measured results around the neutron energy of 14 MeV agree with some previous experimental values from the literature within experimental error, but some discrepancies are observed among the literature values which might be attributed to variations in experimental methods, equipments, datum processing methods and the nuclear parameters used. The fact shows that our experimental results are reliable around the neutron energy of 14 MeV. The theoretical calculations using the computer code system Talys-1.9 showed that the reaction cross section of a particular channel under consideration is reproduced fairly well around the neutron energy of 14 MeV by using the default values of parameters. This shows that the theoretically calculated model is suitable for the reaction cross section of a particular channel around the neutron energy of 14 MeV. In conclusion, our measured data would improve the quality of the neutron cross section database and are expected to help with new evaluations of cross sections on hafnium isotopes around the neutron energy of 14 MeV. In addition, our measured cross sections provide important data support for verifying the accuracy of nuclear models used in the calculation of cross sections and for the design, evaluation and construction of fusion reactors, and other related nuclear engineering calculations. It should be mentioned that the experimental cross-section values for the 178Hf(n, p)178gLu and 180Hf(n, α)177m+gYb reactions at the neutron energies of 13.5 and 14.1 MeV, and for the 174Hf(n, 2n)173Hf reaction at 13.5 MeV neutron energy are first reported here.
Acknowledgments
We thank the crew of the K-400 Neutron Generator at Institute of Nuclear Physics and Chemistry China Academy of Engineering Physics for performing irradiation work. This work was supported by the National Natural Science Foundation of China Grant Nos. 11575090 and 11605099.