


Abstract
The NASA Double Asteroid Redirection Test (DART) has demonstrated the capability of successfully conducting kinetic impact-based asteroid deflection missions. The changes in the Didymos–Dimorphos mutual orbit as a result of the DART impact have already been measured. To fully assess the heliocentric outcome of deflection missions, the heliocentric momentum enhancement parameter, β⊙, needs to be determined and disentangled from other nongravitational phenomena such as the Yarkovsky effect. Here we explore the measurability of β⊙ resulting from DART, which we estimate simultaneously with nongravitational accelerations using a least-squares filter. Results show that successful stellar occultation measurements of the Didymos system in the second half of 2024 in addition to the ones in the 2022–2023 campaigns can achieve a statistically significant estimate of β⊙, with an uncertainty slightly above 20% for an assumed β⊙ = 3. Adding additional occultation measurements and pseudorange measurements from the Hera spacecraft operations at Didymos starting in 2027 decreases this relative uncertainty to under 6%. We find that pre-impact occultation observations combined with post-impact occultations would have yielded substantially higher signal-to-noise ratios on the heliocentric deflection. Additionally, pre-impact occultations would also have enabled a statistically significant β⊙ estimate using only one additional occultation in 2023 September. Therefore, we conclude that future asteroid deflection missions would greatly benefit from both pre- and post-deflection occultation measurements to help assess the resulting orbital changes.
Export citation and abstract BibTeX RIS

Original content from this work may be used under the terms of the Creative Commons Attribution 4.0 licence. Any further distribution of this work must maintain attribution to the author(s) and the title of the work, journal citation and DOI.
1. Introduction
NASA's Double Asteroid Redirection Test (DART; Rivkin et al. 2021) mission successfully changed the mutual orbit of Dimorphos, the secondary asteroid in the (65803) Didymos binary asteroid system, around Didymos on 2022 September 26. The change in Dimorphos's orbital period using observations from the first few weeks after impact was estimated to be −33 ± 0.3 minutes (Thomas et al. 2023). DART was the world's first full-scale planetary defense technology demonstration mission, and it successfully showed that the trajectory of a sub-kilometer-sized asteroid can be altered through a kinetic impactor (KI). Deflecting near-Earth objects (NEOs) using a KI involves a hypervelocity collision between the spacecraft and the target (Ahrens & Harris 1994). The idea is that, given sufficient lead time, even a small deflection can push a potentially hazardous object out of Earth's path.
A characteristic feature of the KI method is that materials from the surface of the target asteroid, such as fine particles and pebbles, get kicked off in significantly complex ways. For DART, even boulders were kicked off the surface of the asteroid as a result of the impact (Jewitt et al. 2023). A fraction of the particles in this ejecta cloud possess enough momentum to escape the gravitational influence of the target body. The escaping ejecta impart additional momentum onto the target. Therefore, the overall deflection of the body is a result of the combined momenta delivered by the spacecraft and this escaping ejecta. This entire exchange is characterized by the momentum enhancement parameter, β (Holsapple & Housen 2012). More specifically, β is the ratio of the momentum imparted to the target asteroid to the momentum of the impactor at the time of impact.
In the case of a binary system like Didymos, there are two β values to be considered: a local Dimorphos β that includes all ejecta that escape Dimorphos's gravitational pull (determined to be between 2.2 and 4.9 by Cheng et al. 2023), and a heliocentric system momentum enhancement parameter, β⊙ caused by the ejecta that escape the Didymos binary system's gravitational influence. ESA's Hera mission will visit the Didymos system to study the consequences of the DART experiment in detail, which will help constrain the mass of Dimorphos, the shape of the crater caused by DART, and consequently the momentum enhancement parameters (Michel et al. 2022). For a more comprehensive discussion of how this information will aid in further understanding of the mutual orbit dynamics of the binary system, the reader is referred to Richardson et al. (2022, 2024).
Makadia et al. (2022) used statistical estimates of β⊙ to determine that the DART impact would not put the Didymos system on a collision course with Earth. Given the importance of β⊙ in both planning and deflection assessment of future KI missions, we set out to investigate whether the current observation data are sufficient to effectively estimate the heliocentric momentum enhancement factor from classical astrometry, derived astrometry (from stellar occultations), and pseudorange measurements of the target asteroid. If not, we explore observation scenarios that allow a statistically significant estimate of β⊙.
More specifically, we explore the measurability of the heliocentric momentum enhancement caused by the DART impact. The β⊙ value for kinetic impact-based planetary defense missions can be estimated as part of a least-squares orbit determination filter. This allows β⊙ to be computed alongside the target body's state and other relevant orbital parameters such as the A2 transverse nongravitational acceleration due to the Yarkovsky effect as defined in Marsden et al. (1973). To reliably estimate β⊙, one needs to separate its contribution from that of the Yarkovsky effect, which can introduce a semimajor-axis drift on the order of hundreds of meters per year (Farnocchia et al. 2013; Del Vignaet al. 2018; Greenberg et al. 2020; Dziadura et al. 2022). At the same time, the β⊙ from the DART impact causes a near-instantaneous change in semimajor axis. Therefore, A2 and β⊙ are highly correlated, and isolating the signal for both parameters is a challenge when it comes to estimating them.
Section 2 presents the methods used to understand the measurability of the heliocentric momentum enhancement, including the setup of the least-squares estimator and the treatment of astrometric data. This section also describes how we validated the orbit propagator and orbit filter used to generate the results in this work. In Section 3 we present our results on measuring β⊙ for DART using the current observation data, as well as simulated future observations. Those are based on various observation scenarios that allow the β⊙ value of the DART impact to be determined. This section also discusses the correlation between the A2 Yarkovsky effect parameter and β⊙. Following this, Section 4 discusses observation scenarios that would enable a solid β⊙ estimate in future kinetic impact-based planetary defense missions. Finally, Section 5 summarizes our results and provides the key points we would like the reader to take away from this work.
2. Methods
If we assume that a kinetic impact causes a (near) instantaneous change in the momentum vector of an asteroid, then β⊙ is defined as

where Δ p is the vector change in momentum of the asteroid, β⊙ is once more the heliocentric momentum enhancement parameter, and p DART is the relative momentum vector of the impactor spacecraft with respect to the target asteroid. This equation assumes that the escaping ejecta momentum travels in the opposite direction as the impactor momentum relative to the target asteroid. The change in the momentum of the asteroid can be interpreted as a discontinuity separating the pre-impact orbit from a new post-impact orbit. Both pre- and post-impact orbits of the target body have uncertainties that can overwhelm the deflection signal for some time. This leads to an inability of getting a statistically significant estimate for β⊙, as shown in the results presented in Section 3.1.
Figure 1 shows a schematic diagram of the nominal pre- and post-impact orbits of the Didymos system and the corresponding uncertainties. Once the impact happens, the heliocentric orbit of the target body is altered. New observations following the impact then track this new orbit and reduce its uncertainties. Given enough time post-impact and a sufficient number of high-quality observations, the two orbits become distinctly separate if the uncertainties are small enough. The change between the pre- and post-impact orbits is the result of the heliocentric momentum change of the system, the magnitude of which is parameterized by β⊙.

Figure 1. Illustration of pre- and post-DART orbits and their associated uncertainties for the Didymos system.
Download figure:
Standard image High-resolution imageA full three-dimensional formulation of the momentum enhancement parameter is discussed in Statler et al. (2022). As mentioned earlier, Equation (1) assumes that the escaping ejecta momentum travels in the opposite direction to the impactor momentum relative to the target asteroid. High-fidelity ejecta dynamics models can instead be used to determine the direction of this ejecta momentum. We will focus on finding the magnitude of β⊙ first and discuss determining the direction of the net escaping ejecta momentum vector in Section 2.3.
Since the heliocentric momentum change can also be thought of as an impulsive ΔV to the system, β⊙ can be directly estimated via differential correction, an iterative orbit determination process that makes use of least-squares fitting of trajectories to observations to determine free parameters. Setting β⊙ as a solve-for parameter as opposed to a calculated quantity allows us to directly understand its dependencies on the other estimated parameters and allows us to easily add or remove directional constraints on the total impulse delivered by the KI spacecraft.
2.1. GRSS Least-squares Filter
This article presents the Gauss–Radau Small-body Simulator (grss), 11 an open-source small-body orbit propagation and orbit determination tool. The orbit determination algorithm in the grss library is based on the least-squares filter, the algorithm for which comes from Vallado (2022). The goal of a least-squares filter is to minimize the cost function,

where J is the cost and b is the N-dimensional vector of residuals of each observation. The ith element of this vector is

O is the vector of observables, C is the vector of computed observations, and W is the N × N weight matrix. The observation data used in grss come from two sources: (1) optical astrometry from the International Astronomical Union's Minor Planet Center (MPC), 12 and (2) radar astrometry from the JPL Small-Body Radar page. 13 Additional measurements, such as stellar occultations and spacecraft measurements, can be ingested using the MPC's ADES format. 14
The computed measurements are acquired by propagating an initial Npar-dimensional vector of solve-for parameters (where Npar is the number of fitted parameters), X 0 consisting of the cometary orbital elements (Milani & Gronchi 2009), any nongravitational parameters according to the Farnocchia et al. (2013) transverse acceleration model, and, in our case, β⊙ to the epoch of each observation. This initial guess is updated through a process called differential corrections. The correction at every iteration is calculated using the equation

where  is the covariance matrix of the solution and
A
is the gradient of the observations with respect to the solve-for parameters. grss calculates this gradient using first-order central differences. This corrected state (calculated as
X
0
+ Δ
X
) is computed until the change in nominal solution is within a prescribed tolerance. The solution is said to have converged at that point. This classical process of nonlinear weighted least-squares estimation can be traced back to the work of C. F. Gauss (Gauss 1809).
is the covariance matrix of the solution and
A
is the gradient of the observations with respect to the solve-for parameters. grss calculates this gradient using first-order central differences. This corrected state (calculated as
X
0
+ Δ
X
) is computed until the change in nominal solution is within a prescribed tolerance. The solution is said to have converged at that point. This classical process of nonlinear weighted least-squares estimation can be traced back to the work of C. F. Gauss (Gauss 1809).
The grss library uses the ias15 algorithm, which is a 15th-order integrator based on Gauss–Radau spacings, which also gives the library its name (Everhart 1985; Rein & Spiegel2014). The propagator submodule within grss uses a force model that incorporates the following:
- 1.Newtonian point-mass interactions (Newton 1687);
- 2.
- 3.
- 4.A1, A2, A3 nongravitational acceleration terms in the heliocentric radial, transverse, and normal directions, respectively (Marsden et al. 1973).
The Newtonian accelerations are calculated for the Sun, planets, the Moon, Pluto, and the Big16 main-belt asteroid perturbers from the DE441 ephemerides. On the other hand, the relativistic accelerations are only calculated for the Sun, planets, the Moon, and Pluto. Marsden et al. (1973) define the nongravitational acceleration terms. However, in this work, only the acceleration in the transverse direction is calculated. This is done using an inverse square expression of the form AT = A2(1 au/r)d , where r is the heliocentric distance and d = 2 is chosen to match the level of absorbed solar radiation (Farnocchia et al. 2013). It is possible to vary this exponent for a better orbit fit as was done by Chesley et al. (2014). However, in the case of Didymos, retaining d = 2 already provides an excellent orbit fit to all the observations.
Before the optical astrometry is passed through the orbit determination code, it needs to be treated to account for star catalog biases and weighted appropriately to ensure statistical reliability of the orbit solution given by the least-squares estimator. We use the astrometric catalog debiasing scheme from Eggl et al. (2020) to account for biases in the star catalogs used to reduce the optical astrometry reported to the MPC.
In addition to the debiasing, the optical astrometry acquired from the MPC also needs to be assigned weights before it is passed through the filter. We use the Vereš et al. (2017) weighting scheme to assign weights to observations depending on the observatory and the star catalog used for each observation. We also adopt the Vereš et al. (2017) rule of inflating the weights by a scaling factor of  for each observation if the number of observations from the same observatory on the same night is Nobs > 4. Once these optical observations are debiased and properly weighted, they are ready for the orbit filter. The radar astrometry uncertainty acquired from the JPL radar API is accepted at face value.
During the filtering process, one more algorithm is applied to the residuals. The grss orbit filter also has the capability to perform automatic outlier rejection according to the work of Carpino et al. (2003). This algorithm rejects and readmits optical measurements in the orbit fit based on a rejection threshold χrej and a recovery threshold χrec. We set χrej = 3 and χrec = 2.8 for grss. The χ values for each optical measurement pair are calculated as

where
b
i
is the vector of residuals for the ith optical observation pair (R.A. and decl.) and  is the residual covariance matrix of that pair of residuals, calculated as

Here A i is the 2 × Npar array of the gradient for the ith observation (the first row corresponds to the partial derivative of the R.A. with respect to the fitted parameters, and the second row is for the decl. measurement), and Γ i is the 2 × 2 covariance matrix of the same optical observation. The second term on the right-hand side of the equation has a negative sign when the observation is included in the fit and a positive sign when it is rejected. In our implementation, the initial guess given to the filter is allowed to converge without any outlier rejection on the first pass. Once a converged solution is found, outlier rejection is turned on, and the filter will successively remove and/or recover any optical measurements with too high of a χ value. The weighted residuals are once again allowed to converge with this outlier rejection scheme turned on, and the converged solution after this stage is the output of the grss orbit filter.
In addition to the data from MPC and the JPL radar astrometry database, grss also has the capability to generate synthetic observations for the purposes of covariance analysis. These synthetic data are generated from a reference trajectory and can be generated with or without any constant biases or Gaussian noise around the reference trajectory. The synthetic observation feature is heavily used in this work to investigate the number and type of observations needed to measure β⊙.
2.2. GRSS Validation
Before the grss orbit propagator and orbit filter can be used to estimate β⊙, they must be validated against tools that have been demonstrably successful in the past. We individually tested the propagator and orbit determination code with the heliocentric trajectory of the (65803) Didymos system barycenter. This was a natural choice, since the Didymos system was also the target of the DART mission. Additional testing with different asteroids was also done and is shown in the examples available on the grss documentation. 15
To validate the propagator, we took the latest Didymos orbital solution from the JPL Small-Body Database 16 (Solution 204 at the time of writing) and propagated it for 3000 days into the future. The initial solution is shown in Table 1. The difference in the final propagated position when compared to JPL's internal small-body propagation code was 2.4 m. Another longer-term propagation of 250 yr exhibited differences on the order of 1 km, which can be attributed to differences in the numerical scheme used to integrate the equations of motion.
Table 1. JPL Solution 204 and Its Associated 1σ Uncertainties for Didymos at 2023 January 12.5 TDB in Heliocentric J2000 Ecliptic Coordinates
| Element | Value | Uncertainty |
|---|---|---|
| e (·) | 0.3832947329867846 | 1.33837E−10 |
| q (au) | 1.012947259273837 | 2.75166E−10 |
| tp (MJD TDB) | 59873.790 058 610 495 | 9.56587E−08 |
| Ω (deg) | 72.99221760945375 | 2.18542E−07 |
| ω (deg) | 319.5559920731379 | 2.51502E−07 |
| i (deg) | 3.414168800300961 | 1.61880E−08 |
| A2 (au day−2) | −1.042309666988643e-14 | 6.49716E−16 |
Note. e: eccentricity; q: perihelion distance; tp : time of perihelion passage; Ω: longitude of ascending node; ω: argument of perihelion; i: Inclination; A2: transverse nongravitational acceleration parameter.
Download table as: ASCIITypeset image
Testing the orbit determination code is inherently more comprehensive, as it accumulates errors from both the integration and the observation model. The observation data set for Solution 204 includes a diverse set of observation types. There are more than 3000 optical measurements from ground-based observatories that include optical astrometry from telescopes around the world, radar delay measurements from the Goldstone Solar System Radar facility and Arecibo Observatory, optical measurements from the DART spacecraft before impact, and ground-based stellar occultation measurements. These stellar occultation measurements provide high-quality R.A.–decl. astrometry, and therefore very accurate observation models must be used when fitting these data.
Table 2 shows the orbit solution produced using grss. The grss solution and the JPL Solution 204 show excellent agreement with each other, with all orbital elements within 1σ of each other. Additionally, the Bhattacharya distance, which is a measure of the distance between two statistical distributions, is only 0.060. The complement to this distance is the Bhattacharya coefficient, which measures the similarity between two statistical distributions, which is 0.942 in this case. These two metrics indicate that the two solutions are exceedingly close. Given a similar input, orbit solutions computed by the grss library are providing results of comparable quality to those of the JPL solar system dynamics group. Figure 2 contains further support for this statement. Here, the postfit residuals of the optical measurements used by grss are shown. The red circles around the scatter points indicate that those residuals were automatically removed by the outlier rejection scheme. We see that most observations with high residuals are automatically rejected. The few that remain are weighted such that, even with the high residuals, they do not have a meaningful effect on the final solution.
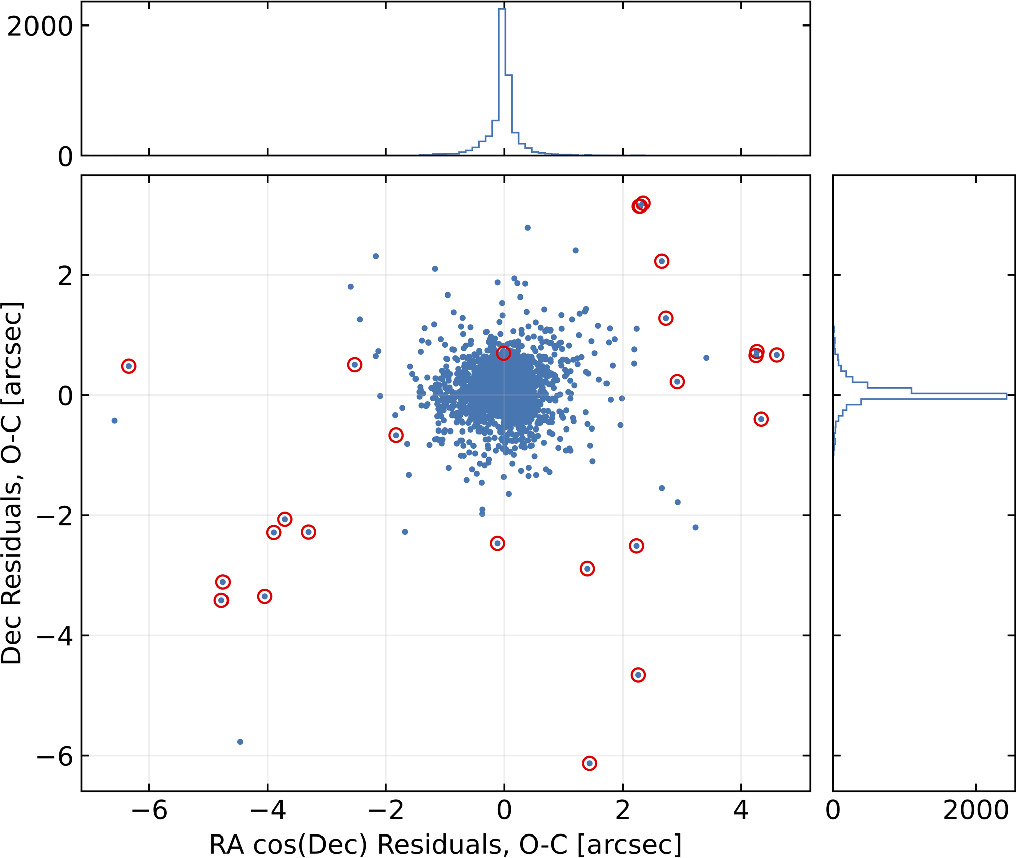
Figure 2. Postfit residuals of the optical observations used in the Didymos orbit solution produced by grss. The rejected observations are marked with a red circle.
Download figure:
Standard image High-resolution imageTable 2. grss Orbit Solution and Its Associated 1σ Uncertainties for Didymos at 2023 January 12.5 TDB in Heliocentric J2000 Ecliptic Coordinates
| Element | Value | Uncertainty |
|---|---|---|
| e (·) | 0.38329473307756273 | 1.32739E−10 |
| q (au) | 1.01294725920442 | 2.86507E−10 |
| tp (MJD TDB) | 59873.790058557846 | 7.75412E−08 |
| Ω (deg) | 72.99221758229581 | 2.00783E−07 |
| ω (deg) | 319.555992043250 06 | 2.39655E−07 |
| i (deg) | 3.4141688210436767 | 1.59297E−08 |
| A2 (au day−2) | −1.009633133758832e-14 | 6.09611E−16 |
Note. e: eccentricity; q: perihelion distance; tp : time of perihelion passage; Ω: longitude of ascending node; ω: argument of perihelion; i: Inclination; A2: transverse nongravitational acceleration parameter.
Download table as: ASCIITypeset image
The remaining differences in the solutions can be explained by the fact that the JPL solutions sometimes incorporate manual weighting of the observations on top of the Vereš et al. (2017) rule. Additionally, the JPL solution assumes a 1 s uncertainty on the timing of all observations. This is not modeled by grss, thus resulting in a lower uncertainty than if time uncertainty were taken into account. There are also some differences introduced by the fact that JPL propagates analytical partials along with the state and grss uses numerical derivatives. This leads to small differences in the covariance matrix between the two solutions. However, Tables 1 and 2 show that the uncertainties are quite close to each other. Additionally, Figure 3 shows the correlation factors for each of the two orbit solutions. The two sets of correlation factors are in good agreement with each other. This indicates that it is not just the 1σ uncertainties on the diagonals of the covariance matrices that agree well, but it is both covariance matrices that are very similar to each other.
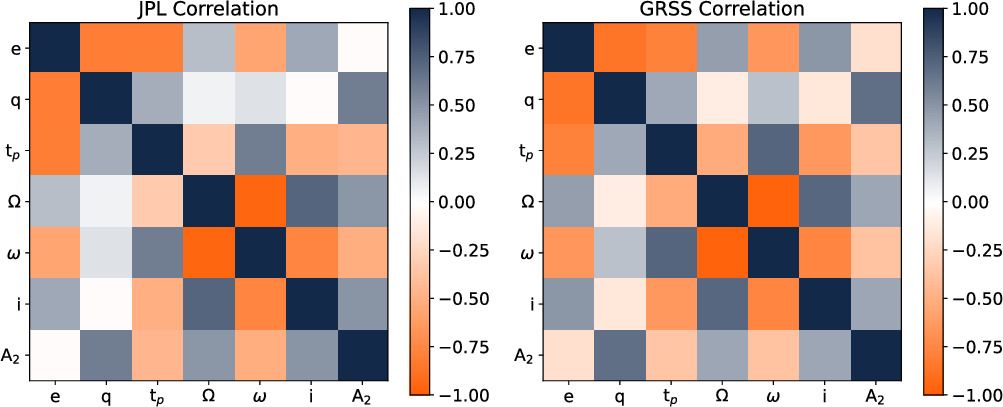
Figure 3. Postfit correlation values from the covariance matrix of the Didymos orbit solutions produced by JPL (left) and grss (right).
Download figure:
Standard image High-resolution imagegrss does not just perform well at fitting optical data. Figure 4 shows the postfit χ values of each observable in the fit. We see that the radar delay values (shown in green) are closely packed around 0, indicating that the grss observation model does not have trouble fitting radar data either. The radar data from 2003 have lower rms values than the ones in 2022 because they were regenerated using a shape model and therefore have lower uncertainties on the measurement (Naidu et al. 2020). Due to the lower uncertainties, the filter assigns a tighter weight to the 2003 delay points, which leads to better unnormalized residuals.

Figure 4. Postfit weighted residual values of the observations used in the Didymos orbit solution produced by grss. The rejected observations are marked with a red circle.
Download figure:
Standard image High-resolution image2.3. DART Kinetic Impact Geometry
A consequence of the DART impact on the Didymos system barycenter is a momentum transfer of magnitude β⊙ times the momentum of the DART spacecraft at impact. Figure 5 depicts the direction of this impulse and its associated formal 1σ uncertainty using the observation scenario from Section 3.5, as well as the directions of the velocity vector of the DART spacecraft and the Didymos system barycenter at the time of impact. The blue vector represents the direction of the velocity of the DART spacecraft (relative to the Didymos system barycenter) at the time of impact, and the red arrow represents the direction of the velocity of the system barycenter relative to the Sun at the same epoch. The uncertainty of the delta-v imparted by DART is shown by the green ellipsoid. More details on how this ellipsoid was calculated are presented at the end of Section 3.5.

Figure 5. Visualization of the DART impact circumstances and the resulting impulse on the Didymos system barycenter. The uncertainty ellipsoid is shown in an edge-on (left) and face-on (right) orientation. Note that the direction vectors have been scaled to a magnitude of 1E−7 km s−1. The ellipsoid reflects the observational circumstances of Section 3.5.
Download figure:
Standard image High-resolution imageThe minor axis of the ellipsoid is significantly smaller than the major and intermediate axes. Additionally, the minor axis is oriented along nearly the same direction as the DART spacecraft velocity at impact. In this work, we therefore make the assumption that the resulting impulse is instantaneously applied in the same direction as the DART spacecraft's velocity relative to the Didymos system barycenter at impact. Fixing the direction of the impulse in a direction that cuts through the smallest axis of the ellipsoid helps the filter when estimating β⊙.
Since this work focuses on measurability of β⊙, rather than on an actual estimate of β⊙, this assumption of alignment of the DART velocity vector and the impulse to the barycenter is justified. Measurement of β⊙ from the DART impact would need a better estimate of this impulse direction. This direction would then be informed by high-fidelity ejecta dynamics simulations and observations of the ejecta (Fahnestock et al. 2022; Li et al. 2023). Conversely, accurately estimating the three-dimensional β⊙ properties can help better constrain the ejecta plume as well.
3. β⊙ Estimation Scenarios for DART
Can we detect β⊙ for DART? Could additional observations help us reach that point? In this section, we investigate a set of scenarios that aim to answer these questions and enable the detection of β⊙ for the DART impact. Constants and parameters used in this section come from Daly et al. (2023), the DART Design Reference Asteroid (DRA) in Chabot et al. (2024), and the SPICE kernels for the DART mission. 17 These are listed in Table 3. Moreover, it is important to note that all the β⊙ standard deviations presented in this section are the formal 1σ uncertainties from the least-squares estimation.
Table 3. DART Impact Circumstances and Didymos System Constants
| Constant | Value |
|---|---|
| UTC time | 2022 Sep 26 23:14:24.183 |
| Spacecraft mass | 579.4 kg |
| Relative velocity [ICRF, x] | 3.573 km s−1 |
| Relative velocity [ICRF, y] | −4.642 km s−1 |
| Relative velocity [ICRF, z] | −1.856 km s−1 |
| Didymos system mass | 6.05e11 kg |
Download table as: ASCIITypeset image
3.1. Current Observation Data
The first question that needs to be answered when looking at β⊙ measurability is whether it can be estimated with the already-existing observation data. Therefore, we took all of the Didymos astrometry up until the time of writing (2023 August) and attempted to estimate β⊙. This data set included all the observations in the JPL Solution 204 data set and more than 2000 additional ground-based optical astrometry points from 2022 August to 2023 June from the MPC.
Results in this case showed a β⊙ estimate of −4.8 ± 16.5, indicating a signal-to-noise ratio (S/N) of about 0.3. This shows that the existing data are not enough to give a statistically significant estimate. Since β⊙ is the link between the pre- and post-impact orbits of the Didymos system, both of them need to be well constrained to obtain a significant β⊙ estimate. Since the post-impact observation arc is less than 9 months long at the time of writing this article, a β⊙ estimate is not possible at this time. Therefore, we look at the future observation scenarios needed to get a reliable β⊙ estimate.
3.2. Case 1: New Occultations in 2024
In the first observation scenario, we consider the possibility of a handful of new stellar occultation measurements at a monthly cadence between 2024 June and October. The 2024 June start time was chosen since there is a good chance of getting successful occultation measurements in the second half of 2024. This prediction is based on the density of star background that would enable an occultation measurement, regardless of the duration and magnitude of the occulted star. Additionally, the uncertainty of the current orbit of Didymos propagated to the beginning of its observability period in 2024 is only ≈1 Didymos body radius. The 2024 October cutoff was chosen because that is the planned launch date of ESA's Hera mission (Michel et al. 2022), and we wanted to explore the possibility of estimating β⊙ before the launch.
These synthetic future stellar occultation measurement uncertainties were assumed to be at 2.5 mas. This is slightly higher than the average uncertainty of the existing Didymos occultation measurements (Chesley et al. 2023), to ensure a conservative estimate. These observations were generated from the JPL Solution 204 for Didymos as a reference trajectory. A reference value of β⊙ = 3 was set as the "true" value to assess the accuracy of the estimates returned by the orbit filter. This assumption is justified because the nominal β value (when not accounting for Dimorphos mass uncertainties) for the DART impact is about 3.6. β⊙ must be lower than the β value since only a subset of ejecta that escaped Dimorphos could have escaped the system's Hill sphere.
Additionally, even though it is not statistically significant, the β⊙ estimate from Section 3.1 is less than 0.5σ away from this assumption. This implies that β⊙ = 3 is not an unreasonable assumption to make. It is, however, important to stress that this is not the β⊙ value from the DART impact, but a reference value to assess how well we could measure β⊙ under different scenarios. The β⊙ estimate in this case was 3.2 ± 0.7, at an S/N ∼ 4.9. Therefore, occultations in the second half of 2024 already give a long-enough observation arc for a reliable β⊙ estimate before the Hera launch.
3.3. Case 2: New Occultations in 2024 and 2027
After analyzing the effects of the 2024 occultations on the β⊙ S/N, we decided to add more occultations in 2027, when the Hera spacecraft will be at the Didymos system. Therefore, five additional monthly occultations from 2027 February to June were added to the observation data set for Case 1. The β⊙ estimate in this case was 3.0 ± 0.4, at an S/N ∼ 8. Therefore, the 2027 occultations increased the S/N by a factor >1.5. However, all five of these additional occultations might not be possible in early 2027, so we decided to explore another case.
3.4. Case 3: New Hera Measurements in 2027
After the Hera mission's planned launch in 2024 and a 2 yr cruise, the spacecraft would arrive at the Didymos system in late 2026 and would begin operations in early 2027. As part of these operations, the spacecraft would regularly communicate with radar ground stations on Earth. Some of these tracking passes could then be converted into pseudorange measurements of the asteroid barycenter, as was done with the OSIRIS-REx mission at Bennu (Farnocchia et al. 2021). Case 3 considers converting some of these Hera tracking measurements into pseudorange measurements of the Didymos system barycenter at a monthly cadence from 2027 February to June.
These pseudorange measurements are added to existing observations without any new occultations. The expected uncertainties are ∼5 m, based on detailed numerical simulations of the Hera Radio Science experiment (Zannoni et al. 2018). However, all synthetic pseudorange measurements of the barycenter of the Didymos system in this study are weighted at an uncertainty of 15 m to ensure a conservative estimate. This is also conservative compared to the 2 m uncertainties of the Farnocchia et al. (2021) OSIRIS-REx pseudorange points and should not produce overly optimistic S/N values. In this case, the β⊙ estimate is 3.0 ± 0.2, with S/N ∼ 17. This increase in S/N is due to the fact that the Hera pseudorange measurements provide extremely accurate astrometry, and these measurements are taken at a point where the post-impact arc is almost 5 yr long.
3.5. Case 4: New Occultations in 2024 and 2027 with New Hera Measurements in 2027
The last observation scenario considered for estimating the β⊙ for DART is the superset of the three future observation scenarios considered up to this point. These data include all existing observations and assume that new occultation measurements in 2024 and 2027 will be successful and that the Hera mission will provide pseudorange measurements for the Didymos system barycenter. In this scenario, the estimate of β⊙ is 3.0 ± 0.2, with an S/N ∼ 17. This is the best estimate of β⊙ (negligibly better S/N than Case 3), as it is based on the largest set of high-precision observations.
The S/N value in this case has another point of validation. In Figure 5, the ellipsoid of the delta-v uncertainty is calculated using this observation scenario. A separate capability of grss that can be used to estimate unconstrained ΔV vectors was used to obtain the 3 × 3 subcovariance matrix corresponding to the DART ΔV. The eigenvalues of this covariance matrix yield the uncertainty of this ΔV (and therefore the dimensions of the ellipsoid), and the eigenvectors give us the orientation of the uncertainty ellipsoid.
Using the estimate of this unconstrained ΔV vector and its uncertainty, we find that the theoretical maximum S/N value of the ΔV magnitude for this observation scenario is 20.3. We consider the S/N of the magnitude of the ΔV vector instead of the components since this is similar to estimating the scalar β⊙ value. (The S/N for the components of the ΔV vector in such a scenario would be much smaller owing to a lack of directional constraint.) Additionally, there is a small 16° offset between the eigenvector corresponding to the maximum S/N and the assumed direction of the escaping ejecta momentum in this work. Due to this offset, the maximum achievable S/N for this observation scenario reduces to 19.5. This maximum possible S/N is only 15% higher than the one we achieve with the assumption about the direction of the escaping ejecta momentum, and therefore it serves as a sanity check for the β⊙ S/N values we get from the least-squares estimator. Therefore, the assumption about the direction of the escaping ejecta is not significantly affecting the measurability of β⊙.
3.6. Summary and Discussion
Table 4 shows the summary of the simulated estimates for β⊙ and the A2 transverse nongravitational acceleration parameter for all four cases described in this section. We see the expected progression of the S/N as more observations of the Didymos system are added from Case 1 to Case 4. Additionally, we present the fitted values and S/Ns for the fit of the A2 parameter along with β⊙ for each of the cases. This is presented because the two parameters are highly correlated (as shown by the last column of Table 4). The Yarkovsky effect causes a secular semimajor-axis drift that has been detected in many other asteroids, with Bennu having the best detection owing to the OSIRIS-REx mission (Farnocchia et al. 2021). On the other hand, the DART impact impulsively changed the orbit of the Didymos system barycenter. So when estimating both parameters simultaneously, the filter has to disentangle the semimajor-axis drift from the Yarkovsky effect,  , from the semimajor-axis change Δa due to the DART impact.
Table 4. DART β⊙ and A2 Estimation Summary for Various Simulated Future Observation Scenarios
| Scenario | β⊙ |

| S/N
| A2 (au day−2) |
 (au day−2) (au day−2) | S/N
| Corr (β⊙, A2) |
|---|---|---|---|---|---|---|---|
| Case 1 | 3.21 | 0.66 | 4.85 | −1.03E−14 | 7.21E−16 | 14.21 | 0.57 |
| Case 2 | 3.03 | 0.39 | 7.84 | −1.03E−14 | 6.99E−16 | 14.75 | 0.67 |
| Case 3 | 3.01 | 0.18 | 16.75 | −1.04E−14 | 4.19E−16 | 24.78 | 1.00 |
| Case 4 | 3.03 | 0.18 | 17.01 | −1.03E−14 | 4.23E−16 | 24.43 | 1.00 |
Note. The target value to be retrieved in these simulations is β⊙ = 3, A2 = −1.04E−14 au day−2.
Download table as: ASCIITypeset image
To further illustrate this correlation, Figure 6 shows the 3σ covariance ellipses generated using the 2 × 2 subcovariance matrix for the four cases. We see the uncertainty ellipses get smaller as the S/N on both β⊙ and A2 increases when more observations are added in each scenario. The correlation between the two parameters in Cases 1 and 2 is 0.568 and 0.670, respectively. Once the Hera pseudorange measurements are added to the estimate in Cases 3 and 4 (highlighted in Figure 7), the correlation between β⊙ and A2 jumps to 0.996 in both scenarios.
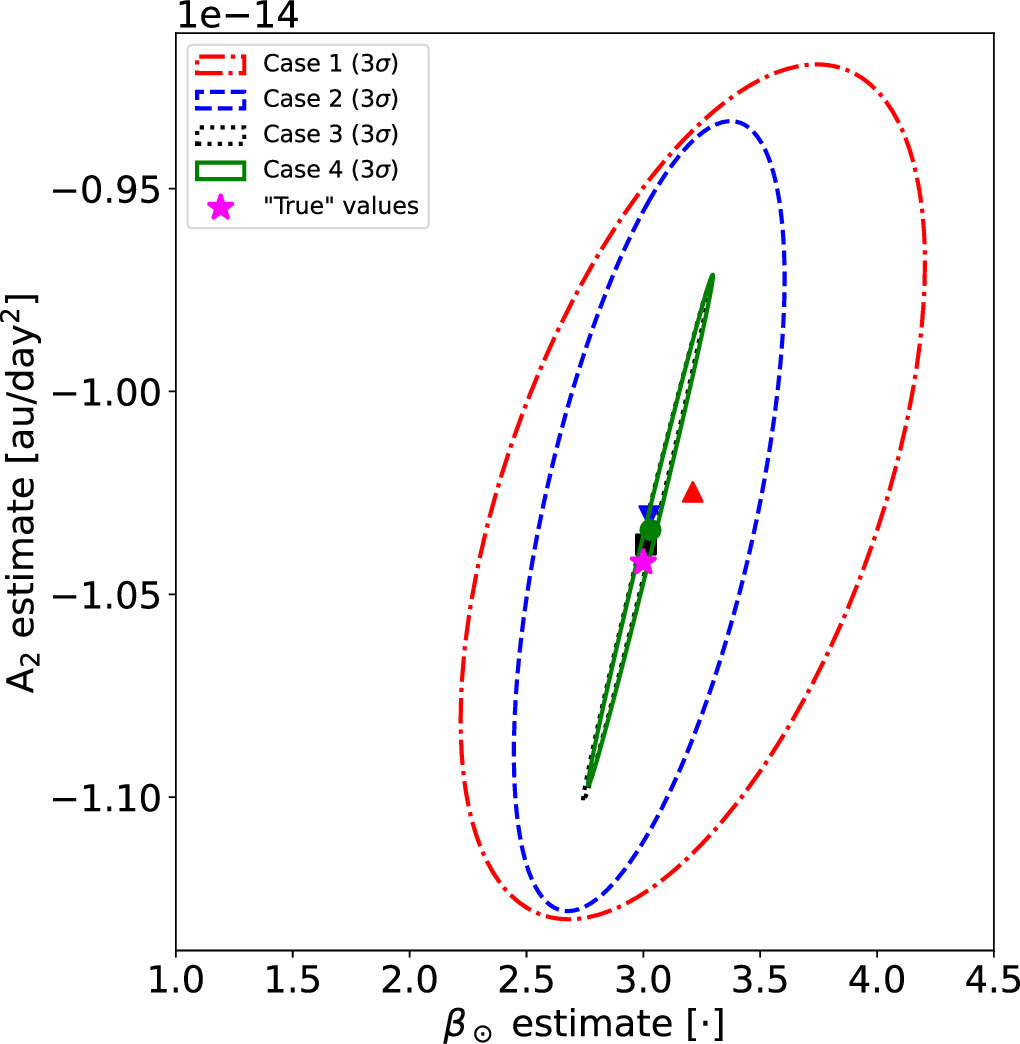
Figure 6. β⊙−A2 covariance mapping for all four future observation scenarios considered in this work.
Download figure:
Standard image High-resolution image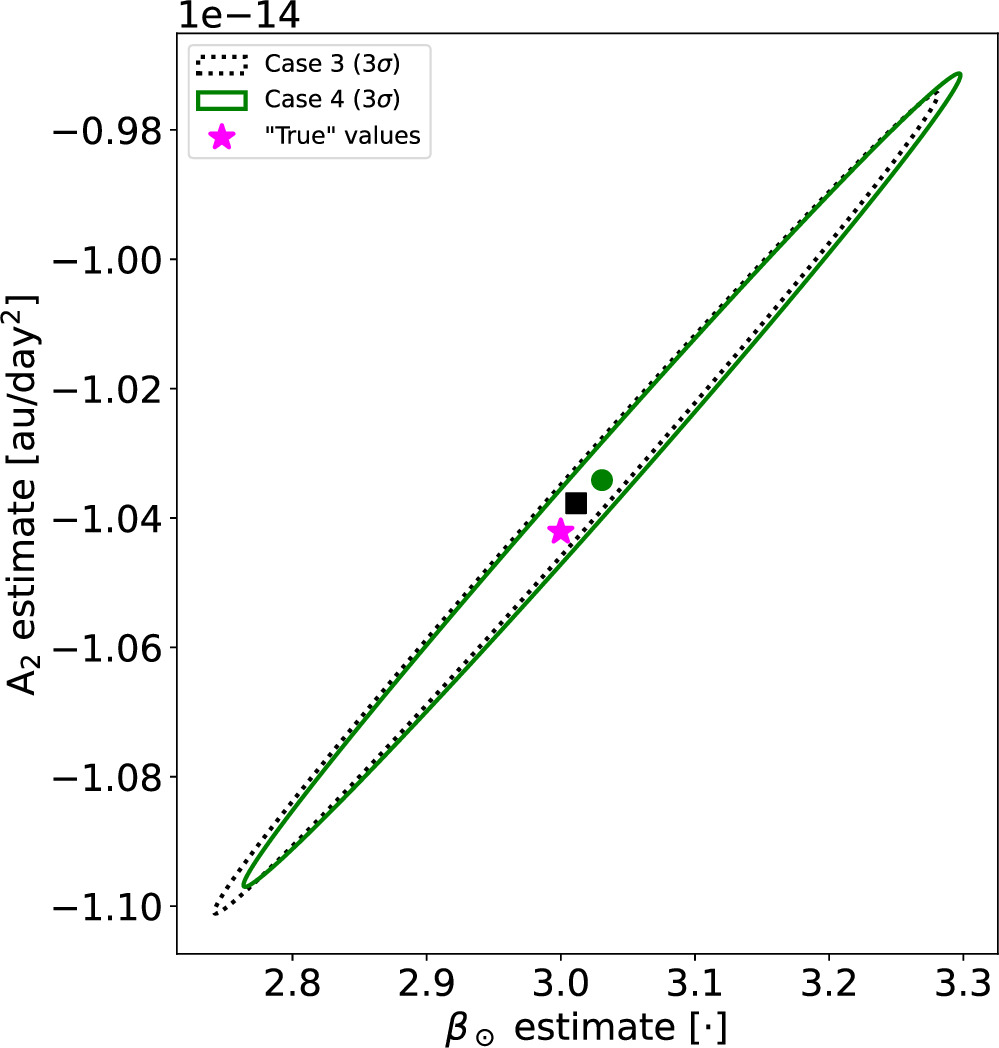
Figure 7. β⊙−A2 covariance mapping for Cases 3 and 4 (zoomed-in view of Figure 6).
Download figure:
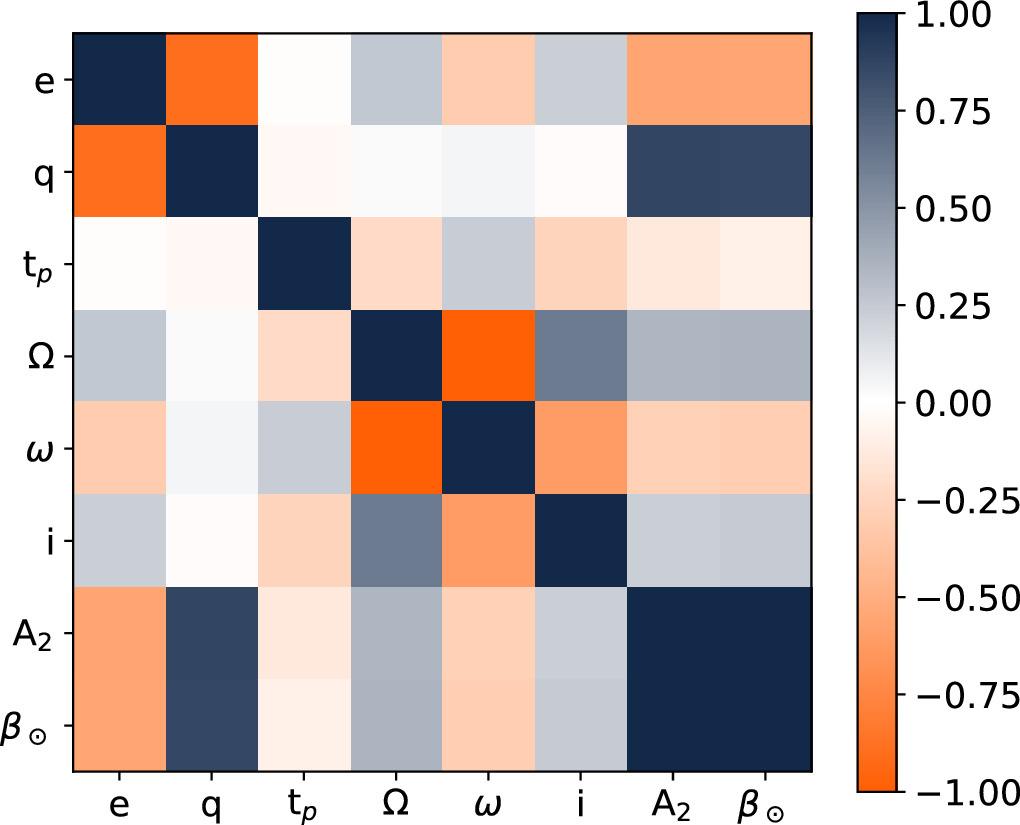
Standard image High-resolution imageAdditionally, Figure 8 shows the complete correlation matrix of the orbit fit for Case 4. The strong correlation between β⊙ and A2 is even more apparent in this depiction. This highlights the importance of having an accurate picture of the acceleration due to the Yarkovsky effect when it comes to estimating β⊙ for kinetic impact-based missions. In the case of Didymos, as well as many other asteroids, such as Apophis, an accurate estimate of the Yarkovsky acceleration has been enabled by either radar delay measurements or stellar occultations, or both. It is important to note that all near-Earth asteroids that have had successful occultation campaigns at the time of writing have been observed first by radar facilities. For this reason, when considering β⊙ estimation scenarios for a future KI mission, we consider these two types of measurements both before and after impact.
Figure 8. Postfit correlation values from the covariance matrix of the orbit solution used to estimate β⊙ in Case 4.
Download figure:
Standard image High-resolution image
4. β⊙ Estimation Scenarios for Future KI Missions
A key takeaway from the previous sections is that the orbit uncertainties for the Didymos system barycenter were reduced significantly with the aid of the successful occultation campaigns. Combined with the excellent radar astrometry provided by radar delay measurements, occultations could aid the success of future planetary defense missions, e.g., through a successful measurement of β⊙.
Therefore, here we consider a future DART-like KI mission at Didymos. An interesting exercise in this respect is to investigate how pre-impact stellar occultation measurements would have affected our ability to determine the heliocentric outcome of the DART experiment. The weights of the occultation measurements in this scenario correspond to 25% of the angular diameter of Didymos at the time of the synthetic occultation. This is similar to the average weight at 23% of the angular diameter of Didymos for existing occultation measurements. This exercise also assumes that the pre-impact orbit is good enough to allow for successful occultation observations.
In this scenario, we retain Case 1 from Section 3 but assume that the first 8 out of 16 occultations used in the fit for Solution 204 occurred on the first day of the 8 months leading up to impact, i.e., eight occultations on the first day of the month from 2022 February to September. The time interval over which these eight occultations occur can be compressed or extended as appropriate for an occultation opportunity, but what matters here is the number of high-accuracy occultation measurements. In this scenario, with the five additional occultation measurements in 2024 corresponding to Case 1, the S/N of β⊙ increases by more than a factor of 2 to S/N ∼ 12.
In another observation scenario, the pre-impact occultations can also help to determine how early we can get a meaningful (S/N ≥ 3) estimate of β⊙. In this scenario, we still retain the assumption of splitting the first 8 out of 16 occultations to happen before the impact from 2022 February to September. Only one additional occultation in 2023 September would already provide an estimate of β⊙ = 3.0 ± 0.9, with an S/N ∼ 3. This means that pre-impact occultations would have reduced the amount of time it would have taken to obtain a statistically significant estimate of β⊙ by more than a year.
However, all asteroids with successful occultation measurements have first been observed by ground-based radar stations. (The dependence on radar data to predict occultation by NEOs is expected to change as new high-accuracy asteroid astrometry data come in from Gaia measurements, 18 but it remains true for now.) This is because radar measurements can reduce the uncertainty of the orbit solution to a point where successful occultation campaigns can take place. Therefore, to minimize the time between impact and a significant β⊙ estimate (which is enabled by stellar occultation measurements), the target asteroid should be observed using radar (which can enable successful stellar occultations in the first place). This means that it is a combination of the complementary pre- and post-impact radar and stellar occultation measurements that are necessary to get a β⊙ estimate for a KI mission as quickly as possible. Therefore, future KI missions should plan a combination of radar and occultation measurements to increase the likelihood of a rapid and reliable assessment of mission success.
5. Conclusions
We explored the measurability of the heliocentric momentum enhancement parameter (β⊙) for kinetic impact-based asteroid deflection missions for the specific case of the DART mission. Making use of the least-squares estimator in the publicly available grss library, we found that the heliocentric momentum enhancement factor β⊙ does not show a signal with the observation set in hand as of 2023 August. However, if future high-precision observations are added, such as occultation measurements in the second half of 2024, estimates for β⊙ from the DART impact on Dimorphos would become statistically significant. Adding pseudorange measurements of the Didymos system using the Hera spacecraft in 2027 would result in detections of β⊙ with an S/N of 17.
We find that pre-impact occultation measurements would have had a significant impact on how quickly a significant β⊙ estimate could have been achieved with DART. Successful occultation observation campaigns for the Didymos system in the year before the impact could have resulted in a solid detection of β⊙ as early as 2023 September. Therefore, we conclude that for future KI missions, stellar occultation measurements and radar observations that enable the occultation measurements should be planned for and considered an integral part of the observation campaign before and after impact. This would enable a rapid and statistically significant assessment of the momentum transferred during a kinetic impact. In turn, this would help us to conclude whether Earth is safe by judging whether a future impact event has been safely averted.
Acknowledgments
R.M. and S.E. acknowledge funding from a NASA Space Technology Graduate Research Opportunities (NSTGRO) award, NASA contract No. 80NSSC22K1173. This work was supported in part by the DART mission, NASA contract No. 80MSFC20D0004 to JHU/APL. The work of S.R.C., D.F., and S.P.N. was carried out at the Jet Propulsion Laboratory, California Institute of Technology, under a contract with the National Aeronautics and Space Administration (No. 80NM0018D0004). The authors also acknowledge the ACROSS Collaboration for predicting occultation events and conducting successful campaigns that led to high-accuracy astrometric measurements. The ACROSS project is supported under the OSIP ESA contract No. 4000135299/21/NL/GLC/ov. This study makes use of data obtained by the Observing Working Group of the DART Investigation Team. D.S. thanks Action Fédératrice Gaia of the Paris Observatory for financial support and acknowledges support as a Fulbright Visiting Scholar (2022–2023) at UC Berkeley. Part of this work was supported by the Programme National de Planétologie (PNP) of CNRS-INSU cofunded by CNES and the BQR program of the Observatoire de la Côte d'Azur. The authors also thank two anonymous reviewers for their comments and suggestions.
Footnotes
- 11
grss is publicly available at https://github.com/rahil-makadia/grss
- 12
- 13
- 14
- 15
- 16
- 17
- 18
https://www.cosmos.esa.int/web/gaia/news; Gaia Data Releases 4 and 5 are expected in 2025 and 2030, respectively.