


Abstract
We used the FORCAST instrument on SOFIA to obtain mid-infrared spectra (4.9–13.7 μm) of four S-type asteroids: (7) Iris, (11) Parthenope, (18) Melpomene, and (20) Massalia. Three of these four silicate-rich asteroids (Iris, Melpomene, and Massalia) were observed to have 3 μm features indicative of hydration by McAdam et al. We report a detection of a 6 μm feature that is unambiguously attributed to molecular water on two asteroids, Iris and Massalia, with peak heights of 4.532% ± 0.011% and 4.476% ± 0.012%, respectively. We estimate the abundance of molecular water based on these peak heights to be 454 ± 202 μg g−1 and 448 ± 209 μg g−1, consistent with values found on the sunlit Moon by SOFIA+FORCAST.
Export citation and abstract BibTeX RIS

Original content from this work may be used under the terms of the Creative Commons Attribution 4.0 licence. Any further distribution of this work must maintain attribution to the author(s) and the title of the work, journal citation and DOI.
1. Introduction
Asteroids have different compositions depending on where they formed in the solar nebula, with silicates forming nearer to the Sun and ices forming farther from the Sun. As asteroids are remnants of the planetary formation process, the location of asteroids and their compositions give information on the distribution of materials in the solar nebula and their evolution since formation. Of particular interest is the distribution of water on asteroids, because the distribution can shed light on how water was delivered to Earth, with implications for how water could be delivered to potentially habitable planets outside our solar system.
As the solar system evolved, some asteroids have undergone aqueous alteration, forming phyllosilicates, sulfates, oxides, carbonates, and hydroxides. These features can be sometimes identified through visible and near-infrared (VNIR; 0.4–4.0 μm) spectroscopy. A widely used method for determining hydration on asteroids is through the detection of an absorption band near 3 μm. The 3 μm feature is due to the fundamental O–H stretching mode and can be caused by any species with O and H, such as molecular water (H2O) or hydroxyl (OH). Other materials relevant to asteroid surfaces that have absorption features in the 3 μm region are the ammonium ion NH4 + (King et al. 1992), ammoniated phyllosilicates, ammonium salts (Poch et al. 2020), goethite (Beck et al. 2011), methane (Coustenis et al. 2006), and complex organics (Emery & Brown 2004). The features in this region tend to overlap, creating one broad feature whose interpretation is therefore complicated.
The 3 μm feature has been identified on hundreds of asteroids (e.g., Takir & Emery 2012; Rivkin et al. 2022). The identifications have occurred mostly in the carbonaceous, relatively unaltered C-complex established by the Bus–DeMeo taxonomy (DeMeo et al. 2009). Recently, S-type asteroids with predominately silicate compositions have been shown to have 3 μm features as well (Rivkin et al. 2018; McAdam et al. 2023). This detection is surprising, because our current understanding of solar system formation would suggest that S types are anhydrous because of their formation location in the inner solar system (e.g., DeMeo & Carry 2014; Raymond & Izidoro 2017; Raymond & Nesvorný 2022). Three of our four asteroids (Iris, Melpomene, and Massalia) have 3 μm features reported by McAdam et al. (2023). The fourth asteroid, Parthenope, was in the McAdam et al. (2023) study but was not reported to have a 3 μm feature and was meant to be used in the current work as a control test for hydration.
Unlike the 3 μm feature, there is a feature at 6 μm that is unambiguously due to molecular water without confusion from OH or any other mineral. The 6 μm feature is caused by the H–O–H bending vibrational mode and has been detected and attributed to molecular water on the sunlit surface of the Moon (Honniball et al. 2021, 2022). The lunar observations were conducted on areas with known hydration signatures such as regions with 3 μm absorption mapped by Chandrayaan-1 (Li & Milliken 2017). At asteroid-like and moon-like temperatures, the 6 μm band is seen as an emission peak, rather than an absorption trough like the 3 μm band. Honniball et al. (2021, 2022) constrained the abundance of molecular water on the Moon to ∼100–400 ppm based on the observed strength of the 6 μm emission peak. The 6 μm feature has never been characterized on an asteroid.
In this work, we observe four S-type asteroids to identify and characterize the 6 μm feature indicative of molecular water. Details of the observations are given in Section 2, and thermal modeling is discussed in Section 3. We present results in Section 4 and a discussion including comparisons to other objects in Section 5.
2. Observations and Data Reduction
We obtained mid-infrared (MIR) spectra between 4.9 and 13.7 μm using the Faint Object infraRed CAmera for the SOFIA Telescope (FORCAST) instrument (Herter et al. 2018). Observations were obtained between 2022 January and May. The heliocentric distance (r), observer distance (Δ), and phase angle (α) at the time of each observation were adapted from the JPL Horizons ephemeris service
7
and are given in Table 1. Values for H were also taken from Horizons, and values for G are from Tholen (2009). We used two grisms, G063 (4.9–8.0 μm) and G111 (8.4–13.7 μm), for spectroscopy and two filters, F064 (6.4 μm) and F111 (11.1 μm), for imaging. The size of the slit is 2 4 × 194'', corresponding to a resolution of λ/Δλ = 180. Values for rotational period are taken from the asteroid light-curve database (Warner et al. 2009).
Table 1. Observing Conditions for Each Asteroid
| Object | H | G | Filter | UT Date and Time | r (au) | Δ (au) | α (deg) | 3 μm Band Depth (%) | Rotational Period (h) |
|---|---|---|---|---|---|---|---|---|---|
| (7) Iris | 5.64 | 0.15 | G063 | 2022-01-27 10:01 | 2.120 | 1.162 | 8.35 | 5.56 ± 0.97 | 7.14 |
| G111 | 2022-01-27 09:50 | 2.120 | 1.162 | 8.36 | |||||
| (11) Parthenope | 6.73 | 0.15 | G063 | 2022-01-26 07:19 | 2.697 | 1.749 | 6.99 | 1.02 ± 1.2 (negligible detection) | 13.72 |
| 2022-05-24 04:27 | 2.675 | 2.679 | 21.8 | ||||||
| 2022-05-26 04:31 | 2.675 | 2.705 | 21.7 | ||||||
| G111 | 2022-01-25 07:02 | 2.697 | 1.754 | 7.41 | |||||
| (18) Melpomene | 6.34 | 0.25 | G063 | 2022-05-24 10:08 | 2.692 | 1.749 | 9.81 | 3.02 ± 1.26 | 11.57 |
| 2022-05-25 05:59 | 2.691 | 1.752 | 10.08 | ||||||
| 2022-05-27 08:59 | 2.688 | 1.761 | 10.79 | ||||||
| G111 | 2022-05-24 09:42 | 2.692 | 1.749 | 9.81 | |||||
| (20) Massalia | 6.54 | 0.25 | G063 | 2022-01-27 08:21 | 2.098 | 1.124 | 5.32 | 3.02 ± 1.26 | 8.098 |
| G111 | 2022-01-27 08:32 | 2.098 | 1.124 | 5.33 |
Note. Values for H, G, r, Δ, and α were adapted from the JPL Horizons ephemeris service and the JPL Small Body Database. 3 μm band depths are reported by McAdam et al. (2023).
Download table as: ASCIITypeset image
The SOFIA science center provides flux-calibrated spectra and images to the NASA/IPAC Infrared Science Archive 8 (IRSA). A detailed description of the data reduction process is given in the user handbook (Clarke et al. 2022). Reduction pipeline steps include bad pixel masking, droop and nonlinearity correction, background subtraction, wavelength calibration, aperture identification, spectral extraction and merging, flux calibration, and correction for atmospheric transmission. To correct for atmospheric transmission, we use models of atmospheric transmission derived from Steve Lord's ATRAN model (Lord 1992). The SOFIA pipeline contains models for every 1000 feet of altitude between 36,000 and 45,000 feet, for every 5° of zenith angle between 30° and 60°, and for a set of precipitable water vapor (PWV) values between 1 and 30 μm in 1 μm increments (Figure 1). For added precision, we used models with PWV increments of 0.1 μm.
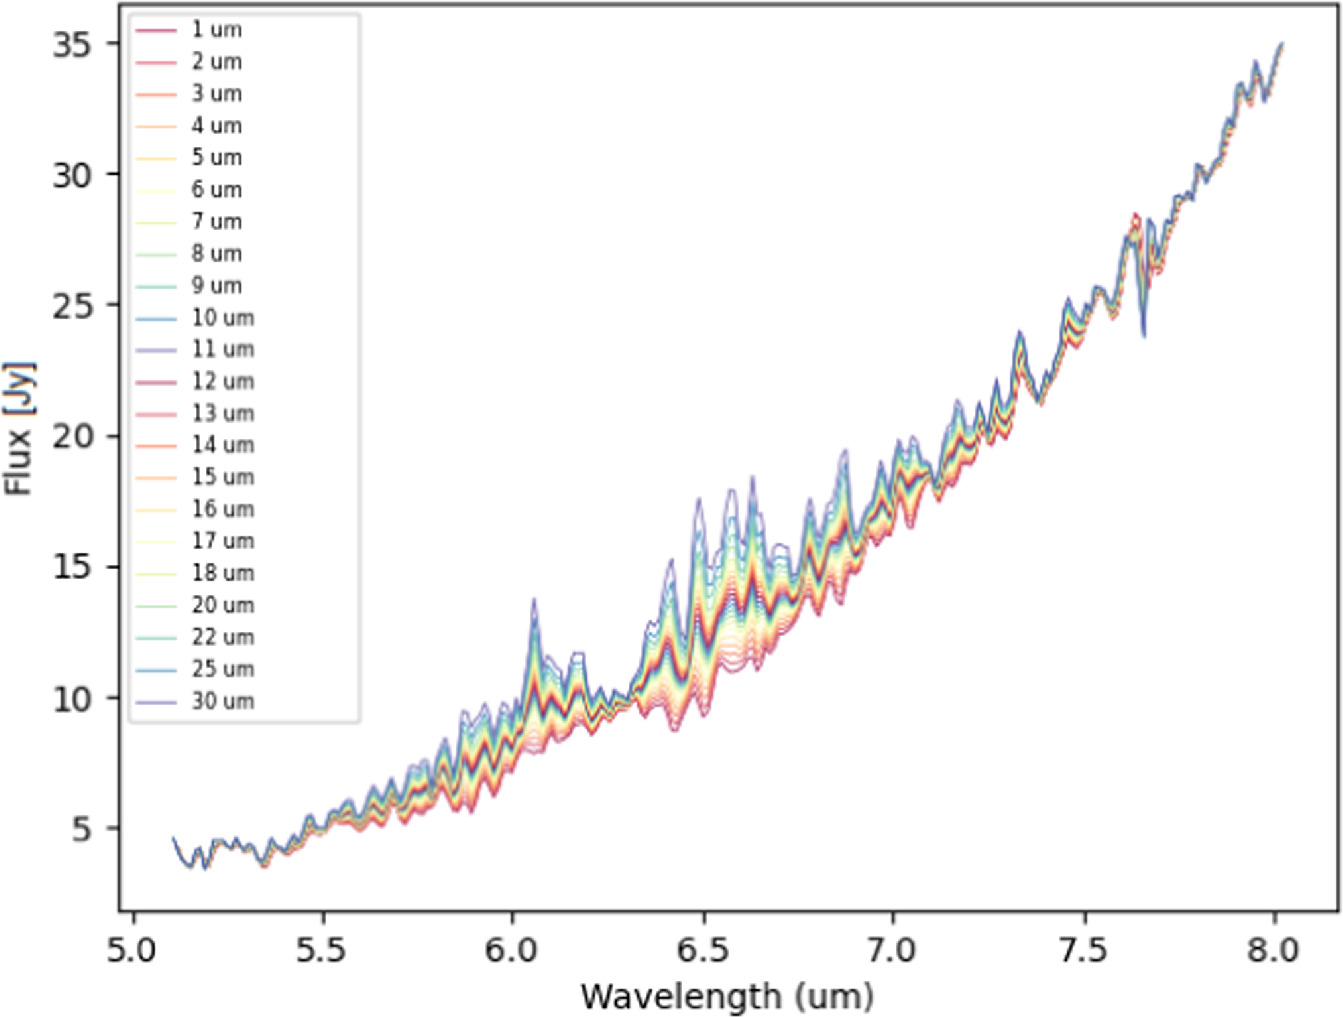
Figure 1. Output of the SOFIA processing pipeline showing how the spectrum changes with varying PWV values. Shown is Iris spectrum 0144 from flight 816.
Download figure:
Standard image High-resolution imageWe use these data products as is with the exception of the G063 spectra. As explained in Arredondo et al. (2023), the expected size of the 6 μm feature is ∼1%, and the SOFIA pipeline atmospheric correction leaves behind residual atmospheric features >1%, which can completely obscure the feature. To rectify this, we run our own flux calibration on the G063 data, following the methods in Arredondo et al. (2023). Furthermore, we used the pipeline step Stack Dithers to combine the data frames for each observation before wavelength calibration, reducing noise and improving the wavelength calibration. This updated calibration greatly improved the final data product (Figure 2), as there is a peak in the atmospheric transmission model (gray) at 6.02 μm that could be confused with the water feature. After correcting the raw spectrum (red) for atmospheric transmission, a peak in the corrected spectrum (blue) appears around 6.04 μm that does not line up with the atmospheric model, suggesting that it is real.
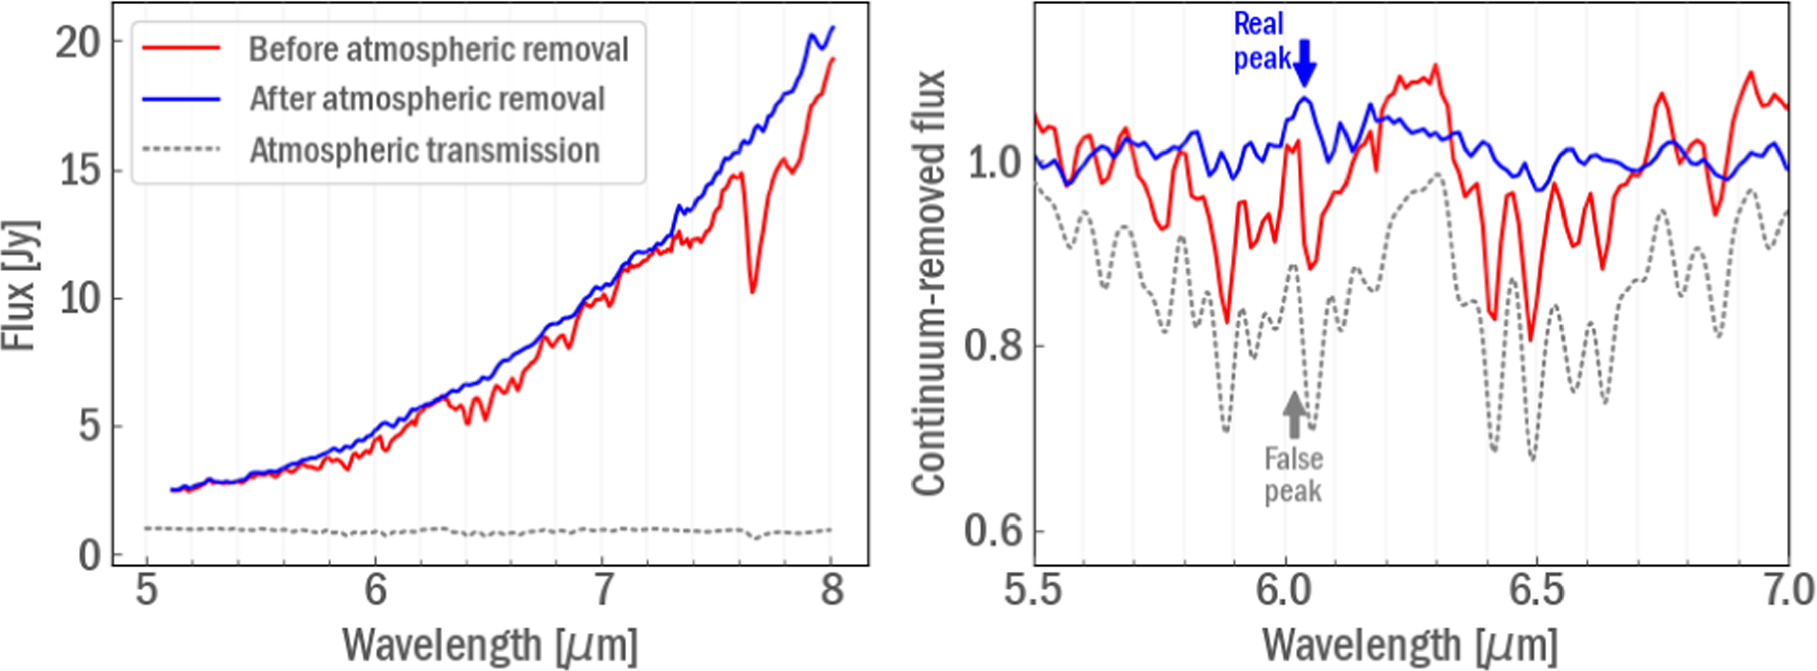
Figure 2. Left: comparison of a spectrum of Massalia before (red) and after (blue) correction of atmospheric transmission (gray). Right: continuum-removed flux found by fitting a 2D polynomial to the red and blue spectra in the left panel and dividing it out. The continuum-removed spectra are unitless, as they have been normalized. The gray spectrum of atmospheric transmission has units of transmittance. After removing a spurious feature at 6.02 μm that is actually due to the atmosphere (gray arrow), a clear peak at 6.04 μm is visible (blue arrow).
Download figure:
Standard image High-resolution imageThe lack of overlap between the G063 and G111 grism creates a gap in the data between 8.0 and 8.4 μm and makes relative scaling between the grisms uncertain. We used photometry at 6.4 and 11.1 μm to guide scaling of the grism data, following the example in the SOFIA Data Analysis Cookbooks. 9 Extracted flux values and their uncertainties are given in Table 2. Uncertainties are a combination of the relative error in the photometry measurement, the relative error in the flux calibration, and the relative uncertainty in the flux calibration model, and a full description of the uncertainty calculation is given in the FORCAST-photometry-detailed cookbook. 10 We found that the uncertainty in the photometry was large enough that we required additional scaling. We fit extended, low-order polynomials to each grism and scaled by eye until they overlapped (e.g., Emery et al. 2014; Martin 2022). Because the G063 grism had smaller uncertainty than G111, we scaled G111 to match G063. In all cases, the scaling factor differed by <10% from the photometric point, which is consistent with scaling factors derived by other SOFIA studies (e.g., Woodward et al. 2021).
Table 2. Values of Flux at 6.4 and 11.1 μm Extracted from Photometry
| Object | F063 Flux (Jy) | F111 Flux (Jy) |
|---|---|---|
| (7) Iris | 13.546 ± 0.700 | 124.118 ± 6.412 |
| (11) Parthenope | 1.981 ± 0.108 | 22.873 ± 1.184 |
| 0.603 ± 0.037 | ||
| 0.614 ± 0.044 | ||
| (18) Melpomene | 1.395 ± 0.078 | 15.708 ± 0.827 |
| 1.363 ± 0.081 | ||
| 1.226 ± 0.070 | ||
| (20) Massalia | 7.824 ± 0.405 | 67.419 ± 3.484 |
Download table as: ASCIITypeset image
3. Continuum Removal
For main-belt asteroids, spectral flux is dominated by reflected sunlight in the NIR and by thermal emission in the MIR. We use the Near-Earth Asteroid Thermal Model (NEATM; Harris 1998) to solve the energy balance between incident solar radiation, reflected sunlight, and thermal emission. A simple thermal model (STM) assumes a smooth, spherical body that does not rotate and is observed at a phase angle, α, of 0. A beaming parameter, η, is a normalization factor that accounts for several factors that lead to a different temperature distribution assumed, including roughness, nonzero thermal inertia (including emission from the night side), nonspherical shape, etc. The NEATM is similar to the STM, but it does not assume α = 0 and allows η to be fit as a free parameter, allowing for information about the objects' physical properties to be inferred.
We used the THERMOPS code from Marco Delbo, available at his personal website, 11 to fit the NEATM to our scaled spectra. For more information about THERMOPS, including tests used to validate the code, we direct the reader to the README document that comes with the code downloaded from the website. The code tests a range of albedo (pV ) and η values and returns the pair with the lowest χ2 residual, along with calculated D (diameter of the sphere with projected area equivalent to the projected area of the asteroid at the time of the SOFIA observation) and error estimates for the three parameters. We calculated error for D and η by taking the flux and multiplying by either 0.9 or 1.1 and then fitting NEATM to those. We take the difference between the resulting D values and η values to be the error in the measurement due to the 10% scaling uncertainty. The spectra along with NEATM fits are shown in Figure 3.
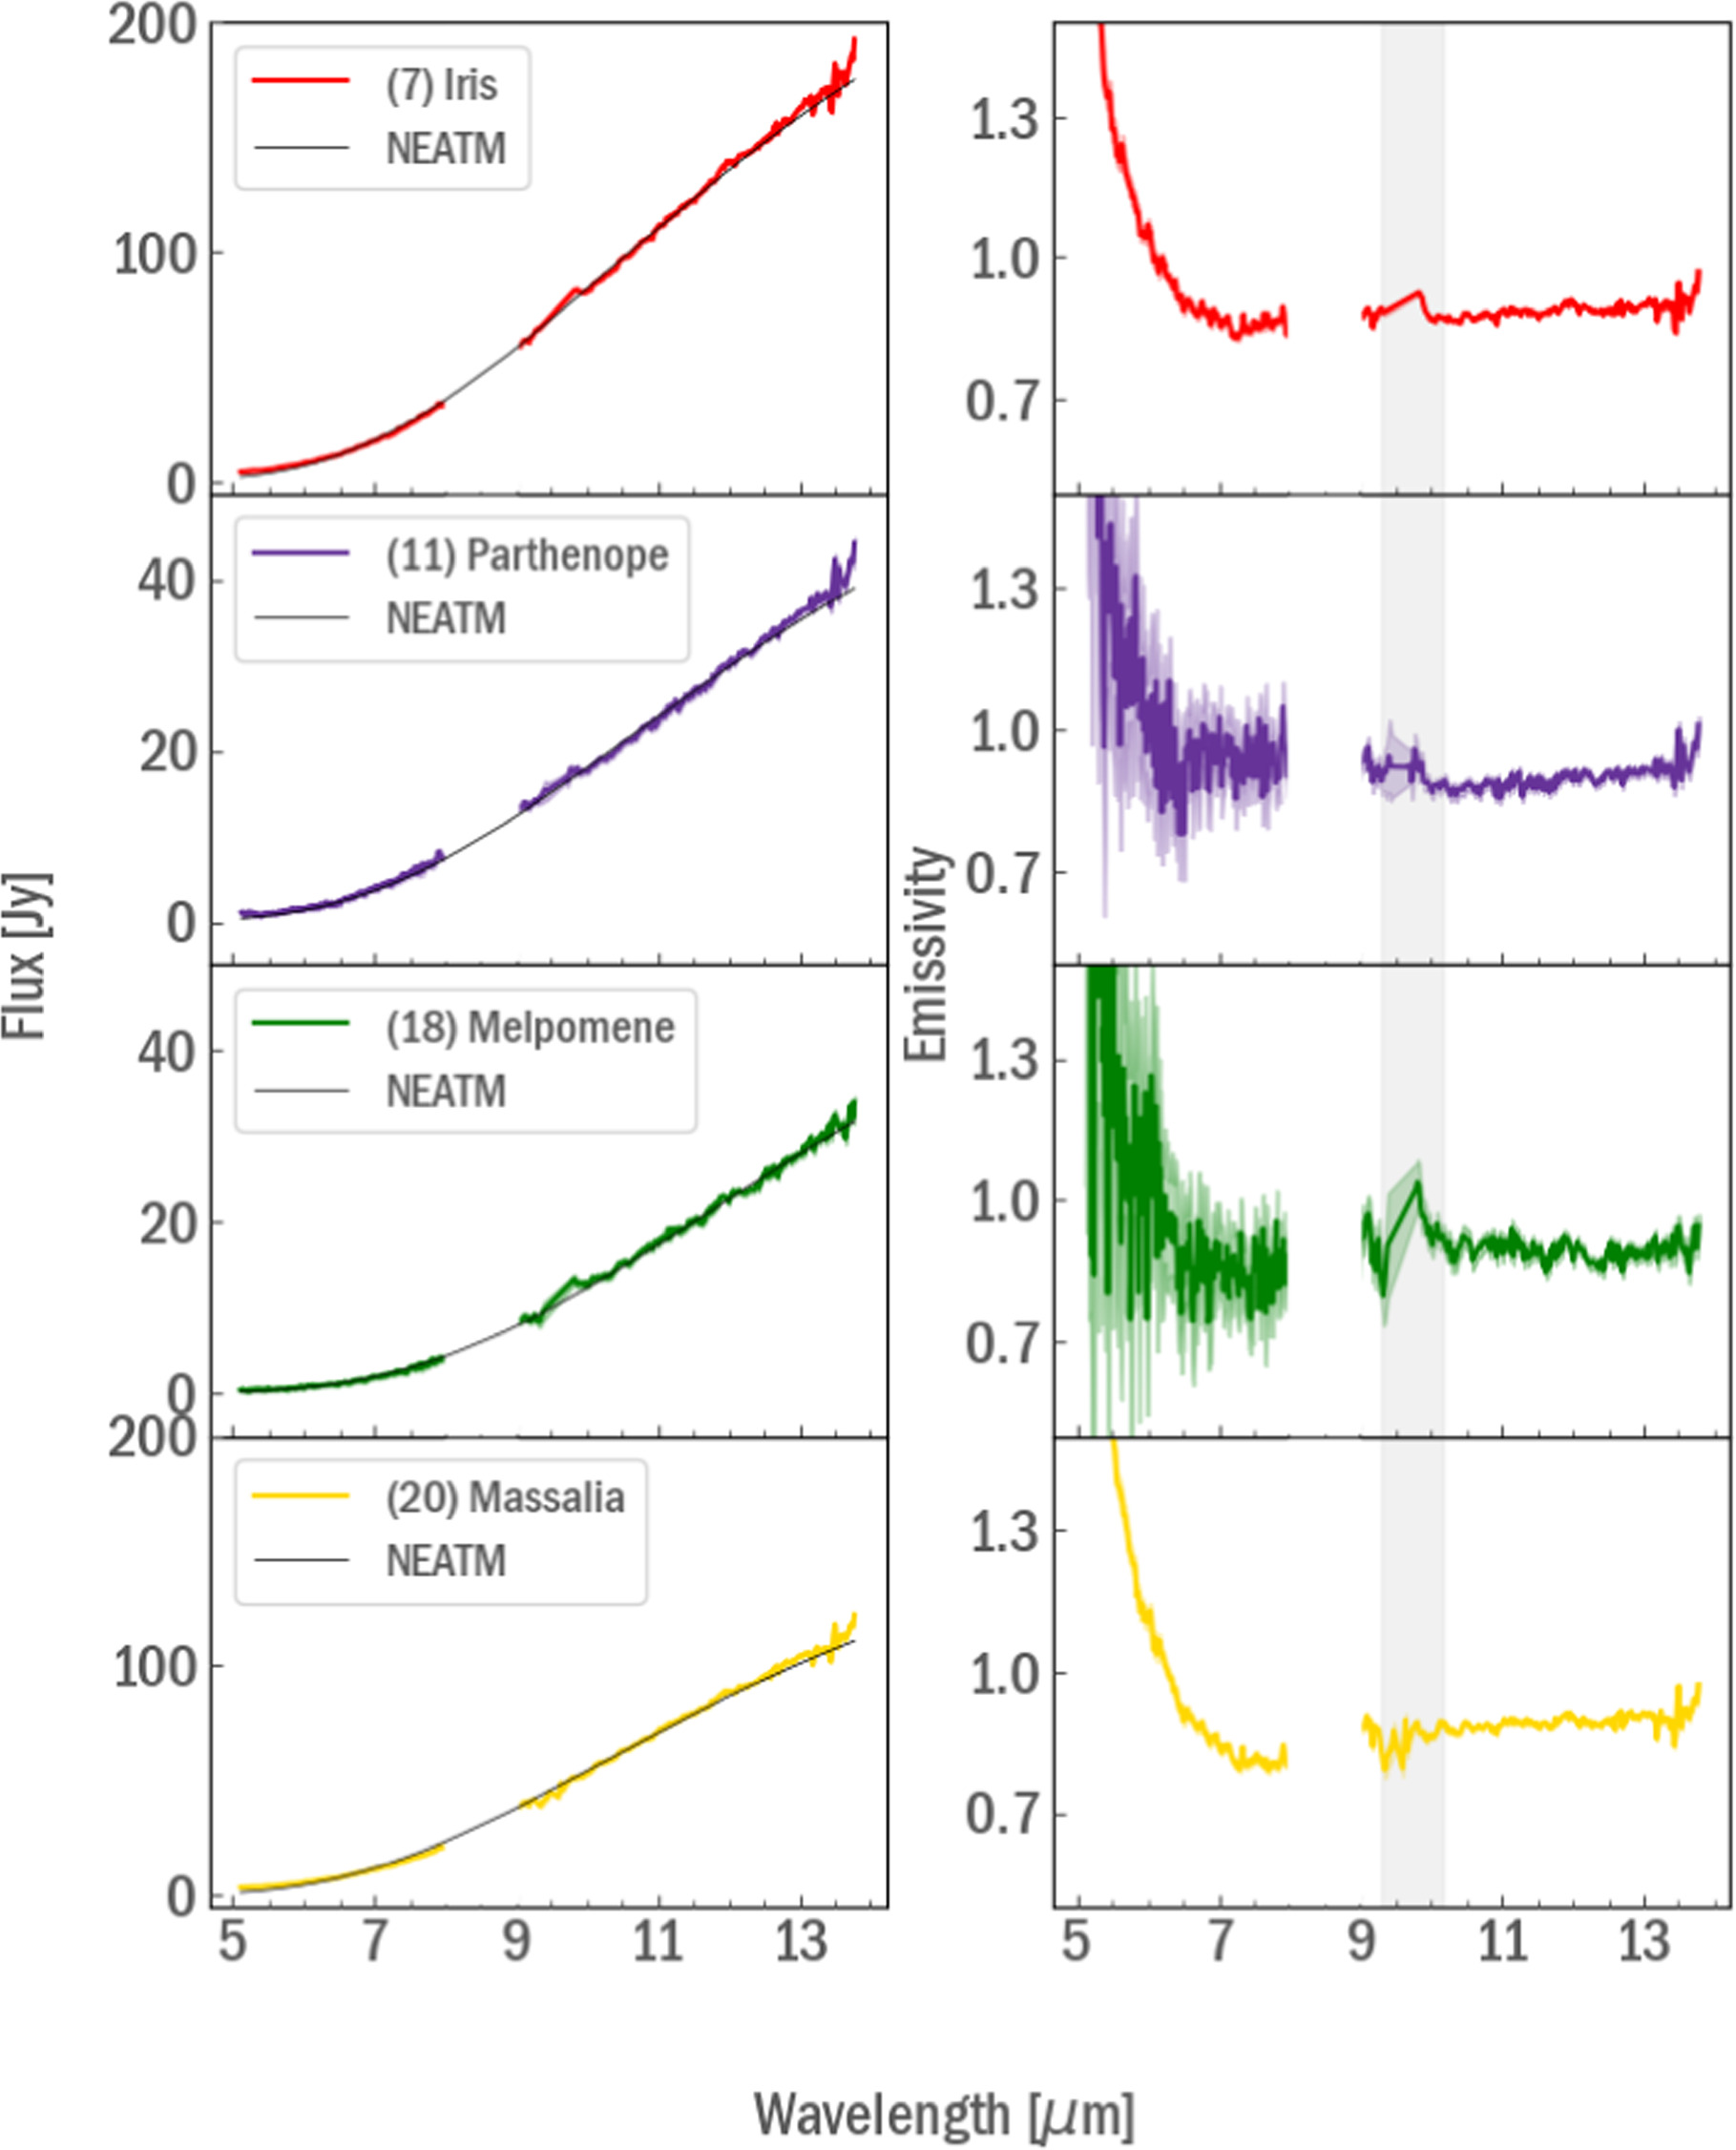
Figure 3. Left: scaled flux for each asteroid (colors) compared to the best-fit NEATM (black). Right: emissivity of each asteroid found by dividing observed flux by modeled flux. The shaded colored region indicates ±1σ. The gray shaded region indicates atmospheric absorption where transmission is <80% and emissivity is unreliable.
Download figure:
Standard image High-resolution imageFor Parthenope and Melpomene, data were taken over multiple nights (Table 1). We fit a NEATM model for each night, resulting in three different values for pV and η. Because G111 data were obtained on only one of the nights, we only report that night's derived parameters in Table 3.
Table 3. Derived Properties from the NEATM Models
| Asteroid | Source | H | D (km) | pV | η |
|---|---|---|---|---|---|
| (7) Iris | This work | 5.64 | 220.337 ± 11.252 | 0.202 ± 0.146 | 1.365 ± 0.015 |
| (b) | 5.53 | 239 | 0.193 | 1.03 | |
| 5.53 | 226.2 | 0.212 | 0.806 | ||
| (d) | 5.51 | 199.83 ± 10.0 | 0.276 6 ± 0.030 | 0.756 a | |
| (11) Parthenope | This work | 6.73 | 165.169 ± 8.410 | 0.132 ± 0.063 | 0.955 ± 0.007 |
| (a) | 6.60 | 142.89 ± 1.01 | 0.19 ± 0.02 | 0.78 ± 0.02 | |
| (b) | 6.55 | 157.4 | 0.171 | 0.77 | |
| (c) | N.A. | 131 ± 10 | 0.18 | 0.74 ± 0.04 | |
| (d) | 6.55 | 153.33 ± 3.1 | 0.180 3 ± 0.007 | 0.756 a | |
| (18) Melpomene | This work | 6.34 | 193.082 ± 9.669 | 0.138 ± 0.171 | 1.439 ± 0.010 |
| (a) | 6.50 | 139.59 ± 2.45 | 0.23 ± 0.03 | 0.95 ± 0.05 | |
| (c) | N.A. | 149.2 ± 8 | 0.22 | 0.65 ± 0.04 | |
| (d) | 6.51 | 140.57 ± 2.8 | 0.222 5 ± 0.009 | 0.756 a | |
| (20) Massalia | This work | 6.54 | 164.406 ± 8.251 | 0.158 ± 0.136 | 1.336 ± 0.011 |
| (a) | 6.50 | 135.680 ± 3.674 | 0.241 ± 0.018 | 1.0 ± 0.2 | |
| (c) | N.A. | 154.4 ± 14 | 0.21 | 0.80 ± 0.03 | |
| (d) | 6.50 | 145.50 ± 9.3 | 0.209 6 ± 0.030 | 0.756 a |
Note. Published values for each asteroid are given from (a) NEOWISE: Masiero et al. (2012, 2014), (b) Vernazza et al. (2010), (c) Lim et al. (2005), and (d) Supplemental IRAS Minor Planet Survey (SIMPS): Tedesco et al. (2002).
a This study used the STM instead of the NEATM, where η is a fixed value derived empirically from radiometry of asteroids whose diameters were known from other observation methods.Download table as: ASCIITypeset image
We divide the best-fit NEATM model from the observed flux to obtain an emissivity spectrum for each asteroid (Figure 3). The emissivity spectra are normalized to 0.9 at 12 μm, a reasonable assumption for silicates (e.g., Landsman et al. 2018). For the final emissivity spectrum of Parthenope and Melpomene, we took a weighted average of all three nights of G063 emissivity and concatenated with G111 emissivity. We note that the rotation of the asteroid between nights could cause a difference in spectra if the surface material of the asteroid is not distributed homogeneously. Combining the spectra is the only way to increase our signal-to-noise ratio enough to see mineralogical features, so we assume a homogeneous surface composition across the asteroids.
The derived albedos and diameters are given in Table 3, along with published values from multiple sources. Our derived parameters do not always match parameters derived by other studies. Differences between our results and published results may be due to different input parameters, such as the value of H, which was different between all studies (Table 3). According to Masiero et al. (2021), uncertainties on values of H can be of order 0.02 mag. To test whether this could explain the differences between our values and published values, we run the analysis for values of H ± 0.02. We found that in all cases this change in H did not account for the differences between our values and published values. We did a similar test for the value of G and found the same result. A larger source of uncertainty in H is from rotational effects. We do not know the rotational phase, so the actual reflected flux could be different from the value estimated from H by ± half the light-curve amplitude. The amplitudes of these objects from the asteroid light-curve database (Warner et al. 2009) are 0.29 for Iris, 0.12 for Parthenope, 0.34 for Melpomene, and 0.27 for Massalia. We use these numbers divided by 2 as uncertainty in H. Other studies' choices of emissivity would also cause the derived pV to vary; for example, Lim et al. (2005) used an emissivity of 0.95 for high-albedo asteroids, while we chose an emissivity of 0.9 based on the work of Masiero et al. (2011). We note that some studies, such as Vernazza et al. (2010), observe the same object with different telescopes and lead to different measured parameters. Other studies, such as Licandro et al. (2012), also report measured parameters that differ from previous measurements by large surveys. For robustness, we ran the NEATM again for our asteroids using the pV from other studies but allowing η to vary. In all cases, we were unable to find a good fit using the published pV . Because the main focus of this study is to detect and characterize the 6 μm feature and not to thermally model asteroids, we continue our analysis despite these discrepancies.
As seen in Figure 3, the NEATM does not fit the region <6.5 μm very well. We implemented a variety of methods to flatten this region to ensure that we do not mismeasure the size of potential features. The methods are described below.
3.1. NEATM Continuum Removal
To isolate the 6 μm water feature in the emissivity spectra, we fit a second-order polynomial between 5.65 and 6.5 μm (Figure 4) to represent the continuum and then divide it from the spectrum. This is similar to the method used by Honniball et al. (2021, 2022); however, they modeled continuum flux instead of emissivity. The resulting continuum-removed emissivity spectra are given in Figure 4. Two of the asteroids, Parthenope and Melpomene, are too noisy to draw any conclusions; however, there is a clear peak in emission around 6 μm in the spectra of Iris and Massalia.

Figure 4. Left: region of the spectrum used for continuum removal. The gray circles show the points used in the polynomial fit (5.65–6.5 μm). The polynomial fit excludes 5.9–6.25 μm. Right: continuum-removed emissivity for each asteroid. The shaded colored region indicates ±1σ. Iris and Massalia show prominent features near 6 μm (black arrows). Parthenope and Melpomene are too noisy to confidently identify a 6 μm feature.
Download figure:
Standard image High-resolution imageIt is possible that the upturn in the NEATM-derived emissivity spectrum is due to the contribution of reflected sunlight that is unaccounted for. We test this by obtaining a solar spectrum from the Total and Spectral Solar Irradiance Sensor (TSIS-1) acquired on the same dates as the SOFIA observations. After converting the observed solar signal into the appropriate units, we scale the solar spectrum acquired at 1 au to the expected reflected flux from each asteroid following Feldman et al. (2000), accounting for each asteroids angular size, heliocentric distance, and visible albedo as reported in JPL Horizons.
While for some asteroids the reflected sunlight can contribute up to 20% of the observed flux (e.g., Landsman et al. 2018), the reflected signals for these observations were <10% near 5 μm for all of the observations. We subtract the expected reflected signal from the observed flux and fit a NEATM model to the thermal flux only. We perform the same procedure as described in Section 3 to obtain an emissivity spectrum (Figure 5). The emissivity spectrum does not differ significantly from the spectra obtained by the other method, implying that reflected sunlight is not the cause for the upturn <6.5 μm.

Figure 5. Top left: spectrum of Iris from the IRSA archive (gray) compared to solar spectrum (yellow). The black line shows the solar-corrected spectrum of Iris found by subtracting the yellow spectrum from the gray spectrum. Top right: emissivity spectrum found by fitting the thermal spectrum only. The tail <6.5 μm is still present, suggesting that reflected sunlight is not the culprit. Bottom: comparison of the spectra of Iris resulting from the two methods of continuum removal explained in Sections 3.1 (blue) and 3.2 (yellow). The shaded colored region indicates ± 1σ. Both spectra are right at the edge of 1σ from the other.
Download figure:
Standard image High-resolution image3.2. Lunar Approach: Continuum from Flux
As a sanity check and to ensure that we are not missing any signal from the NEATM correction, we employ a different method to obtain emissivity. Instead of fitting a NEATM to the asteroid flux, we use a second-order polynomial to model the flux in the region between 5.0 and 7.6 μm following the procedure from Honniball et al. (2021, 2022). We divide this continuum out to reveal the continuum-removed flux that is a proxy for emissivity (Figure 6). We compare the result derived by this method to the emissivity derived from NEATM in Section 3.1 and show that they do not differ significantly (Figure 5), though they are both at the edge of 1σ from the other. Because the choice of removal method will affect the measured strength of the 6 μm band, we conservatively factor 0.01 into the uncertainty of the strength of the band. These two methods of obtaining an emissivity spectrum agree well with each other, increasing our confidence that the observed 6 μm feature is real and has the measured band strength and center.

Figure 6. Alternative method for removing the continuum flux. A 2D polynomial (black, left) was fit to the asteroid flux (colors, left) between 5.0 and 7.6 μm and divided out, leaving continuum-removed flux (right). The 6 μm feature is still present in the spectra of Iris and Massalia using this method. The shaded colored region indicates ±1σ.
Download figure:
Standard image High-resolution image4. Results
The cause of the tail at <6.5 μm could be that the NEATM is not able to fully reproduce the sensitive short end of the emissivity curve, or it could be that instrumental effects at short wavelengths cause the tail feature. Figure 5 shows that the strength of the 6 μm feature is not significantly different when derived with different continuum removal methods. Because multiple methods produce the same result, we are confident that the 6 μm feature buried in the tail is real. We use the NEATM-derived emissivity found in Section 3.1 for the results in this section, and we add an uncertainty of 0.1 to our measurements of band strength to cover the difference between the two methods.
4.1. 6 μm Feature
Figure 4 shows a prominent peak around 6.03 μm for both Iris and Massalia. For Melpomene and Parthenope, the data are too noisy to draw conclusions. Melpomene and Parthenope were significantly fainter than Iris and Massalia and required multiple nights to obtain enough signal. For those two objects, we conclude that the FORCAST instrument is not sensitive enough to detect a 6 μm feature, if it is present. We note that Parthenope was meant to be used as a control test, but due to the noise, we were unable to confidently exclude the presence of a 6 μm feature. Instead, we use archival observations of (4) Vesta as a control, which is described more in Section 5.2.
For Iris and Melpomene, we measure the band strength and center using the same methods as Honniball et al. (2021, 2022; see Figure 7). The results of a Gaussian fit to each band are given in Table 4.
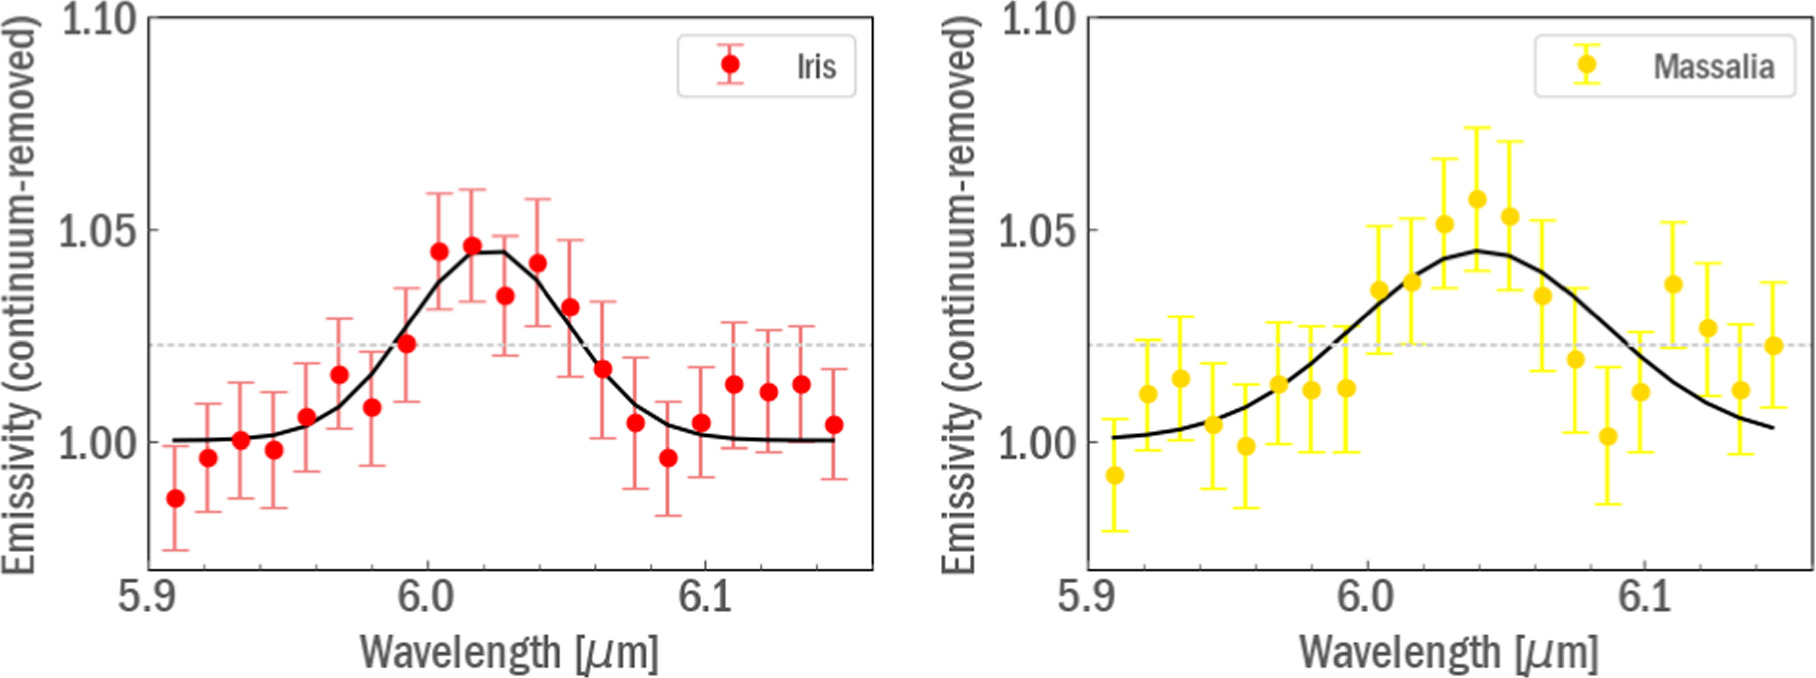
Figure 7. Gaussian fits to the Iris and Massalia spectra cropped from 5.9 to 6.15 μm. Band center is the mean of the fit. The dashed gray horizontal line indicates the FWHM.
Download figure:
Standard image High-resolution imageTable 4. Derived Parameters of the 6 μm Band for Iris and Massalia
| Object | Band Center (μm) | Band Strength (%) | Water Abundance (μg g−1) | FWHM |
|---|---|---|---|---|
| (7) Iris | 6.022 ± 0.003 | 4.532 ± 0.011 | 454 ± 202 | 0.068 |
| (20) Massalia | 6.041 ± 0.007 | 4.476 ± 0.012 | 448 ± 209 | 0.107 |
Download table as: ASCIITypeset image
We estimate the abundance of molecular water using an empirical relationship between band depth and H2O abundance found in laboratory studies of mid-ocean ridge basalt glass (Li & Milliken 2017) following the method used by Honniball et al. (2021). We convert our emission data to reflectance via Kirchoff's law:

where R is reflectance and E is our observed emission spectrum. We assume that the asteroid surface is similar to the lunar surface and therefore assume that Kirchoff's law is generally valid (Li & Milliken 2017; Bandfield et al. 2018). We fit a linear continuum between 5.9 and 6.15 μm and measure the depth of each band as

where Dpeak is the strength of the absorption feature and Dcontinuum is the mean of the continuum at the center of the absorption. The center of the absorption was found by fitting a Gaussian to the absorption. The relationship between band depth (Dband) and water abundance (Mwater) is

The calculated water abundance for Iris and Massalia is given in Table 4. Using the same relationship between band depth and H2O abundance, Honniball et al. (2021, 2022) estimate that the abundance of molecular water on the Moon is ∼100–400 μg g−1. Our derived abundances are consistent with abundance calculated for the Moon. The FWHM derived from our measurements is smaller than that of the Moon (0.253) and MORB glass (0.204) given in Table 1 of Honniball et al. (2021), though we note that the full range of FWHM from Honniball et al. (2021) is 0.127–0.438.
4.2. Other Mineralogy
The MIR region is diagnostic of surface composition. Three prominent features in this wavelength region are the Christiansen feature (CF), Reststrahlen bands (RBs), and transparency features (TFs). The CF is an emissivity maximum caused by the transition from surface scattering to volume scattering regimes, and it normally occurs between 7.5 and 10 μm in silicates. RBs are troughs in transmittance caused by fundamental molecular vibrations in silicates, and they occur between 8.5 and 12 μm. TFs are located between RBs and are emissivity minima. TFs only occur on bodies with small (<75 μm) particles and are caused by volume scattering dominating at those wavelengths.
Kremer et al. (2020) use laboratory measurements to explore the crossover region of NIR and MIR between 4 and 8 μm. They find that olivine exhibits two absorption bands at ∼5.6 and ∼6.0 μm that can shift by ∼0.1 μm to longer wavelengths with increasing Fe content. To ensure that the 6 μm band we detected is not due to olivine, Figure 8 shows our spectra compared to the spectrum of olivine from Kremer et al. (2020). The stronger peak at 5.6 μm in the olivine spectrum is not present in our asteroid spectra, ruling out the possibility that the 6 μm peak is due to olivine. Kremer et al. (2023) find pyroxene bands at ∼5.1 and ∼5.3 μm for high-Ca pyroxene and ∼5.2 μm for low-Ca pyroxene, all of which move to shorter wavelengths as Mg content increases. There is a feature near 5.2 μm in the spectra of Iris and Massalia that could be due to low-Ca pyroxene. We note that comparisons to laboratory data are not definite, as laboratory data are often taken at ambient conditions. The pyroxene samples from Kremer et al. (2020, 2023) were measured in a CO2- and H2O-free environment but may still contain some adsorbed water depending on how the sample was dried out.

Figure 8. Comparison of laboratory spectra from Kremer et al. (2020, 2023) and our asteroid spectra that show 6 μm features. Laboratory reflectance spectra were converted to emissivity using Kirchoff's law. The strong 5.6 μm peak in the olivine spectrum is not present in the asteroid spectra. Arrows indicate features that change center based on Fe and Mg content. Spectra from other sources were digitized using WebPlotDigitizer from Marin et al. (2017).
Download figure:
Standard image High-resolution imageUnfortunately, there was no overlap in the grisms between 8.01 and 8.78 μm, so that part of the spectrum is missing from our data set. Similarly, the region between 9.28 and 10.16 μm is omitted owing to atmospheric opacity being greater than 80%. The remaining data points are shown in Figure 9. All four objects show a maximum near 9.1 μm, which is consistent with the CF features for certain compositions of olivine and pyroxene (e.g., Martin et al. 2022, 2023, and references therein). In the MIR wavelength range, a >5% spectral contrast for the CF has been noted for only about ∼10 main-belt asteroids (Takahashi et al. 2011). The CFs in Parthenope, Massalia, and Iris have a relatively small spectral contrast, indicating that these surfaces may have fine grains (e.g., Martin et al. 2022, 2023). The relative strength of the CF in Melopmene may indicate larger grains on this asteroid.

Figure 9. MIR spectra of the four asteroids (offset for clarity). Missing sections are due to grism nonoverlap and atmosphere. The spectra have a CF around 9.1 μm. The shaded colored region indicates ±1σ.
Download figure:
Standard image High-resolution imageVNIR spectroscopy indicate the following mineralogies for the asteroids in our study: (7) Iris is consistent with LL-chondrite-like mineralogy including olivine and pyroxene (Noonan et al. 2019); (11) Parthenope appears to have some orthopyroxene in addition to olivine (Vernazza et al. 2010) and hydrated silicates via absorption bands at 0.43 and 0.7 μm (Busarev 2002); (18) Melpomene has 1 and 2 μm bands and may be consistent with a basaltic composition (McAdam et al. 2023); (20) Massalia has more olivine than pyroxene present (McAdam et al. 2023) and may be related to L ordinary chondrites (Gaffey & Fieber-Beyer 2019) or H ordinary chondrites (Hyden et al. 2020). de León et al. (2010) compute VNIR spectral parameters of the asteroids, including band I and band II (pyroxene absorption bands at 1 and 2 μm) centers, depths, and band area ratios. The higher abundance of olivine may be driving the stronger CF feature in the MIR spectrum of Melpomene. The mixture of olivine and pyroxene in this wavelength region may dampen the strength of CFs and RF bands for S-type asteroids. Indeed, the lack of strong features at ∼10–13 μm may be driven by the mixtures as well. Detailed mixture analyses of olivine and pyroxene are beyond the scope of this paper but could yield more insights into the surface composition of these asteroids in the future.
Iris has previously been observed in the MIR by Takahashi et al. (2011) and Vernazza et al. (2010). Takahashi et al. (2011) report possible peaks around 8.5–9 μm and 11.5–12 μm but do not speculate as to their cause. The spectrum of Iris from Vernazza et al. (2010) also exhibits a feature around 8.5 μm, but the feature near 12 μm is unidentifiable. Our spectrum of Iris does not have data at 8.5 μm, but the feature near 12 μm might be there. Parthenope, Massalia, and Melpomene were observed in the MIR by the same studies and also Lim et al. (2005), none of which reported any identifiable features.
5. Discussion
5.1. Comparison to Spitzer Spectrum
We have shown in Figure 2 that our reduction methods successfully minimized atmospheric contribution to our final spectra. To further ensure that the feature we see in the spectra is not due to atmospheric contamination, we compare with a Spitzer spectrum of Iris. The Spitzer spectrum has no atmospheric contamination, because the telescope is in space. We obtained the fully processed spectrum from the Spitzer Heritage Archive. 12 The analysis of the Spitzer spectrum is the same as for the SOFIA spectra (i.e., Section 3), except that we changed the limits of the polynomial fit to 5.65–6.75 μm to encompass the full Spitzer feature.
Figure 10 shows the flux, emissivity, and continuum-removed emissivity for the Spitzer spectrum of Iris. Also included is the continuum-removed emissivity for the SOFIA spectrum of Iris found with the same polynomial fit of 5.65–6.75 μm. The Spitzer spectrum shows either a broad feature centered near 6.1 μm or two overlapping features centered at 6.0 and 6.2 μm. The SOFIA spectrum might show a second bump at 6.2 μm, but it is near the noise level; therefore, we are not confident that this is the same peak seen in the Spitzer spectrum.. The location of the feature in the SOFIA spectrum at 6.02 μm agrees well with the first bump in the Spitzer spectrum, increasing the likelihood that it is indeed the 6 μm feature we are looking for.
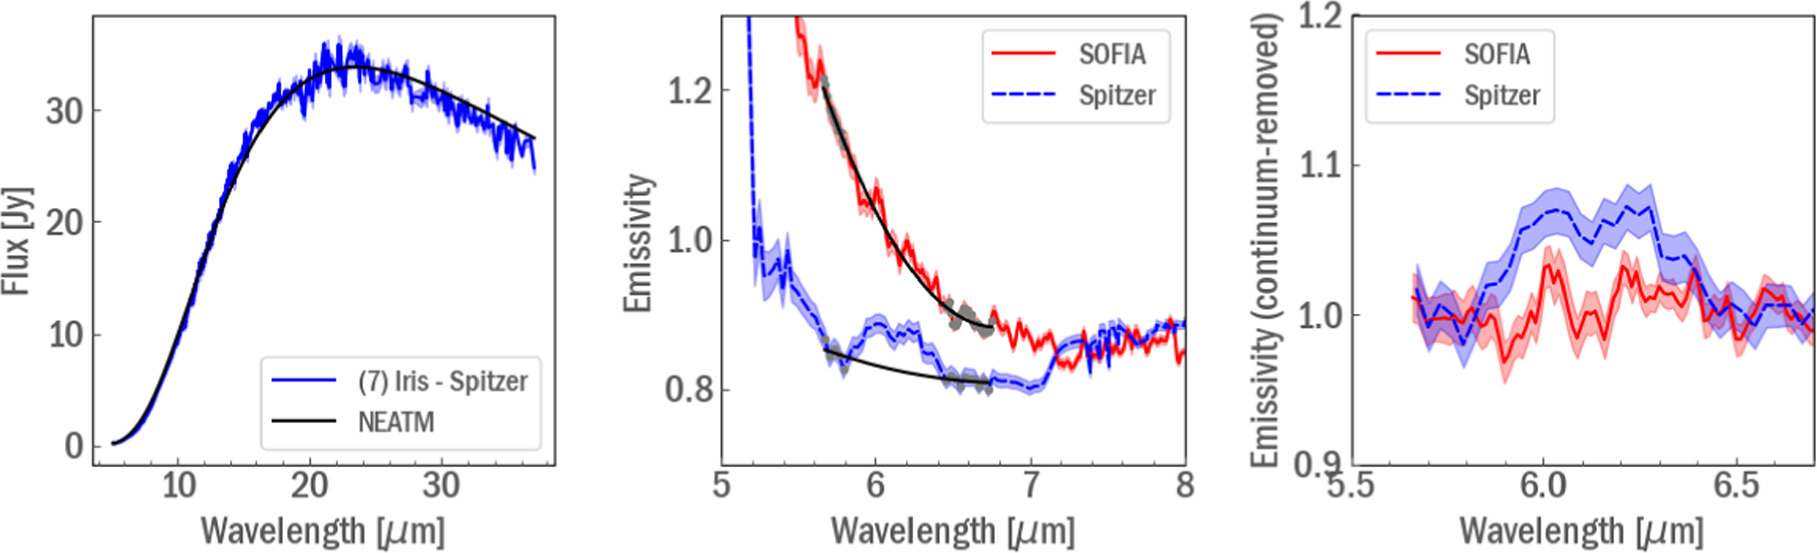
Figure 10. Flux (left), emissivity (middle), and continuum-removed emissivity (right) for the Spitzer spectrum of Iris (blue) compared to the SOFIA spectrum of Iris (red). The Spitzer spectrum potentially shows a feature at the same location as the SOFIA spectrum but also includes a second bump near 6.25 μm.
Download figure:
Standard image High-resolution imageThe Spitzer spectrum was originally published by Vernazza et al. (2010); however, they limited their analysis to the 8–14 μm range. They report that the spectrum shows evidence of a moderate reddish slope between 8 and 8.7 μm, then a flat continuum with small emission features around 10.5 and 11.7 μm. They attempt to constrain composition using a linear retrieval algorithm and find a best fit consisting of 38% olivine, 20% pyroxene, 33% feldspar, 9% chromite, and 0% iron. A similar analysis for the spectra presented in this paper is outside the scope of this study.
We are unsure what the second bump at 6.2 μm is attributed to. The 6 μm feature on the Moon from Honniball et al. (2021, 2022) was not nearly as broad as in the Spitzer spectrum and does not have a second peak at 6.2 μm. Regardless, we believe that the feature in the SOFIA spectrum is indeed the 6 μm feature indicative of molecular water.
5.2. Comparison to Vesta Spectrum
As a further check of our methods, we also compare our spectrum to that of (4) Vesta taken with SOFIA by Vernazza (2014). Vesta is a basaltic asteroid with a complicated hydration picture. Ground-based observations of Vesta (Lebofsky 1980; Feierberg et al. 1985; Hasegawa et al. 2003; Rivkin et al. 2006) are limited and complicated owing to Earth's atmosphere. NASA's Dawn mission was able to detect OH on Vesta (De Sanctis et al. 2012) via a ∼5% 2.8 μm feature that varied across the surface. The Dawn mission did not report detection of H2O on Vesta's surface, though the instruments on board were capable.
We acquired the flux-calibrated Vesta spectrum from the IRSA archive and applied the same analysis as in Section 3.1. Figure 11 shows the flux of Vesta with the best-fit NEATM, the emissivity spectrum with points between 5.65 and 6.5 μm used to fit a second-order polynomial, and the continuum-removed emissivity of Vesta compared to that of Massalia. The Vesta spectrum does not show a peak in the same place as Iris and Massalia and is flat across the entire 5–6–6.2 μm region. The lack of a 6 μm feature in the spectrum of Vesta increases our confidence that the 6 μm feature found on Iris and Massalia is real.
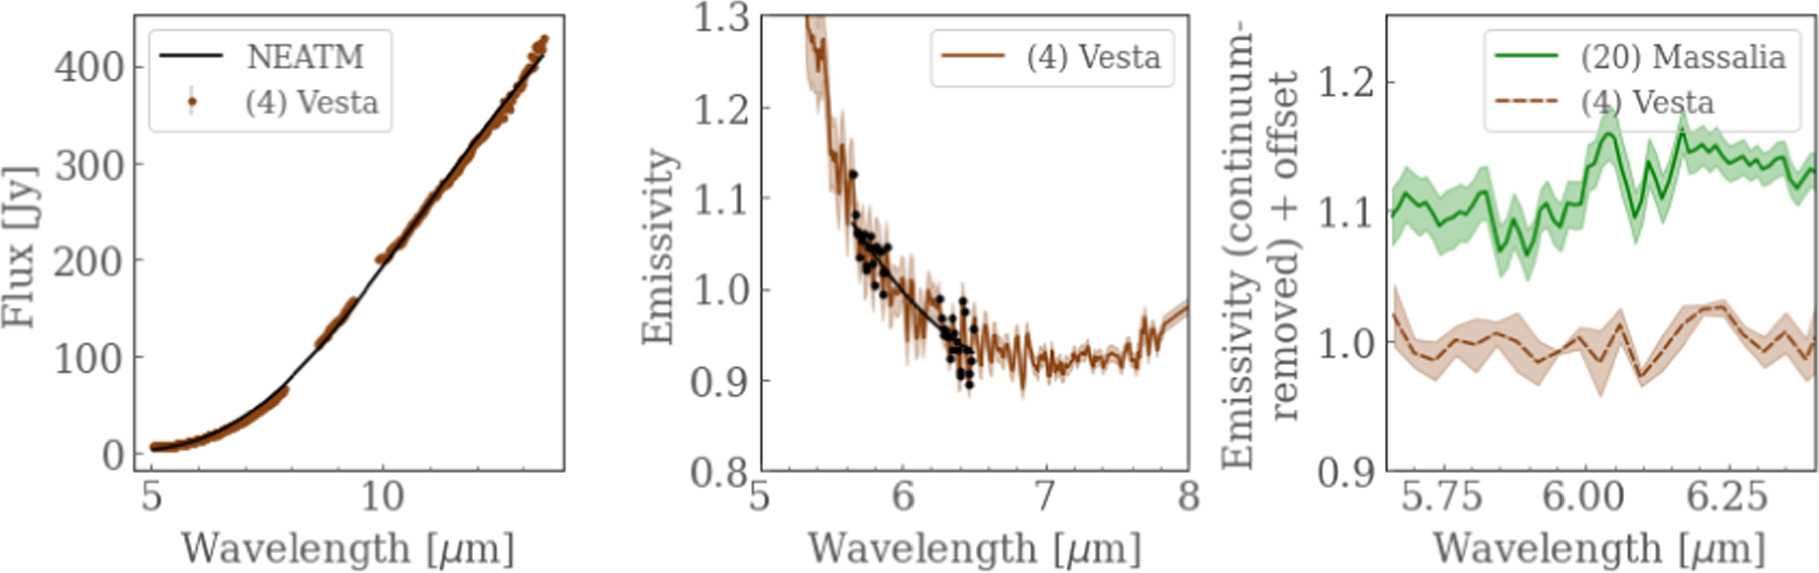
Figure 11. Left: SOFIA flux-calibrated spectrum of Vesta. Middle: black circles show the points used to fit a second-order polynomial (black line) to the emissivity spectrum (brown) that was found by dividing flux by NEATM modeled flux. Right: continuum-removed emissivity of Vesta (brown) compared to Massalia (green). The Vesta spectrum does not show a feature at 6 μm, as expected.
Download figure:
Standard image High-resolution image5.3. The 6 μm Feature on Other Solar System Bodies
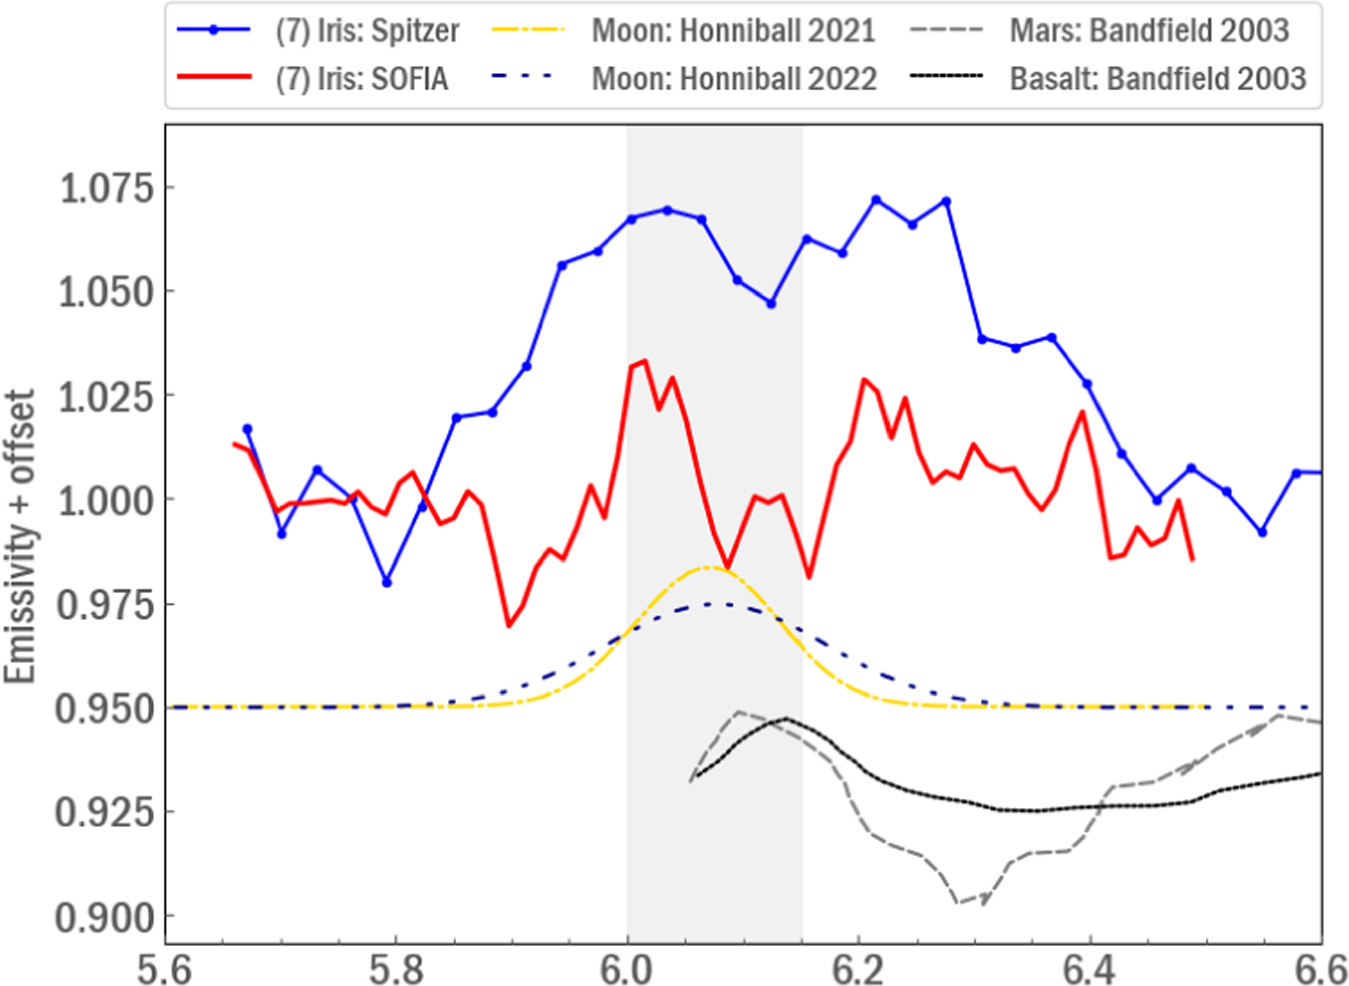
Previous observations of solar system objects have successfully identified 6 μm features (Bandfield et al. 2003; Honniball et al. 2021, 2022, Figure 12). The variety of band shapes, centers, and strengths in this sample shows that more observations in this wavelength region are needed to fully understand the distribution of water in the solar system. For example, the features detected by Honniball et al. (2021, 2022) on the sunlit Moon are broader than the features detected on asteroids in this study. Further, the difference in band center between all objects in Figure 12 is an open question. More laboratory investigations of the size and shape of the 6 μm band with regard to composition, temperature, and grain size will greatly improve the understanding of how the feature behaves on different planetary bodies.
Figure 12. Previous detections of a 6 μm feature on solar system bodies. The shape and band center differ even among the same type of object. The gray region indicates band centers from Honniball et al. (2021, 2022). Spectra from other sources were digitized using WebPlotDigitizer from Marin et al. (2017).
Download figure:
Standard image High-resolution image
5.4. The Location of Molecular Water on the Surface
The detected water molecules could reside in three reservoirs: (1) adsorbed on silicate surfaces, (2) trapped or dissolved in silicate impact glass, or (3) chemically bound to a mineral (Dyar et al. 2010; Daly & Schultz 2018; Lucey et al. 2022). Water molecules adsorbed on silicate surfaces are able to ballistically hop owing to high temperatures (Watson et al. 1961). If particles do not have sufficient energy to escape, they can fall back to the surface. Water inside of silicate impact glass is created when the heat of an impactor creates a glass bead that traps the material inside it. Water in these beads could have originated from the impactor itself, or could be created from surface hydroxyl and impact energy (Daly & Schultz 2018). Lastly, on the Moon water that is chemically bound in minerals is found at pyroclastic deposits and central peaks providing a view of water in the interior of the Moon. However, on asteroids these geologic features are not expected and the spectral properties of 6 μm water in impact glass and chemically bound in minerals are likely similar, and thus it is hard to distinguish which reservoir the water is in.
The findings of Honniball et al. (2021, 2022) suggest that lunar water most likely originates from the second reservoir, due to a trend with temperature; however, they note that remote sensing methods are unable to distinguish between water trapped within glasses and water trapped between grains. Our asteroid data do not cover the range of temperatures necessary to test the hypothesis related to reservoir 1. Similarly, we cannot be sure of the number of impacts on our asteroids (compared to known craters on the Moon) to strengthen the hypothesis with reservoir 2. We do, however, have access to meteorites with asteroid-like compositions. S-type asteroids are most often associated with ordinary chondrite (OC) meteorites, which are the most abundant type in the meteorite collection. OC meteorites are less likely to have water than carbonaceous chondrite (CC) meteorites, suggesting that reservoir 3 is not the location of asteroidal surface water. However, we caution that any water that may have been on an OC meteoroid almost certainly would not have survived reentry, so comparison to meteorites is not definitive. Furthermore, recent work by Che & Zega (2023) found NaCl crystals in the interior of particles returned from S-type asteroid Itokawa, which likely formed through precipitation from an aqueous fluid. Therefore, the location of asteroidal surface water remains an open question.
6. Conclusion
We report the first detection and characterization of a 6 μm water band on two nominally anhydrous asteroids. We employed numerous checks to increase confidence that the feature is real, including comparison to a dry asteroid and comparison to Iris from a space-based telescope. The spectra of Iris and Massalia show the 6 μm feature indicative of molecular water, with peak heights of 4.532% ± 0.011% and 4.476% ± 0.012%, respectively. The abundance of water derived from the band strength of the 6 μm features (454 ± 202 μg g−1 for Iris and 448 ± 209 μg g−1 for Massalia) is consistent with that which was found on the sunlit Moon using the same methods. Future work with JWST will increase the number of known asteroids with a 6 μm feature to unambiguously detect H2O on their surfaces. These studies will increase our understanding of the distribution of water in the solar system.
Acknowledgments
This work was based on observations made with the NASA/DLR Stratospheric Observatory for Infrared Astronomy (SOFIA). SOFIA is jointly operated by the Universities Space Research Association (USRA), Inc., under NASA contract NNA17BF53C, and the Deutsches SOFIA Institut under DLR contract 50 OK 0901 to the University of Stuttgart. Financial support for A.A. and M.M.M. for this work was provided by NASA through award No. SOF 09-0176 issued by USRA. A.A. would also like to thank the FORCAST instrument team, especially N. Karnath, W. Lim, and J. Radomski, for their work on executing these observations and producing data products. The results presented in this document included data measured from the Total and Spectral Solar Irradiance Sensor (TSIS-1). These data are available from the TSIS-1 website at https://lasp.colorado.edu/tsis/data/. These data were accessed via the LASP Interactive Solar Irradiance Datacenter (LISIRD; https://lasp.colorado.edu/lisird/).
Footnotes
- 7
- 8
- 9
- 10
- 11
- 12