


Abstract
Using a volume-limited sample of 263 field-age brown dwarfs defined by parallaxes, we provide updated polynomials for CatWISE W1 and W2 absolute magnitudes as a function of spectral type. Our fits are consistent with previous relations and apply to a wider M6–Y1 spectral type range.
Export citation and abstract BibTeX RIS

Original content from this work may be used under the terms of the Creative Commons Attribution 4.0 licence. Any further distribution of this work must maintain attribution to the author(s) and the title of the work, journal citation and DOI.
1. Introduction
Brown dwarfs are self-gravitating objects whose masses (≲70 MJup; Dupuy & Liu 2017) are not sufficient for hydrogen fusion to occur. Empirical relations between spectral type and absolute magnitude are vital for determining the physical properties of brown dwarfs whose faintness and redness make their distances expensive to measure via parallax (Dupuy & Liu 2012; Faherty et al. 2016; Liu et al. 2016). The advent of Gaia (Gaia Collaboration et al. 2016) and infrared parallax surveys have enabled the creation of volume-limited samples of brown dwarfs (e.g., Best et al. 2021; Kirkpatrick et al. 2021) from which updated empirical relations can be determined and easily applied to new discoveries. The recent CatWISE2020 catalog (Marocco et al. 2021) has expanded and deepened our mid-infrared view of brown dwarfs, in particular at the cool end, warranting an update of spectral type versus absolute magnitude relations for WISE photometry.
2. Sample
Starting with a sample of over 2000 M, L, T, and Y dwarfs from the literature, cataloged in a forthcoming update of the UltracoolSheet, 4 we extracted objects with decl. between −30 deg and +60 deg and parallax-determined distances less than 25 pc. This volume-limited sample includes spectral types M6–Y1. We used optical spectral types for M and L dwarfs when available and infrared otherwise. We used infrared spectral types for T and Y dwarfs. We excluded objects that are known binaries, have not been confirmed as single using high-angular resolution imaging, and have spectral types indicating peculiarities or unusually blue or red colors. We additionally excluded WISE J185101.83+593508.6, an L9 dwarf that is a strong candidate binary (Thompson et al. 2013; Leone et al. 2021), and V* V1274 Her, a variable M7 that appears ≈3 mag overluminous in WISE photometry. Finally, we selected objects with CatWISE photometry (Marocco et al. 2021) to create a clean sample of 263 field objects with W1 photometry and 273 field objects with W2 photometry.
3. Analytical Methods and Results
We used the methods described in Feeser & Best (2022) to determine polynomial functions for the sample of field objects in each band. Briefly, we include uncertainties of both absolute magnitudes and spectral types using the Monte Carlo approach of Dupuy & Liu (2012) by re-sampling normally distributed absolute magnitude errors and uniformly distributed spectral type errors to produce 104 re-sampled points for each object. We then performed a least-squares fit using these re-sampled points to obtain a final fourth degree polynomial function for each band. The polynomials are

where x is a numerical spectral type: M6 = 6, L0 = 10, T1 = 21, etc. These were the lowest order polynomials that captured the major trends in the data.
Figure 1 compares our polynomial fits to previous relations from Feeser & Best (2022). For each polynomial, we show an rms over all valid spectral types as well as rms for five smaller spectral type ranges. We find that these fits are strongly consistent with our previous relations determined in Feeser & Best (2022), but are applicable for a wider spectral type range by including late-M and Y dwarfs. Additionally, we achieve a lower rms for T5–T9 dwarfs for W1-band and for T0–Y0 for W2-band. Finally, our polynomials confirm that the image processing underlying CatWISE photometry provides a refinement of AllWISE photometry (Wright et al. 2010; Cutri et al. 2013) for ultracool dwarfs without altering the W1- and W2-band luminosities.
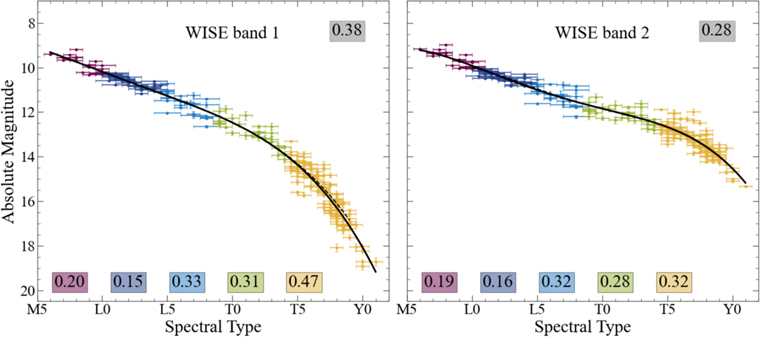
Figure 1. Polynomial fits for absolute magnitude as a function of spectral type for M6–Y1 field objects with parallax measurements and CatWISE photometry (solid line). We find these are consistent with the previous work of Feeser & Best (2022, dashed line). We provide the rms about the fit for five spectral types ranges: <L0, L0–L4, L4.5–L8, L8.5–T4, ≥T4.5 along the bottom (with colors corresponding to the data); and for the total rms about the fit over all spectral types, indicated in the upper right corner.
Download figure:
Standard image High-resolution image
This work has benefited from The UltracoolSheet, maintained by Will Best, Trent Dupuy, Michael Liu, Aniket Sanghi, Rob Siverd, and Zhoujian Zhang, and developed from compilations by Dupuy & Liu (2012), Dupuy & Kraus (2013), Liu et al. (2016), Best et al. (2018, 2021), and Sanghi et al. (2022, submitted).