


Abstract
We report three new FRBs discovered by the Five-hundred-meter Aperture Spherical radio Telescope (FAST), namely FRB 181017.J0036+11, FRB 181118, and FRB 181130, through the Commensal Radio Astronomy FAST Survey (CRAFTS). Together with FRB 181123, which was reported earlier, all four FAST-discovered FRBs share the same characteristics of low fluence (≤0.2 Jy ms) and high dispersion measure (DM, >1000 pc cm−3), consistent with the anticorrelation between DM and fluence of the entire FRB population. FRB 181118 and FRB 181130 exhibit band-limited features. FRB 181130 is prominently scattered (τs ≃ 8 ms) at 1.25 GHz. FRB 181017.J0036+11 has full-bandwidth emission with a fluence of 0.042 Jy ms, which is one of the faintest FRB sources detected so far. CRAFTS has started to build a new sample of FRBs that fills the region for more distant and fainter FRBs in the fluence–DME diagram, previously out of reach of other surveys. The implied all-sky event rate of FRBs is  sky−1 day−1 at the 95% confidence interval above 0.0146 Jy ms. We also demonstrate here that the probability density function of CRAFTS FRB detections is sensitive to the assumed intrinsic FRB luminosity function and cosmological evolution, which may be further constrained with more discoveries.
Export citation and abstract BibTeX RIS

Original content from this work may be used under the terms of the Creative Commons Attribution 4.0 licence. Any further distribution of this work must maintain attribution to the author(s) and the title of the work, journal citation and DOI.
1. Introduction
Fast radio bursts (FRBs) are bright, millisecond-duration cosmological radio transients (see Cordes & Chatterjee 2019; Petroff et al. 2019; Zhang 2020 for reviews). The origin of FRBs remains a mystery (see Platts et al. 2019 for a summary of models). Based on their large dispersion measures (DMs) in excess of the expected corresponding Galactic contribution, their cosmological origin was first hypothesized and later confirmed (Lorimer et al. 2007; Thornton et al. 2013; Bassa et al. 2017; Chatterjee et al. 2017; Marcote et al. 2017; Tendulkar et al. 2017; Ravi et al. 2019; Marcote et al. 2020; Macquart et al. 2020).
Motivated by the "Lorimer burst" (Lorimer et al. 2007) and the confirmation of FRBs being a distinctive transient population (Thornton et al. 2013), a number of dedicated FRB surveys and searches have resulted in an increasing pace of discoveries (e.g., Spitler et al. 2014; Masui et al. 2015; Caleb et al. 2017; Farah et al. 2018; Ravi et al. 2019; CHIME/FRB Collaboration et al. 2019b; Farah et al. 2019), with the anticipation of the upcoming new CHIME sample being a substantial leap forward.
The last sentence in the abstract of Thornton et al. (2013)—"Characterization of the source population and identification of host galaxies offers an opportunity to determine the baryonic content of the universe."—has turned out to be both insightful and visionary. There exists an anticorrelation between DM and fluence of FRBs, which is consistent with DM being a proxy of distance (Shannon et al. 2018). The relation has a broad scatter, implying a broad range of intrinsic luminosity and/or energy functions of FRBs (see also Luo et al. 2018, 2020; Lu et al. 2020a, 2020b; Zhang et al. 2021). The observed sample is obviously limited by the available instruments. In addition to event rate and other intrinsic characteristics of FRBs, the instrumental gain, RFI, and detection algorithms all affect the apparent fluence distribution. Still, high-DM FRBs are most likely luminous and distant, thus crucial for extending the dispersion–fluence relation. For example, the source with the highest DM ∼2600 pc cm−3 (Bhandari et al. 2018; Caleb et al. 2018) detected thus far, FRB 160102, can be inferred to have an upper-limit of redshift z ∼ 3 (Zhang 2018).
The Five-hundred-meter Aperture Spherical radio Telescope (FAST; Nan et al. 2011; Li & Pan 2016; Li et al. 2019), while noncompetitive in terms of FRB discovery rate, is well suited for catching distant bursts. The brightest known FRB pulses can be detected up to z ∼ 10 (Zhang 2018), if they exist there. Based on a novel high-cadence CAL technique, the Commensal Radio Astronomy FAST Survey 10 (Li et al. 2018) aspires to cover the FAST sky (∼57% of the full sky) with the 19-beam receiver in drift scan mode and simultaneously obtain four data streams, namely Galactic HI, extragalactic HI, pulsar search, and transients, the last two of which are searched for FRBs. As a drift scan, CRAFTS spends most of its time off the Galactic plane (85% of observation time with ∣b∣ > 10°). In Zhu et al. (2020) the first FAST discovery—FRB 181123—was reported. In this paper, we report three new FRBs. Together, the four discoveries, with high-DM as well as low fluence, occupy a previously empty region (DME ∈ [1099.4 pc cm−3,1819.3 pc cm−3], Fluence ∈ [42 mJy ms, 200 mJy ms]) in the DM–fluence space.
We describe the observation and searching methods in Section 2 and the characteristics of the three new FRBs in Section 3. We discuss the all-sky FRB event rate expected for CRAFTS and the implications of these High-DM and low fluence FRBs in Section 4. The summary is in Section 5.
2. Observations
FAST's L-band receiver Array of 19-beams (FLAN; Li et al. 2018) covers a frequency band of 1.0–1.5 GHz. CRAFTS employs a novel high-cadence CAL injection technique invented by the survey team, which produced a system temperature measurement for each detected pulse. In this work, we search for FRBs in the pulsar data stream, with 0.122 MHz frequency resolution at 196.608 μs sampling interval. The raw data are of 8-bits sampling with full polarization, reaching a data rate of ∼300 GB per hour. The observed data were compressed to the 1-bit filterbank format and the polarizations were merged.
We established a HEIMDALL 11 -based pipeline called FAST_Miner. 12 FAST_Miner distributes the workload to more than 20 GPU servers. The pipeline records the signal-to-noise ratio (S/N), start time, pulse width, DM, beam ID, etc. For each single-pulse candidate, the pipeline produces an overview plot including two profiles and two-dimensional waterfall plots, corresponding to before and after the dedispersion process, respectively.
For a total of 1667 hr CRAFTS data taken between June and the end of 2018, FAST_Miner were run with a DM trial range between 100 to 5000 pc cm−3. Candidates detected by less than four adjacent beams but with an S/N > 7σ were kept for further inspection. The candidates were then manually examined, particularly in terms of the DM sweep in the dynamic spectrum and their surrounding RFI background. According to the radiometer equation:
where β is π/2 for the 1 bit digital quantization and Δν is the bandwidth, the detection threshold of our CRAFTS FRB search is roughly 0.0146 Jy ms for a 1 ms pulse width.
3. FRB Discoveries
Three new FRBs were captured on October 17, November 18, and November 30 in 2018. Since two other distinctive FRBs have already been reported to occur on October 17 (CHIME/FRB Collaboration et al. 2019a; Farah et al. 2019), we denote the CRAFTS discovery as FRB 181017.J0036+11 to avoid confusion. All the detailed results of the three new FRBs are exhibited in Table 1.
Table 1. Properties of Three New FRBs Detected in CRAFTS
| FRB YYMMDD (J2000) | FRB 181017.J0036+11 | FRB 181118 | FRB 181130 |
|---|---|---|---|
| Measured Parameters | |||
| Event MJD at 1.5 GHz | 58408.665197 | 58440.877654 | 58452.542674 |
| FAST beam ID (M01—M19) | M14 | M07 | M11 |
| R.A. (J2000) | 00h36m29 8 8 | 07h56m4187 | 00h39m0785 |
| Decl. (J2000) | 11°19' 59''.8 | 16°08' 56''.7 | 19°24' 31''.7 |
| Galactic coordinates (l, b) | 117°.9, −51°.4 | 205°.2, 21°.5 | 118°.9, −43°.4 |
| Dispersion measure (pc cm−3) | 1845.2 ± 1 | 1187.7 ± 3.3 | 1705.5 ± 6.5 |
| Emission freq. (GHz) | 1.0 − 1.5 | 1.00 − 1.12 | 1.16 − 1.50 |
| Dispersion smear (ms) a | 1.0 | 1.0 | 0.7 |
| Measured width (ms) b | 1.43 ± 0.25 | 5.3 ± 3.72 |

|
| Scattering effect at 1.25 GHz (ms) | <0.5 | <2.08 |

|
| Measured S/N | 14.3 | 11.0 | 30.9 |
| Observed peak flux density (mJy) | ∼34.1 | ∼14.2 | ∼20.6 |
| Measured fluence (Jy ms) c | 0.042 | 0.064 | 0.168 |
| Inferred Parameters d | |||
| DMGal (pc cm−3) e | 34.62 , 25.91 | 71.53 , 88.30 | 38.16 , 29.69 |
| Estimate redshift (z) f |
 , , 
|
 , , 
|
 , , 
|
| Max. comoving distance (Gpc) | 5.4 | 4.0 | 5.1 |
| Max. luminosity distance (Gpc) | 16.5 | 8.7 | 14.8 |
| Max. isotropic energy (1040 erg) g | 0.45 | 0.26 | 1.5 |
| Average luminosity (1043 erg s−1) | 0.3 | 0.05 | 0.16 |
Notes.
a The referenced frequency for smear calculation takes center of the emission frequency band. b Full pulse width at the half maximum from Gaussian-fitted profile. Note that the intrinsic width can be much narrower for FRB 181017 since we do not save the raw data (Qiu et al. 2020). c Take the gain at the center of the beam. d The parameters for the Cosmology model are from Planck Collaboration et al. (2020). e DMGal denotes the DM contribution from the Galaxy and is calculated using the NE2001 and the YMW16 model, respectively. f Redshifts inferred from the extragalactic DM calculated using the NE2001 and the YMW16 model, respectively. The corresponding deduction and error analysis can be found in Appendix A. g Calculated by assuming a flat spectrum within a width of 1 GHz tentatively, due to a lack of complete spectrum measurement for FRBs currently.Download table as: ASCIITypeset image
3.1. Burst Characteristics
FRB 181017.J0036+11, FRB 181118, and FRB 181130 were detected within different FLAN beams. We used the average gain (G ∼ 15 K/Jy, Jiang et al. 2020) with Zenith angle correction and the average system temperature (Tsys ∼ 20 K) to estimate the peak fluxes. The 0.042 Jy ms fluence of FRB 181017.J0036+11 is the lowest one-off event ever reported in the FRB Catalog (Petroff et al. 2016).
The pulse profiles and waterfall plots of the three new FRBs are presented in Figure 1. FRB 181017.J0036+11 swept across the full observing band of 500 MHz, whereas FRB 181118 and FRB 181130 are band-limited. Both FRB 181017.J0036+11 and FRB 181118 show a decrease in the power as the frequency increases, which is similar to the negative spectra index commonly seen in pulsars, while FRB 181130 behaves in the opposite way. The available observing bandwidth and SNR is insufficient for a direct determination of the FRB spectral index.

Figure 1. The center plot of (a), (b), and (c) shows the two-dimensional dynamic spectrum of the three newly discovered FRBs where RFIs are masked. The top panel of each plot is the normalized pulse profile, while the right panel shows the characteristic spectrum within the 2σ range (gray shadow) of each burst. No scattering tail was found in the profiles of either FRB 181017 (a) or FRB 181118 (b) at their intrinsic DM values, so Gaussian fittings are outlined. FRB 181130 exhibits an evident scattering effect on a Gaussian-fitted profile.
Download figure:
Standard image High-resolution image3.2. Propagation Effects
The DMobs for each FRB is estimated through (Hessels et al. 2019)
where I(DM, t) stands for the burst profile at a given DM and sampling time t. All three FAST FRBs exhibit high DMs (DMobs in Table 1). The highest DMobs in this work is DMobs = 1845.2 pc cm−3 for FRB 181017.J0036+11. The FWHM of the fitted DM is taken as the uncertainty. Considering the high Galactic latitudes of these events, these FRBs are most likely to have cosmological origins, which we analyze in Appendix A.
Following Masui et al. (2015), we were able to obtain a scattering timescale  ms for FRB 181130 as shown in panel (c) of Figure 1; the details are in Appendix B. No measurable scattering was seen for the other two sources, but the upper limits are given according to the sharpest decline in signal power with time. No measurable scintillation bandwidth was found for all three.
3.3. Follow-up Observations
On 2020 April 4 and 5, we tracked all three new FRBs for 1 hr each source with FLAN. We tracked FRB 181123 for a total of 6 hr between February and July of 2020. The data with higher time resolution (98 μs) with full stokes polarization were recorded. No more bursts were detected in any of the follow-up observations.
4. Implications and Discussion
We look into the implications of FAST discoveries for the event rate, DM–fluence relation, and the intrinsic luminosity of FRBs.
For a Poissonion FRB distribution in an isotropic universe and an effective beam area of 0.019 d2 and taking the events' possibility from Gehrels (1986), four FRBs in 1667 hr drift scan and 9 hr follow-up observations correspond to an all-sky event rate of  sky−1 day−1 at the 95% confidence level above 0.0146 Jy ms (7σ for a 1 ms duration), which is the lowest fluence threshold ever considered.
Figure 2 shows the updated fluence–DME relation with the FAST events added, where DME represents the DM value after deducting the DM contribution from the Milky Way (Cordes & Lazio 2002; Yao et al. 2017). Together with FRB 181123 reported in Zhu et al. (2020), the four FAST FRBs clusters on the bottom right of Figure 2, which are consistent with the extrapolation of ASKAP FRB fluence to higher DME (Shannon et al. 2018). The DM–fluence relation has been extended to the more distant and low fluence region in the DM–fluence space.

Figure 2. A radio fluence–DME diagram for FRBs, where DME represents the DM value after deducting the DM contribution from the Milky Way. With the assumption of an isotropic beam and DMhost = 0, contours of the energy upper limits are plotted by slanted lines, with respective numerical values of E labeled. The sensitivities of the telescopes are marked by horizontal lines. Note that the FAST sensitivity is for the CRAFTS mode (1 bit quantization in 2018 data) and will be even lower for other modes. The FRBs detected by different telescopes are represented by different symbols. In particular, the orange pentagram represents the FRB 181123 in (Zhu et al. 2020, Z20) and the red pentagrams are FRBs reported in this work. The filled symbols represent known repeating FRBs.
Download figure:
Standard image High-resolution imageIdentifying the host galaxies of these FRBs and measuring their redshifts will help extend the DM − z relation (also known as the Macquart relation; Macquart et al. 2020; Li et al. 2020) to higher redshifts. Alternatively, a low fluence burst could be due to a low luminosity of a nearby FRB. In this case, the large DM must be associated with the nearby environment or host galaxy of the FRB. Identifying these low luminosity events would be essential to constrain the low end of FRB luminosity function (Luo et al. 2018). Given the short integration realized by the drift scan, systematic long integration on apparent nonrepeaters is necessary to distinguish whether repeaters have low intrinsic luminosity or if we just undersampled the nonrepeaters. This points to the value of systematic long integration on apparent nonrepeaters to distinguish effects of undersampling versus lower intrinsic luminosity.
Following Luo et al. (2018) and Luo et al. (2020), we quantify the DM distribution of FAST detections by assuming a Schechter luminosity function for all FRBs

where α is the power-law index, and L* is the upper cutoff luminosity. The lower cutoff luminosity is defined as the intrinsic minimum luminosity of the FRB population, which was denoted as L0. We then carried out mock observation of the FRBs generated based on Equation (3) as well as under an assumption of cosmological evolution (e.g., following the star formation history). The specifics are described in detail in Appendix C. The probability density function (PDF) of DM expected for the FAST sample thus simulated is shown in Figure 3.
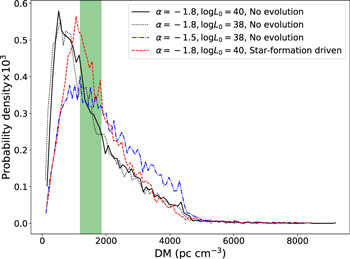
Figure 3. The PDF of the DM distribution of FRBs would be detectable by the FAST telescope. The x-axis is the DM value in units of pc cm−3, and the y-axis is the probability density scaled up by a factor of 1000. The four curves represent the DM PDFs of FRBs detectable by FAST in our four simulation cases: α = − 1.8 and L0 = 1040 erg s−1 without cosmological evolution (black solid), α = − 1.8 and L0 = 1038 erg s−1 without cosmological evolution (black dotted), α = − 1.5 and L0 = 1038 erg s−1 without cosmological evolution (blue dashed–dotted), and α = − 1.8 and L0 = 1040 erg s−1 with star formation history as cosmological evolution (red dashed). The green shaded rectangular region shows the DM range of the four FRBs detected so far in CRAFTS.
Download figure:
Standard image High-resolution imageThree points to note from our simulation. First, the PDF of FAST-FRB's DM is more sensitive to α than L0. Second, the nonevolving flatter luminosity function (α = −1.5) provide the best apparent match to the observation, although including evolution will also move the PDF peak to higher DM. Third, for all the model parameters explored here, FAST will have significant detection probability (>10%) for DM > 3000 pc cm−3, which is beyond reach for other surveys.
5. Summary
In this paper, we report three new highly dispersed and low luminosity FRBs discovered by the Commensal Radio Astronomy FAST Survey, which is a multipurpose drift scan survey with the 19-beam system of FAST. Our main findings are as follows.
- 1.Along with the first discovery—FRB 181123—previously reported, four events in a total of ∼1676 hr, corresponds to an all-sky rate of
 sky−1 day−1 at the 95% confidence interval above 0.0146 Jy ms, by far the deepest such estimate.
 - 2.All three new FRBs are off the Galactic plan, with Galactic latitudes ∣b∣ = 21.5°, 43.4°, and 51.4°, for FRB 181118, FRB 181130, and FRB 181017.J0036+11, respectively. The estimated Galactic contribution DMMM are all less then 10% of the total DM, suggesting extragalactic origins.
- 3.The measured DM, 1187.7 ± 3.3, 1705.5 ± 6.5, and 1845.2 ± 1, with DMMW subtracted, correspond to upper limits of the estimated redshifts of these events between z = 1.17 and z = 2.01.
- 4.FRB 181017.J0036+11, with a pulse width of 1.43 ms and 34.1 mJy peak flux, has the lowest fluence (0.042 Jy ms) among all the nonrepeaters.
- 5.A prominent scattering tail in the profile of FRB 181130 is found to be consistent with a 7.64 ms scattering timescale. No measurable scattering or scintillation effect can be found for other sources.
- 6.We carried out an FRB population synthesis study. The CRAFTS sample, given its high median DM and low fluence, are consistent with a Schechter-type intrinsic luminosity function with the DM distribution being sensitive to both the slope α and cosmological evolution.
- 7.These CRAFTS FRBs occupy a previously empty region in the DM–fluence space. With more discoveries and possible localization, they have the potential to extend the DM-z Macquart relation.

This work is supported by National Key R&D Program of China No. 2017YFA0402600 and is partially supported by the National Natural Science Foundation of China Grant Nos. 11988101,11725313, 12041303, and 11873067, the Cultivation Project for FAST Scientific Payoff and Research Achievement of CAMS-CAS, the CAS-MPG LEGACY project, the Strategic Priority Research Program of the Chinese Academy of Sciences Grant No. XDB23000000, and the National SKA Program of China No. 2020SKA0120200. C.-H.N. is grateful for the funding of the FAST Fellowship.
Appendix A: Redshift Estimation
We describe the method to estimate redshifts of the three new FAST-discovered FRBs here. The observed DM is generally given by

where DMMW
is the DM contribution from the Milky Way galaxy, DMhalo
denotes the DM contribution associated with the Milky Way halo, DMIGM
represents the DM contributed by the IGM, and  denotes DM contributed by the source itself and its host galaxy in the source frame, respectively. Here, DMMW
can be derived from the Galactic electron density models (Cordes & Lazio 2002; Yao et al. 2017). The differences between results calculated using the two models for these FRBs are several tens of pc cm−3. The DM contribution associated with the Milky Way halo is assumed to be DMhalo
= 30 ± 15 pc cm−3 following Dolag et al. (2015). The average DM contributed by the IGM for ΛCDM cosmology is (Deng & Zhang 2014)
denotes DM contributed by the source itself and its host galaxy in the source frame, respectively. Here, DMMW
can be derived from the Galactic electron density models (Cordes & Lazio 2002; Yao et al. 2017). The differences between results calculated using the two models for these FRBs are several tens of pc cm−3. The DM contribution associated with the Milky Way halo is assumed to be DMhalo
= 30 ± 15 pc cm−3 following Dolag et al. (2015). The average DM contributed by the IGM for ΛCDM cosmology is (Deng & Zhang 2014)
where the free electron number per baryon in the universe is χ(z) ≈ 7/8 and the fraction of baryons fIGM ∼ 0.83. Parameters of the cosmological model are taken following Planck Collaboration et al. (2020). In order to derive the redshift z, we assume that the DM contribution from the host galaxy  is in the range of 0 to 200 pc cm−3, which is consistent with several simulated results (Xu & Han 2015; Luo et al. 2018, 2020) as well as results constrained from the observational data (Li et al. 2020). The inferred redshifts are listed in Table 1.
Appendix B: The Pulse Width and Scattering Timescale of FRB 181130
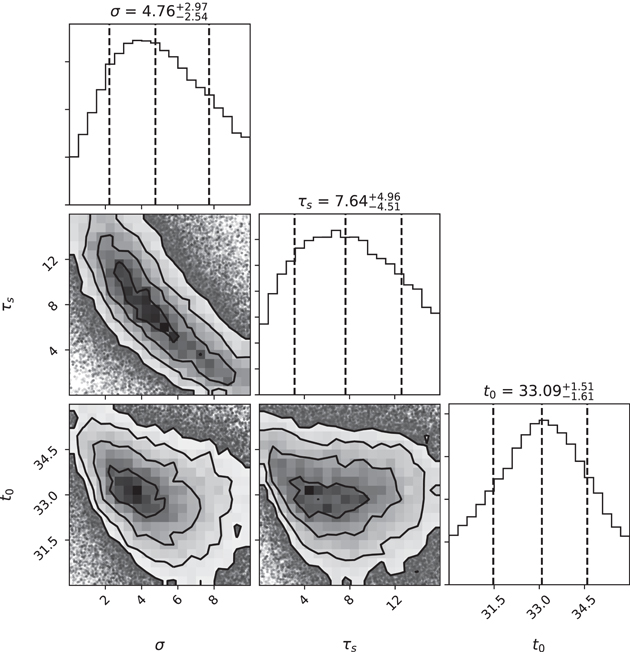
To measure the pulse width and scattering timescale of FRB 181130, we first folded the frequency and normalized the pulse profile using the dynamic spectra in Figure 1. Following Masui et al. (2015), we then analyze the 78 ms-long data centered around the pulse peak by using emcee (Foreman-Mackey et al. 2013). In Figure 4, we show the data fitting results for the width σ of the intrinsic Gaussian pulse component, the scattering timescale τs (centered at 1250 MHz) and the pulse arrival time t0 relative to the starting point of the selected data.
Figure 4. Posterior distributions of σ, τs (centered at 1250 MHz), and t0 obtained by using emcee. The dashed lines represent 16, 50, and 84 percentiles in the corresponding histograms.
Download figure:
Standard image High-resolution image
Appendix C: Simulations on FRB Detectability for CRAFTS
Referring to the verification section for Bayesian inference in Luo et al. (2018, 2020), we can also use the Monte-Carlo method to simulate FRBs that are detectable by FAST surveys such as CRAFTS. The specific procedures are described as follows:
- (i)Sample the FRB luminosities L according to the LF parameters measured in Luo et al. (2020).
- (ii)Sample the host redshifts for two cases—(1) nonevolved: z merely follows a uniform distribution of FRBs across the universe; (2) star formation driven: z follows both galaxy uniform distribution and the star formation history described in Zhang et al. (2021). 13 Then calculate the DM values contributed from the intergalactic medium.
- (iii)Sample the intrinsic FRB pulse widths in the local rest frame of FRBs using the log-normal distribution constrained in Luo et al. (2020).
- (iv)Based on the cosmologically evolving DM distributions of host galaxies at redshifts z described by Luo et al. (2018), generate the DM contributions from host galaxies in the local rest frame of FRBs.
- (v)Generate DM values contributed by the local circumstance of FRB progenitors using the uniform distribution assumed in Luo et al. (2018).
- (vi)Generate Galactic DM values using the YMW16 model, and then sum the DMs from all the components mentioned above to obtain the total observed values.
- (vii)Produce a number of FRB positions randomly falling inside FAST's beams, and then calculate the received peak flux density using the simulated luminosities, redshifts, and beam responses of the FRB positions within the beam size.
- (viii)Based on the emitted pulse widths, redshifts, and DMs of FRBs obtained in the steps above, calculate the observed pulse width considering DM smearing and cosmological time dilution.
- (ix)Select the FRBs whose peak fluxes are above the threshold of CRAFTS as positive detections.
With the simulated data from mock FRBs, we then obtain the PDF of DMs for the CRAFTS' detectable FRBs, which are shown in Figure 3.
Footnotes
- 10
- 11
http://sourceforge.net/projects/heimdall-astro (Barsdell et al. 2012).
- 12
- 13