


Abstract
We study X-ray spectra from the outburst rise of the accreting black hole binary MAXI J1820+070. We find that models having the disk inclinations within those of either the binary or the jet imply significant changes of the accretion disk inner radius during the luminous part of the hard spectral state, with that radius changing from >100 to ∼10 gravitational radii. The main trend is a decrease with the decreasing spectral hardness. Our analysis requires the accretion flow to be structured, with at least two components with different spectral slopes. The harder component dominates the bolometric luminosity and produces strong, narrow, X-ray reflection features. The softer component is responsible for the underlying broader reflection features. The data are compatible with the harder component having a large scale height, located downstream the disk truncation radius, and reflecting mostly from remote parts of the disk. The softer component forms a corona above the disk up to some transition radius. Our findings can explain the changes of the characteristic variability timescales, found in other works, as being driven by the changes of the disk characteristic radii.
Export citation and abstract BibTeX RIS
1. Introduction
The standard model of accretion onto a black hole (BH) postulates the presence of a geometrically thin and optically thick disk (Shakura & Sunyaev 1973; Novikov & Thorne 1973). The disk is close to thermodynamic equilibrium and its emission can be approximated by a sum of local blackbodies with a color correction (Davis et al. 2005). In BH X-ray binaries (XRBs), this emission peaks in EFE at E ∼ 1 keV. On the other hand, BH XRBs in their hard spectral state have the peak of their EFE emission at E ∼ 102 keV (e.g., Done et al. 2007), which cannot be explained by that model. Observations of such spectra prompted development of models of hot accretion disks, where the electron temperature is kTe ∼ 102 keV (Shapiro et al. 1976; Narayan & Yi 1994; Abramowicz et al. 1995; Yuan & Narayan 2014). Those hot disks are postulated to exist below some radius, Rin, and be surrounded by standard accretion disks.
Then, alternative models explaining the hard X-ray spectra were developed. The thin disk can be covered by a hot corona (Galeev et al. 1979; Svensson & Zdziarski 1994). However, due to the cooling by the underlying disk (Haardt & Maraschi 1991; Poutanen et al. 2018), such coronae emit spectra with the photon index of Γ ≳ 2 (defined by FE ∝ E1−Γ), which are too soft to explain the hard state, where Γ < 2 is observed. This can be resolved if the corona is outflowing (Beloborodov 1999). Another model postulates instead the presence of a static point-like source on the rotation axis of the BH, the so-called lamppost (Martocchia & Matt 1996). The lamppost, if it exists, should be in some way connected to the jet, present in the hard state, though theoretical explanations of it appear insufficient thus far (Yuan et al. 2019a, 2019b). The presence of jets in the hard state implies the presence of poloidal magnetic fields (Blandford & Znajek 1977; Blandford & Payne 1982; Liska et al. 2020), which can strongly modify the accretion solutions (e.g., Bisnovatyi-Kogan & Ruzmaikin 1974; Narayan et al. 2003; McKinney et al. 2012; Cao & Spruit 2013; Salvesen et al. 2016).
Deciding which model actually applies to the hard state requires strong observational constraints. In particular, an accurate determination of the geometry of the inner accretion flow is crucial. So far, such determinations have given conflicting results. A large number of papers claim the disk in the hard state extends to the immediate vicinity of the innermost stable circular orbit (ISCO), while other papers find the disk to be truncated (Bambi et al. 2021, and references therein). Here, we consider X-ray observations of the recent outburst of MAXI J1820+070, a bright transient BH XRB, with the goal of resolving this controversy. We use data from two very sensitive instruments, Nuclear Spectroscopic Telescope Array (NuSTAR; Harrison et al. 2013), and Neutron star Interior Composition ExploreR (NICER; Gendreau et al. 2016). We re-examine the findings by Kara et al. (2019, hereafter K19) and Buisson et al. (2019, hereafter B19) that the source evolution in the hard state is dominated by a corona vertical contraction accompanied by an approximate constancy of the surrounding disk.
MAXI J1820+070 was discovered in 2018, first in the optical range (Tucker et al. 2018), and five days later in X-rays (Kawamuro et al. 2018). It is a relatively nearby source; its most accurate distance estimate appears to be the radio-parallax determination (Atri et al. 2020), d ≈ 3.0 ± 0.3 kpc. This is consistent with determinations based on the Gaia Data Release 2 parallax,  kpc (Bailer-Jones et al. 2018; Gandhi et al. 2019; Atri et al. 2020). The inclination of the binary has been estimated as 66° < ib < 81° (Torres et al. 2019, 2020), while that of the jet, as ij ≈ 63 ± 3° (Atri et al. 2020). The BH mass is anticorrelated with ib,
  (Torres et al. 2020). The high inclination of this source is confirmed by the detection of X-ray dips (Kajava et al. 2019).
2. Observations and Data Reduction
We have chosen the spectra from the hard state during initial phases of the outburst that have contemporaneous NICER (0.3–12 keV) and NuSTAR (3–79 keV) coverage. The selected spectral data for four epochs are detailed in Table 1. However, we present here only the results of spectral fits to the NuSTAR data. The reason for this is that NICER is primarily an instrument for timing studies, and its spectral calibration remains much less accurate than that of NuSTAR. In fact, fitting NICER data requires introducing artificial edges to account for sharp instrumental residuals (e.g., Wang et al. 2020a), which significantly affects the accuracy of the fits. In this Letter, we use the joint data to measure the bolometric flux and to show the form of the soft excess below 3 keV. We intend to perform spectral fits of the joint data with an improved NICER spectral calibration in a forthcoming paper.
Table 1. Observations of MAXI J1820+070 with NICER and NuSTAR in the Hard State During the Outburst Rise
| Epoch | NICER Obs. ID | Start time | Exposure | NuSTAR Obs. ID | Start time | Exposure A | Exposure B |
|---|---|---|---|---|---|---|---|
| End Time | (s) | End Time | (s) | (s) | |||
| 1 | 1200120103 | 2018 Mar 13 T23:57:07 | 10691 | ||||
| 2018 Mar 14 T23:25:12 | 90401309002 | 2018 Mar 14 T22:30:12 | 11769 | 11981 | |||
| 1200120104 | 2018 Mar 15 T00:39:50 | 6652 | 2018 Mar 15 T10:27:37 | ||||
| 2018 Mar 15 T21:02:34 | |||||||
| 2 | 1200120106 | 2018 Mar 21 T09:21:01 | 4302 | 90401309006 | 2018 Mar 21 T07:18:35 | 4540 | 4540 |
| 2018 Mar 21 T23:16:08 | 2018 Mar 21 T16:10:13 | ||||||
| 3 | 1200120110 | 2018 Mar 24 T23:40:27 | 19083 | 90401309010 | 2018 Mar 24 T20:41:22 | 2660 | 2801 |
| 2018 Mar 25 T23:14:46 | 2018 Mar 25 T00:49:32 | ||||||
| 4 | 1200120130 | 2018 Apr 16 T01:54:03 | 6015 | 90401309013 | 2018 Apr 16 T22:51:45 | 1834 | 1934 |
| 2018 Apr 16 T23:50:30 | 2018 Apr 17 T01:23:09 |
Download table as: ASCIITypeset image
We also show the count-rate versus hardness diagram for 2018 outburst using the NICER data in Figure 1. We see several phases. The initial rise in the hard state contains our epoch 1, as shown by the red circles. The rise reaches a local maximum, at which our epochs 2 and 3 are located. This was followed by a plateau, during which the count rate only slightly decreased during a decrease of the hardness, and our epoch 4 is located there. Subsequently, there was a rate decline associated with a hardening and a return along a similar path. This was followed by a transition to the soft state, after which the source returned to the hard state but at much lower fluxes. The four NuSTAR spectra considered by us were studied by B19, where they are denoted as epoch 1, the second parts of epochs 2 and 3, and the first part of epoch 5. Also, the NuSTAR data of our epoch 3 were studied in Chakraborty et al. (2020). Timing properties of the NICER observations of our epochs 2 and 4 were studied in K19. The NICER data of epoch 1 are studied in Dziełak et al. (2021). The data from two observations, one on the day preceding and one on the day following that NuSTAR observation, are added. A comprehensive study of the timing properties of all of the NICER observations from the phases of the outburst up to the transition to the soft state is given in De Marco et al. (2021).

Figure 1. NICER count rate per a Focal Plane Module (FPM) in the 2–12 keV range vs. the hardness given by the count-rate ratio of 4–12 to 2–4 keV for the main part of the outburst, between 2018 March 12 T13:51:20 (MJD 58189.577; the rightmost point) and 2018 October 13 T02:37:28 (MJD 58404.109; the lowest point). The lines connect observations adjacent in time. The NuSTAR observations during our epochs 1, 2, 3, 4 are contemporaneous to the NICER observations indicated by the red, green, blue, and magenta circles, respectively.
Download figure:
Standard image High-resolution imageThe NuSTAR data were reduced with heasoft v.6.25, the NUSTARDAS pipeline v.1.8.0, and CALDB v.20200912. To filter passages through the South Atlantic Anomaly, we set saamode=strict and tentacle=yes. As recommended by the NuSTAR team, we use STATUS==b0000xxx00xxxx000 to avoid source photons being spuriously flagged as test. The source region is a 60'' circle centered on the peak brightness. The background is extracted from a 60'' circle in an area with the lowest apparent contribution from sources. However, the background is negligible. We group the data to signal-to-noise ratio (S/N) ≥ 50, but to less at >69 keV so to utilize the full ≤79 keV band.
The NICER data were reduced using the NICERDAS tools in heasoft v.6.28 and CALDB v.20200727. We applied the standard screening criteria (Stevens et al. 2018) and checked for periods of high particle background (>2 s−1) by using the 13–15 keV light curves, where the source contribution is negligible (Ludlam et al. 2018). We removed the Focal Plane Modules (FPMs) 14 and 34, which occasionally display increased noise, and screened for ones showing anomalous behavior.
3. Fits to the X-Ray Spectra of MAXI J1820+070
We study the spectra with the X-ray fitting package xspec (Arnaud 1996). The reported fit uncertainties are for 90% confidence, Δχ2 ≈ 2.71. Residual differences between the calibration of the NuSTAR FPMA and FPMB detectors are accounted for by the model jscrab (Steiner et al. 2010), which multiplies the spectrum by a power law with an index difference, ΔΓ (defined by the differential photon number flux of ∝E−Γ) and a normalization. We account for the interstellar medium (ISM) absorption using the tbabs model (Wilms et al. 2000) using the elemental abundances of Anders & Grevesse (1989).
We use models with thermal Comptonization spectra incident on an accretion disk, taking into account atomic processes and relativistic effects, as implemented in two families of spectral codes, relxillCp, xillverCp (v. 1.4.0; García & Kallman 2010; Dauser et al. 2016) and reflkerr (Niedźwiecki et al. 2019). We assume a rotating BH with the dimensionless spin of a* = 0.998, for which RISCO ≈ 1.237Rg, where Rg ≡ GM/c2. At R ≫ RISCO, the metric is virtually independent of a*.
We begin with studying epoch 1. We first fit the NuSTAR spectra following B19, whose important conclusion was that no model with a single primary (Comptonization) component can fit the data. Their best model consists of a lamppost with two parts with the same incident spectra but at different heights, disk reflection normalized at that geometry, and a disk blackbody. The small differences of our analysis with respect to that work is that we use jscrab instead of allowing independent disk blackbody parameters for the two FPMA and FPMB. With the current calibration, ΔΓ of the FPMB with respect to FMBA is very small, ≈+0.01, and their differences at the lowest energies are similar to those typical for the entire range. Also, we include the ISM absorption, with NH kept constant at 1.4 × 1021 cm−2 (Kajava et al. 2019; Dziełak et al. 2021). Thus, our model is jscrab∗tbabs (diskbb+relxilllpCp 1 +relxilllpCp 2 ), where the two relxilllpCp terms give the two parts of the lamppost primary source. Finally, B19 ignored the 11–12 and 23–28 keV energy ranges, where there were some sharp instrumental features. We include those ranges since such features are no longer present.
We confirm the result of B19, with some small differences attributable to the updated NuSTAR calibration and a newer version of relxilllpCp. We find a good fit with an extremely relativistic configuration, at  ,
,  ,
,  , a very hard spectral index,
  , at
, at  . Similar to B19, who found
  , we obtain
  . Given the current observational evidence for a high inclination (Section 1), this represents a major problem for the applicability of this model (developed before the constraints on the inclination were published) to MAXI J1820+070. Another problem for this spectral solution is that the Fe abundance is very high,
  (
( in B19), which is unlikely given the presence of a weakly-evolved low-mass donor (Torres et al. 2020).
We have thus searched for alternative solutions at higher inclinations. We have indeed found a second minimum at a high inclination, though at somewhat higher  . The inclination is now fully consistent with the observational constraints,
  . On the other hand, the disk is highly truncated,
  . The height of the lower lamppost is
  , that of the upper one is very large, H2 ≈ 500Rg (which is the largest value allowed by the adopted model), and
  . The observed emission is dominated by the upper lamppost. We have looked at possible degeneracies and significant correlations between the fitted parameters, but found none.
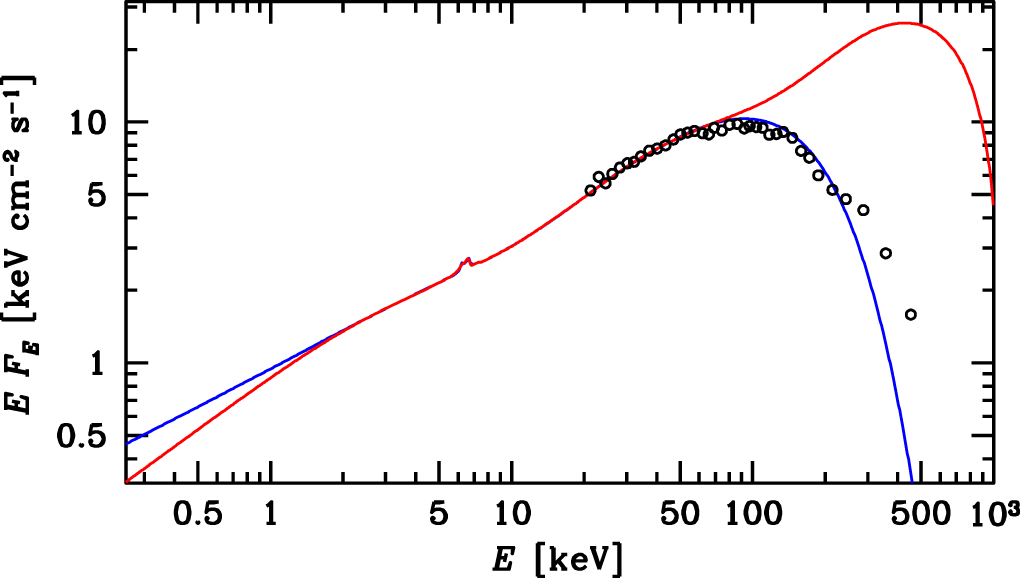
The model spectra of the two solutions are compared in Figure 2. We see that while the two curves are virtually indistinguishable in the fitted 3–78 keV range, they make very different predictions at ≳100 keV. The high-Rin fit predicts a gradual high-energy cutoff corresponding to the fitted electron temperature of  keV. On the other hand, the low-Rin fit predicts a pronounced high-energy hump peaking at 0.4–0.5 MeV, due to the high fitted
  keV (
keV ( keV in B19). The two spectra can be compared to the spectrum measured by the Spectrometer on INTEGRAL (SPI) about a day after the end of the NuSTAR observation, shown as the spectrum R1 in Figure 12 of Roques & Jourdain (2019). We plot that spectrum in Figure 2, multiplied by a factor of 0.52, which accounts for the flux increase during the time between the NuSTAR and SPI observations, and a calibration difference, with the SPI fluxes higher by a factor of ≈1.3 than those of NuSTAR for simultaneous observations. The error bars are not shown; they are of the order of the scatter among the points. We see that the SPI spectrum agrees well with that of NuSTAR in the overlapping 20–78 keV range. It also approximately agrees at higher energies with the high-Rin model, but it strongly disagrees with the low-Rin one. This provides one more argument against its physical reality. We have also compared the residuals of the two fits. We found them to be very similar, with no systematic differences (which is compatible with the close similarity of the shape of the best-fit models, shown in Figure 2).

Figure 2. Comparison of the unabsorbed model spectra for the two fits of the double-lamppost + disk blackbody model to the epoch 1 data. The red and blue curves show the low and high Rin solutions, respectively. The two curves are virtually indistinguishable in the fitted 3–78 keV range. The black circles show the measurements taken by the SPI detector on board INTEGRAL a day after the end of the NuSTAR observation (Roques & Jourdain 2019), normalized to the NuSTAR spectrum. We see that while it approximately agrees with the high-Rin model spectrum at E > 78 keV, it strongly disagrees with the low-Rin one.
Download figure:
Standard image High-resolution imageWe have also found that the two solutions are separated by a very high barrier in χ2, as shown in Figure 3. The barrier reaches Δχ2 ≈ +900 around Rin ≈ 17Rg. This actually prevents finding the low-Rin solution when starting from the high-Rin one, using either steppar in xspec, or the Monte Carlo Markov Chain method. We have also looked for low-Rin counterparts of other spectral solutions presented below, and found they are generally present, but their inclinations are also at i ∼ 30°.

Figure 3. Dependence of χ2 on the disk inner radius, Rin. We see two minima, at low and high values of Rin, separated by a very high barrier in χ2, with Δχ2 ≈ +900 around Rin ≈ 17Rg.
Download figure:
Standard image High-resolution imageThe analyses of the binary parameters (Torres et al. 2019, 2020) and of the jet (Atri et al. 2020), and the presence of X-ray dips (Kajava et al. 2019; see a discussion in Frank et al. 2002) all show at very high confidence that the source inclination is high. The inner disk can be aligned either with the binary plane or the normal to the BH rotation axis, but both are inclined at ≳60°. An outer part of the disk could be warped (e.g., Pringle 1997), but not the disk in an immediate vicinity of the ISCO. Therefore, while the i ∼ 30° spectral solution is statistically better than the i ∼ 60–70° one, it can be considered only as a phenomenological description of the spectrum, but not as a representation of the actual geometry of the accretion flow. Therefore, in the remainder of this study, we consider only high-i solutions.
Furthermore, the disk blackbody component, included in this model in order to account for the soft excess present in the ≥3 keV data, is also phenomenological, and its inner temperature,  keV, is significantly higher than that seen in the NICER data, which is kTin ∼ 0.2 keV (Wang et al. 2020b; Dziełak et al. 2021), which component contributes negligibly at energies >3 keV. On the other hand, in the framework of such a composite lamppost, the two incident spectra should have different spectral indices. These spectra are most likely from the Comptonization process, which implies that the spectral slope at E ≪ kTe is a sensitive function of the flux of the incident seed soft photons from the surrounding accretion disk, and of the magnetic field strength if the cyclo-synchrotron process is important. Both strongly depend on the height of the X-ray source in the assumed geometry. Furthermore, the large fitted Rin suggests the possibility that the region downstream of it contains a hot plasma, and the adopted lamppost model is a proxy to a more complex physical situation. Therefore, we allow the reflection strengths to be free parameters.
Thus, we consider a model with the two incident spectra having different parameters. In this case, the presence of a disk blackbody is not required. We have found a similar  , ≈820/743, and
  ,
,  ,
,  . The lower lamppost component is soft, with
  , at a low height,
  , and the part of the disk giving rise to most of the reflection is strongly ionized,
  (where the ionization parameter, ξ is in units of erg cm s−1). The upper lamppost has
  , H2 ≈ 500Rg, and its reflecting part of the disk is weakly ionized,
  (where the lower limit corresponds to the minimum allowed in the model). We find that the upper lamppost dominates both the bolometric flux and the observed, relatively narrow, Fe K complex. Given the flux dominance and the NuSTAR energy coverage limited to <78 keV, we assume kTe to be the same for both components, and find it ≈
 keV.
keV.
These results bring about the issue of the physical nature of the spectral components. Likely, the region at R < Rin is filled by a hot plasma, which irradiates the truncated disk. However, the data clearly require two separate plasma clouds. The one radiating most of the luminosity also dominates the observed reflection features, which are almost non-relativistic. The presence of such features in the data implies the reflection from remote parts of the disk, which drives the large upper lamppost height, ∼500Rg. Indeed, a similar fit can be obtained when replacing the upper lamppost by a static reflection component, xillverCp.
Following these results, we have developed an accretion model with two hot plasma flows and an accretion disk, shown in Figure 4. The disk is truncated at Rin, and significantly flared at large radii (as follows from the standard accretion models, e.g., Shakura & Sunyaev 1973) and/or warped. The disk is covered by a hot Comptonizing corona, Cs, from Rin to  , which is responsible for the observed softer incident spectral component. Its emission is reflected from the underlying disk, which is strongly ionized and which reflection is partly attenuated by the subsequent scattering in the plasma. (For the sake of simplicity, we assumed that this only results in a reduction of the observed reflection strength.) Interior to Rin, there is also a hot accretion flow, Ch, which Comptonization gives rise to the observed harder incident component. Since the disk is covered by the hot corona up to
  , this emission is reflected predominantly by the bare disk beyond it. That region is much less ionized given the large distance between the plasma and the reflector.

Figure 4. Schematic representation of the proposed geometry for the spectral fits shown below in Figure 5. The disk is truncated at Rin, and covered by a Comptonizing coronal plasma, Cs, from Rin to  . Interior to Rin, there is a hot accretion flow with a relatively large scale height, Ch. Comptonization in Cs and Ch gives rise to the observed softer and harder, respectively, incident spectral components. The emission of Ch is reflected from the flared disk beyond
  , marked as
  . The emission of the coronal plasma, Cs, is reflected from the disk beneath it, marked as
  .
.
Download figure:
Standard image High-resolution imageHowever, we note that the above scenario requires  , i.e., it forces the inner radius of the hard reflection component to be larger than that for the soft one. In order to test the validity of this assumption, we also consider an alternative model allowing for an overlap of the reflection regions. This can correspond to the hot corona between Rin and
  being patchy. In this version, we fit two values of the inner radii of the reflecting region, Rin,s and Rin,h, without imposing any a priori conditions on them.
We implement the two variants of this geometry using the reflkerr coronal reflection code of Niedźwiecki et al. (2019), which has a significantly improved treatment of Comptonization with respect to relxill. As in relxill, it approximates the reflection assuming a power-law disk irradiation profile; here we assume the standard profile of ∝R−3, which follows the disk viscous dissipation at R ≫ RISCO. The used xspec form is given in Table 2. As previously, we assume kTe to be the same for both components; allowing them to be different results only in a tiny reduction of χ2. The temperature of blackbody photons serving as seeds for Comptonization is taken as kTbb = 0.2 keV (compatible with the NICER data; Wang et al. 2020b; Dziełak et al. 2021). The slope of each Comptonization component is parametrized by the Compton parameter, y ≡ 4τT
kTe/me
c2, where τT is the Thomson optical depth of the plasma. We note, however, that the reported values of y are somewhat overestimated due the Comptonization model being based on iterative scattering (Poutanen & Svensson 1996). The reflection fraction,  , is defined in reflkerr as the ratio of the flux irradiating the disk to that emitted outside in a local frame.
Table 2. The Results of Spectral Fitting for Our Two-component Coronal Model, jscrab∗tbabs(reflkerr s +reflkerr h ), to the NuSTAR Data, and for Two Options, Separate and Overlapping Reflection Regions
| Component | Parameter | Epoch 1 | Epoch 2 | Epoch 3 | Epoch 4 |
|---|---|---|---|---|---|
| ISM absorption | NH [1021] cm−2 | 1.4f | |||
| Separate Reflection Regions | |||||
| Joint constraints | i [°] |

|

|

|

|
| ZFe |

|

|

|

| |
| kTe [keV] |

|

|

|

| |
| Soft Comptonization | ys |

|

|

|

|
| and reflection | Rin [Rg] |

|

|

|

|

|

|

|

|

| |

|

|

|

|

| |
| Ns | 0.18 | 2.57 | 3.47 | 1.70 | |
| Fs,inc [10−8 erg cm−2 s] | 0.23 | 4.1 | 5.9 | 1.5 | |
| Hard Comptonization | yh |

|

|

|

|
| and reflection | ΔR [Rg] |

|

| ≤110 |

|
![${R}_{\mathrm{tr}}\,[{R}_{{\rm{g}}}]$](https://content.cld.iop.org/journals/2041-8205/909/1/L9/revision2/apjlabe7efieqn77.gif)
| = Rin + ΔR | ||||
| Rout [Rg] | 103f | ||||

|

|

|

|

| |

|

|

|

|

| |
| Nh | 0.80 | 1.60 | 0.97 | 3.30 | |
| Fh,inc [10−8 erg cm−2 s] | 3.8 | 6.0 | 4.1 | 9.2 | |

| 818/744 | 1040/879 | 704/699 | 703/543 | |
| Overlapping Reflection Regions | |||||
| Joint constraints | i [°] |

|

|

|

|
| ZFe |

|

|

|

| |
| kTe [keV] |

|

|

|

| |
| Soft Comptonization | ys |

|

|

|

|
| and reflection | Rin,s [Rg] |

|

|

|

|
| Rout,s [Rg] | 103f | ||||

|

|

|

|

| |

|

|

|

|

| |
| Ns | 0.18 | 2.02 | 3.27 | 1.78 | |
| Fs,inc [10−8 erg cm−2 s] | 0.23 | 2.8 | 5.2 | 1.6 | |
| Hard Comptonization | yh |

|

|

|

|
| and reflection | Rin,h [Rg] |

|

|

|

|
| Rout,h [Rg] | 103f | ||||

|

|

|

|

| |

|

|

|

|

| |
| Nh | 0.80 | 2.12 | 1.19 | 3.20 | |
| Fh,inc [10−8 erg cm−2 s] | 3.8 | 7.5 | 5.1 | 8.9 | |

| 818/744 | 1041/879 | 704/699 | 703/543 | |
| Fbol [10−8 erg cm−2 s] | 5.0 | 15 | 15 | 14 | |
| L/LE | 0.046 | 0.14 | 0.14 | 0.13 | |
Note. See Section 3 for details. kTe and kTbb = 0.2 keV are assumed to be the same for both Comptonizing coronae, N is the flux density at 1 keV in the observer's frame, and "f" denotes a fixed parameter. F(s,h),inc give the (unabsorbed) bolometric Comptonization fluxes of the respective component, Fbol is an estimate of the total bolometric flux based on both the NICER and NuSTAR data (normalized to the NuSTAR FPMA), and L/LE is the Eddington ratio for d = 3 kpc, M = 8M⊙ and X = 0.7 [LE = 1.47(M/M⊙) × 1038 erg s−1].
Download table as: ASCIITypeset image
We find that both options of this model yield  and the parameters given in Table 2. The two sets of the parameters differ only slightly. In the option with overlapping reflection regions, the inner radius of the soft component is lower than that for the hard component at the best fits for all four data sets, confirming the assumption of
  done in the option with separate reflection regions (Figure 4). In the latter, the value of
  is primarily driven by the hard reflection, as it determines
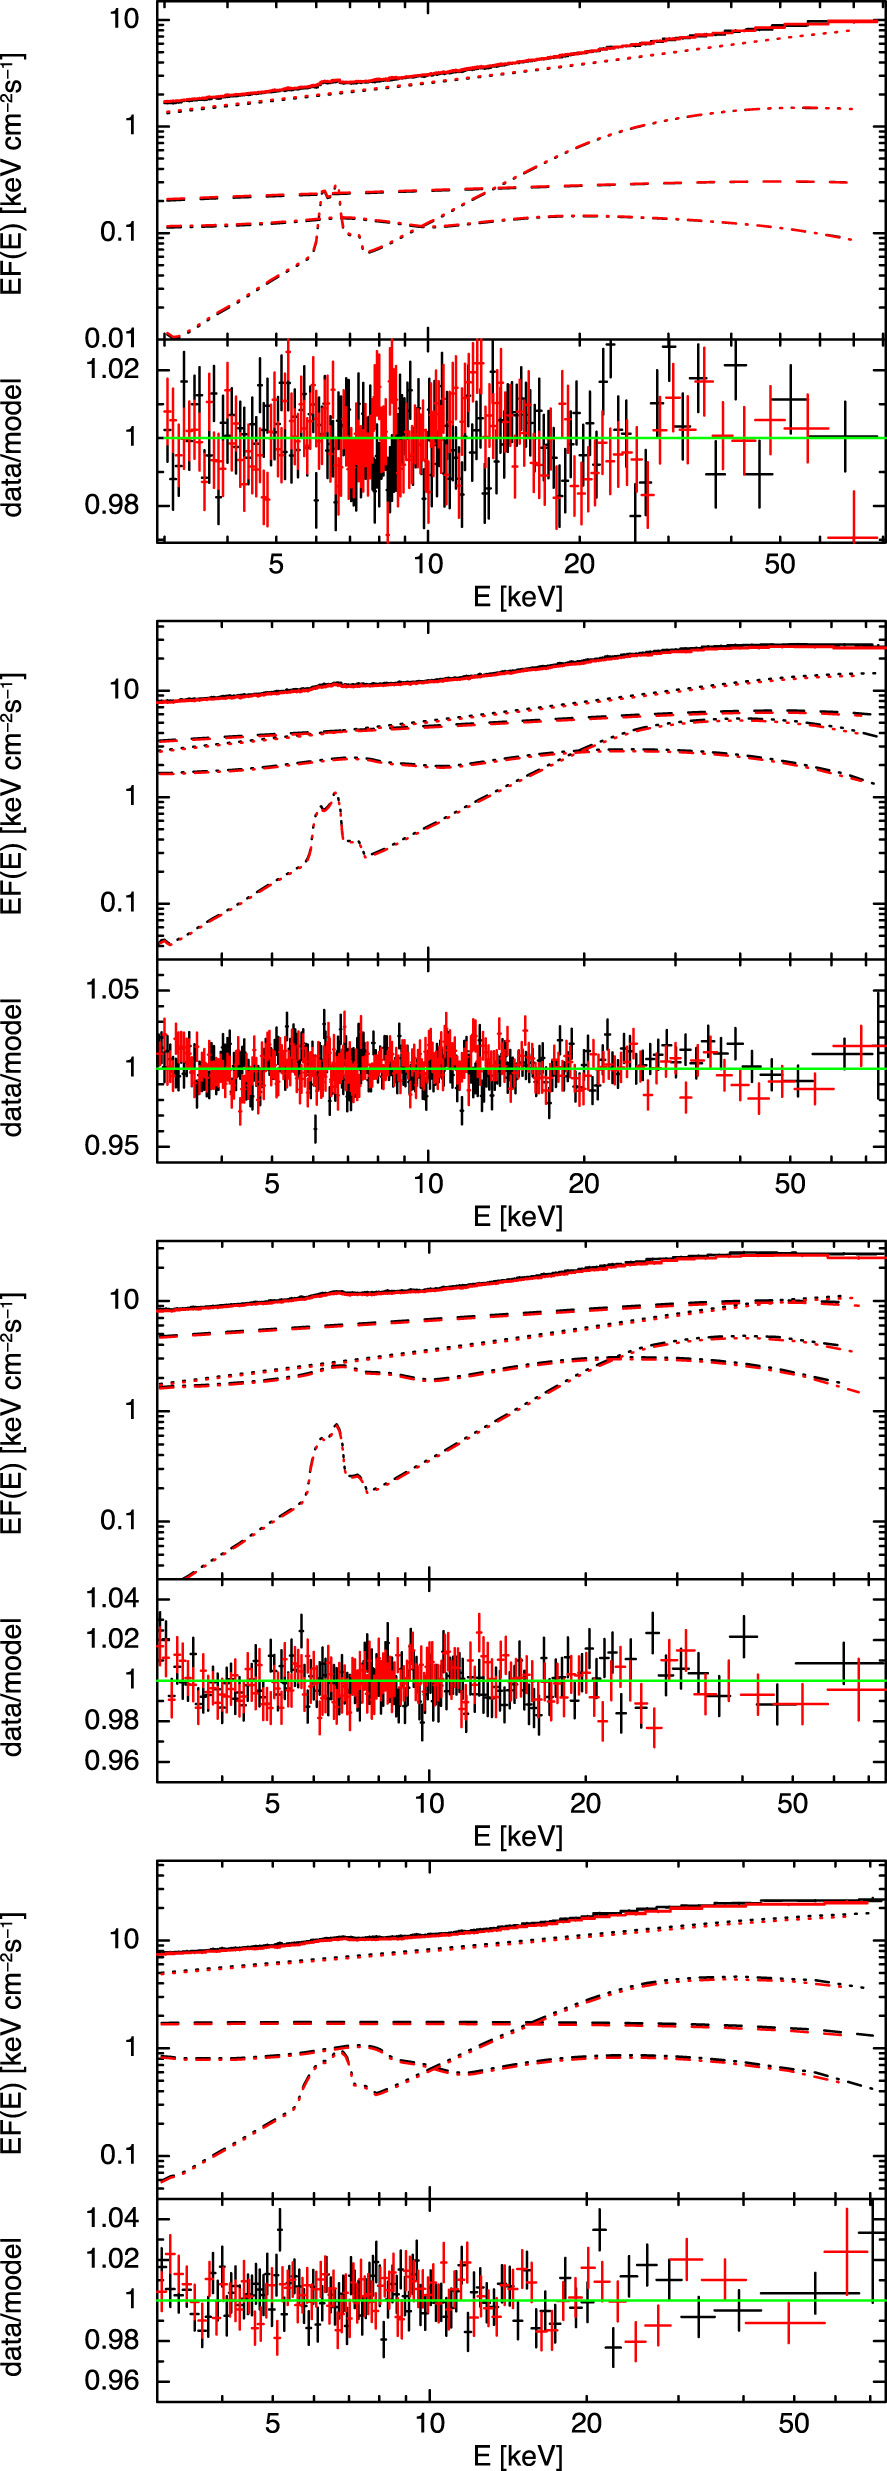
  , while the soft reflection is relatively insensitive to its outer radius given the used irradiation profile ∝R−3. The unfolded spectra and data/model ratios for the case of separate reflection regions are shown in Figure 5. Both cases have the inclination within the observational constraints and the Fe abundance very close to solar. As expected if these fits indeed correspond to the geometry close to that shown in Figure 4, the harder component dominates the bolometric flux, and the reflector of the softer component is much more ionized than that of the harder one.

Figure 5. NuSTAR unfolded spectra and data-to-model ratios of the epochs 1–4 (from top to bottom) fitted in the 3–78 keV range with the two-component coronal model (Table 2). The dotted and dashed curves on the top panel correspond to the direct emission of the harder and softer corona, respectively, and the triple-dotted–dashed and dotted–dashed curves correspond to the reflection of harder and softer direct emission, respectively. Hereafter, the black and red symbols correspond to the FPMA and FPMB, respectively, and the plotted spectra are rebinned to S/N ≥ 100.
Download figure:
Standard image High-resolution imageWe have also tested a number of other models and found the truncation radius to be large and the reflection features are only weakly relativistic for all of those satisfying the observational constraints on the inclination. Thus, we have a robust conclusion that, at least in this BH XRB, the truncation radius at the luminosity of ∼5%LE is ∼102 Rg.
We then study the data for epochs 2–4. We fit the NuSTAR spectra with the two versions of the double-corona reflkerr model. We find good fits at high inclinations, as shown in Table 2 and Figure 5. The shapes of the four spectra are compared in Figure 6. The disk truncation radius is relatively small for epoch 2, Rin ∼ 20Rg and even lower for 4, Rin ∼ 10Rg, while Rin during epoch 3 is similar to that of the epoch 1. In all cases, Rin is significantly larger than RISCO. In epoch 3, we also find a high relative amplitude of the softer Comptonization component. We have no explanation for this feature of epoch 3; it may be due some fluctuation of the source parameters. We see a monotonous decrease of  over all four epochs. Our values of Rin can be compared with those obtained by Wang et al. (2020b) by modeling the NICER data by a disk blackbody and a power law. They obtained the disk inner radii of ≈(4.5–6.5) × 107 cm during the period analyzed here. At 8M⊙, this corresponds to ∼40–50Rg, in an overall agreement with our values, and independently ruling out solutions with Rin close to the ISCO.
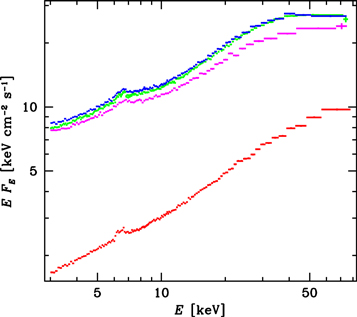
Figure 6. Spectra of the four studied observations unfolded with the two-component coronal model with separate reflection regions (Table 2). For clarity, only the spectra from the FPMA detector are shown. The spectra of the epochs 1, 2, 3, 4 are shown in the red, green, blue, and magenta color, respectively.
Download figure:
Standard image High-resolution imageWhile the fits show variability of the characteristic disk radii, the fitted i and ZFe are compatible with constant, as expected. In fact, we may expect some variability of i due to precession or warping. Also, the viewing angle of the disk below and above  may be different, as shown in Figure 4. We neglect this complication as not to overfit the data. The values of our fitted inclination agree with the jet and binary observations, unlike those of B19 and Chakraborty et al. (2020). The Fe abundance is compatible with ZFe ≈ 1.2–1.3. Such a closeness to unity is likely for this XRB, which has a low-mass donor (Torres et al. 2020), in which substantial Fe synthesis is not expected during the evolution. On the other hand, the values of ZFe found by B19 and Chakraborty et al. (2020) were within the range of 4–10 at their best fits.
We then briefly consider the NICER data. We fit them at the range 3–10 keV, to test their consistency with the NuSTAR data. We find a generally good agreement, even in the relative normalization, which values are close to unity, and joint fits with the double-corona model give parameters similar to those in Table 2. However, the NICER data at <3 keV show strong soft excesses, as shown in Figure 7. These excesses are not compatible with the presence of a disk blackbody alone, and imply a further complexity of the accretion flow (see Dziełak et al. 2021). The joint data will be studied in a forthcoming paper, including the effect of quasi-thermal re-radiation of a fraction the incident flux (Zdziarski & De Marco 2020; Zdziarski et al. 2021). Now, we use them only to estimate the bolometric fluxes of the observations. We utilize a phenomenological Comptonization/reprocessing model to describe the overall shape of the broad band spectra and to estimate the fluxes below 3 keV, while we use our double-corona fits to get the fluxes above 3 keV. The resulting values are given in Table 2.

Figure 7. Data/model ratios for the two-component coronal model with separate reflection regions fitted to the NuSTAR (black and red symbols) and NICER (blue symbols) 3–10 keV data for epochs 1–4 (from bottom to top). For clarity of display, the profiles for epochs 2, 3, and 4 have been offset by +0.7, +1.4, and +2.1, respectively. We also show the NICER data at <3 keV, which show strong and complex soft excesses.
Download figure:
Standard image High-resolution image4. Discussion
We have found that the hard-state spectra above 3 keV are well described by a structured accretion flow with the geometry shown in Figure 4. The energetically dominant component is the hardest one (except for epoch 3, where the two components have comparable fluxes), but its emission is reflected from remote parts of the disk,  . However, the plasma location at
  would disagree with a number of arguments. First, the relative similarity in the bolometric flux between the plateau hard state and the soft state (Shidatsu et al. 2019) argues against a radiative inefficiency of the hard state. Then, the most luminous component should originate close to the BH, but not at ≳102
Rg. Second, low-frequency variability of the observed flux at higher energies lags behind that at a lower energies, which phenomenon is called "hard lags." This has been observed in MAXI J1820+070 (K19; Wang et al. 2020b; De Marco et al. 2021) as well as in other BH XRBs, and it has been interpreted as propagation of fluctuations in the accretion flow (Kotov et al. 2001). In this framework, a plasma emitting a harder spectrum should be located downstream that with a softer spectrum. Third, a hard Comptonization spectrum requires a low flux of incident seed soft photons (e.g., Poutanen et al. 2018), implying a plasma location away from the disk, at R < Rin, as shown in Figure 4. Its scale height has to be large, as implied by the typical fractional reflection of
would disagree with a number of arguments. First, the relative similarity in the bolometric flux between the plateau hard state and the soft state (Shidatsu et al. 2019) argues against a radiative inefficiency of the hard state. Then, the most luminous component should originate close to the BH, but not at ≳102
Rg. Second, low-frequency variability of the observed flux at higher energies lags behind that at a lower energies, which phenomenon is called "hard lags." This has been observed in MAXI J1820+070 (K19; Wang et al. 2020b; De Marco et al. 2021) as well as in other BH XRBs, and it has been interpreted as propagation of fluctuations in the accretion flow (Kotov et al. 2001). In this framework, a plasma emitting a harder spectrum should be located downstream that with a softer spectrum. Third, a hard Comptonization spectrum requires a low flux of incident seed soft photons (e.g., Poutanen et al. 2018), implying a plasma location away from the disk, at R < Rin, as shown in Figure 4. Its scale height has to be large, as implied by the typical fractional reflection of  ; see Table 2. Also, the outer disk is likely to be flared, which increases the solid angle subtended by it as seen from the central hot plasma.
Then, the source of the softer X-ray component appears to be at R > Rin. We propose it forms a corona above the disk. Its softness, with the photon index of Γ ∼ 2, is explained by the re-emission of its flux incident on the disk (Haardt & Maraschi 1991; Poutanen et al. 2018). The underlying disk is strongly ionized by the coronal radiation. The reflection features are mildly relativistic and attenuated by the scattering in the corona. The corona extends out to  .
.
Our preferred geometry of the inner accretion flow is similar to that of Mahmoud et al. (2019), shown in their Figure 2, inferred from a study of the BH XRB GX 339–4. The main difference in our picture is that we propose the outer hot plasma to form a corona above a disk, while the soft-emitting plasma in Mahmoud et al. (2019) is placed downstream of the truncation radius. Alternatively, the reflection of the soft emission can be from cold clumps within the hot plasma, as in the model for Cyg X-1 of Mahmoud & Done (2018). In fact, the viscous dissipation within a full disk between Rin and  is likely to lead, via cooling of the coronal plasma, to spectra softer than those we see in the data. The presence of the underlying cold clumps covering only a fraction of the midplane instead of a full disk would then reduce the cooling; see, e.g., Poutanen et al. (2018). Also, our finding of the spectral complexity, requiring at least two Comptonization components in order to explain the spectra at >3 keV, agrees with those of Chakraborty et al. (2020) and Wang et al. (2020b) for this source and that of Zdziarski et al. (2021) for XTE J1752–223, another transient BH XRB.
Our finding that the reflection features in the hard state are only mildly relativistically smeared (provided that the fitted inclinations agree with the observational constraints) can explain the fact, pointed out by K19 for the NICER data and by B19 for the NuSTAR data, that the Fe–K range profiles appear similar over the hard state. This is because the relativistic distortion of the rest-frame Fe K spectra is modest. We show the reflection profiles obtained in our fits in Figure 8, with respect to the sum of the two Comptonization components. While the profile for epoch 1 looks relatively narrow, those for 2, 3, and 4 look similarly broad. Still, we have found that the inner radii for reflection of the hard and soft spectral components do vary a lot across the studied data set. In particular, Rin > 100Rg for epoch 3 while Rin ≈ 10Rg for the best fit to the data for epoch 4. The variability of the characteristic disk radii can readily explain the findings by K19 and B19 that the reverberation and power-spectrum timescales decrease with the increasing softness in spite of the Fe K profiles looking relatively similar.

Figure 8. Reflection profiles in the NuSTAR spectra for epochs 1–4 (from bottom to top) presented as the data/model ratios after removing the two reflection components in the model with separate reflection regions. For clarity of display, the profiles for epochs 3 and 4 have been offset by + 0.15 and + 0.35, respectively. We see that the profiles look remarkably similar. Still, the data are fitted with the best-fit values of Rin ranging from ≈10 (epoch 4) to >100 (epoch 3), see Table 2.
Download figure:
Standard image High-resolution image
Therefore, the statements of K19 and B19 that the varying characteristic timescales accompanied by the Fe K complexes looking similar imply strong variations of the coronal scale height above a disk of a constant inner radius (see Figure 4 in K19) appear not certain. The dominant trend found by our spectral fitting is that  decreases with the increasing softness of the spectra. Thus, the reverberation timescales will correspond to the distance between the dominant hard-emitting plasma and outer parts of the disk, beyond
  . A contraction/expansion of the corona is still allowed, but it is not required. Given our spectral results, it is unlikely to be the dominant cause of the variable reverberation timescales.
Still, details of the source geometry and its changes with the spectral evolution in the hard state remain unclear. The solid angle subtended by the reflector as seen by the inner hot plasma is large, ∼0.5 × 2π. This requires either a large scale height of that plasma and/or the disk beyond  to be flared (see Figure 4) but the latter may cause an obscuration of the central hot plasma. A large scale height can be achieved if the accreting flow is outflowing, as in the model of Beloborodov (1999); Malzac et al. (2001). This may form a slow sheath of the jet (e.g., Reig & Kylafis 2021). Arguments for a part of the X-ray emission of MAXI J1820+070 to be from the jet are presented by Wang et al. (2020b) and Ma et al. (2021). We also note that Dubus et al. (1999) pointed out that while the irradiation of the outer disk is required by the observed light curves of transient BH XRBs, it cannot be achieved in the standard disk model because of self-screening. This requires a geometry in which the solid angle subtended by outer parts of the disk as seen by the central source is large, similar to our finding. Our proposed geometrical model is also incomplete because it does not account for the spectra below 3 keV; see Figure 7. Those data indeed imply the presence of additional components in the accretion flow (Dziełak et al. 2021; De Marco et al. 2021).
5. Conclusions
We have confirmed the findings of a number of previous works that the geometry in the hard state of BH XRBs features a significantly truncated disk, and the dominant trend is a decrease of the characteristic disk radii with the decreasing hardness, i.e., during the evolution toward the soft state. The changes of Rin occur in spite the visual appearance of a constancy of the Fe K profile (see Figure 8). For L ∼ 5%LE during the rise of MAXI J1820+070, the truncation radius was ∼102 Rg, as found with a number of different models.
Then, we find the accretion flow is structured, with at least two primary Comptonization components, the hard (usually dominant) and soft (see Figure 5). The reflection features are dominated by reflection of the hard components far away in the disk. The soft component is responsible for the broader reflection component, also seen in the data. A possible geometry accounting for that is shown in Figure 4.
Our findings imply that the evolutionary changes of the reverberation and power-spectrum timescales can be explained by changes of Rin and  , without the need for invoking a corona contraction.
We have also found another family of spectral solutions with the disk extending to an immediate vicinity of the ISCO, confirming B19 and Chakraborty et al. (2020). However, those solutions require a low inclination, i ∼ 30°, while the inclinations of the binary and the jet have been found to be in the 60–81° range.
The data at <3 keV from NICER, not modeled in this work, show strong and complex soft X-ray excesses (Figure 7), implying the presence of at least one more Comptonization component, in addition to a disk blackbody.
We thank J. Casares, C. Done, J. Kajava, N. Kylafis, M. Torres, A. Veledina, and Y. Wang for valuable comments and discussions, and the referee for valuable comments. Special thanks are due to D. Buisson for his finding the low-radius lamppost solution for the current data of epoch 1. We have benefited from discussions during Team Meetings of the International Space Science Institute (Bern), whose support we acknowledge. We also acknowledge support from the Polish National Science Centre under the grants 2015/18/A/ST9/00746 and 2019/35/B/ST9/03944, and from Ramón y Cajal Fellowship RYC2018-025950-I.