


Abstract
The cross sections of 127I(n,γ)128I and 133Cs(n,γ)134Cs play a critical role in the s-process of nuclear astrophysics, the iodine–xenon chronometer on early meteorite evolution, and understanding the performance of CsI crystal detectors for Dark Matter Detection Experiment and Coherent Elastic Neutrino-Nucleus Scattering (CEνNS) experiments. The neutron capture cross sections of 127I and 133Cs were measured from 1 eV to 1 MeV using the time-of-flight method at China Spallation Neutron Source Back-n facility. The neutron capture yield was derived via the pulse-height weighting technique based on the total energy detection principle of C6D6 detectors. In the resolved resonance region (RRR), some new resonance peaks of 133Cs(n,γ) were observed for the first time. Resonance parameters for the neutron capture cross section were extracted using the SAMMY code from 1 eV to 4 keV, while averaged capture cross sections in the unresolved resonance region (URR) from 4 keV to 1 MeV were analyzed with TALYS. Results were compared with evaluated libraries and previous work in both RRR and URR. Astrophysical Maxwellian-averaged cross sections (MACS) were calculated for kT = 5–100 keV. At kT = 30 keV, the MACS of both 127I(n,γ)128I and 133Cs(n,γ)134Cs were slightly higher than those of the KADoNiS v0.3 recommended value. And the reaction rates were derived over the astrophysically relevant temperature range of s-process nucleosynthesis models. The uncertainties of present reaction rates are significantly reduced.

Original content from this work may be used under the terms of the Creative Commons Attribution 4.0 licence. Any further distribution of this work must maintain attribution to the author(s) and the title of the work, journal citation and DOI.
1. Introduction
Modern nuclear astrophysics theories posit that the production of heavy elements primarily originates from neutron capture processes in stars (E. M. Burbidge et al. 1957), including the slow neutron capture process (s-process), intermediate process (i-process; J. J. Cowan & W. K. Rose 1977), and rapid neutron capture process (r-process). Precise measurements of neutron capture cross sections are crucial for understanding the nucleosynthesis of heavy elements in the Universe.
Asymptotic giant branch (AGB) stars serve as crucial nucleosynthesis sites, producing approximately 50% of the heavy elements in the solar system through the s-process (F. Käppeler et al. 2011; M. Lugaro et al. 2023). As the sole stable iodine isotope in nature, 127I plays a crucial dual role in heavy-element nucleosynthesis through its keV neutron capture cross section 127I(n,γ)128I, which directly impacts the yield of 128Xe and subsequent heavy elements.
The ratios of radioactive/stable nuclides in the early solar system (ESS), such as 129I/127I and 135Cs/133Cs, can provide fundamental information about the stellar environment of solar system formation. The nucleosynthesis of 129I (t1/2 = 16.1 Myr) almost cannot proceed via the 128I(n,γ) reaction in s-process conditions, but instead is produced through r-process or i-process (A. Choplin et al. 2025). The ESS ratio of 129I/127I could provide strong constraints for identifying the main source of r-process (P. Banerjee et al. 2022). This ratio can be determined through the r-process residual method, subtracting the s-process abundance, which is primarily governed by the neutron capture cross section of the stable isotope 127I, from the total isotopic abundances derived from meteoritic analyses, thereby isolating the r-process component of the ESS’s abundance distribution (M. Lugaro et al. 2018).
While 129I is r/i-process dominated, the 135Cs isotope (t1/2 = 1.33 Myr) represents the only radionuclide primarily synthesized via s-process in AGB stars (G. A. Brennecka & T. Kleine 2017), whose production directly depends on neutron capture cross section 133Cs(n,γ)134Cs. High-precision measurements of neutron capture cross sections are crucial for constraining s-process nucleosynthesis models; uncertainties can be significantly reduced through variation of the experimental parameters (M. Heil et al. 2008; G.-L. Yang et al. 2023). For example, research by K. A. Li et al. (2021a) indicates that, in the s-process pathway in the vicinity of Cs (see Figure 1), 134Cs serves as a critical branching point where the competition between neutron capture and β-decay determines the abundances of isotopes including 134Ba and 136Ba, uncertainties in nuclear physics parameters such as the β-decay rate of 134Cs can significantly impact predictions of the 134Ba/136Ba ratio in AGB stars.
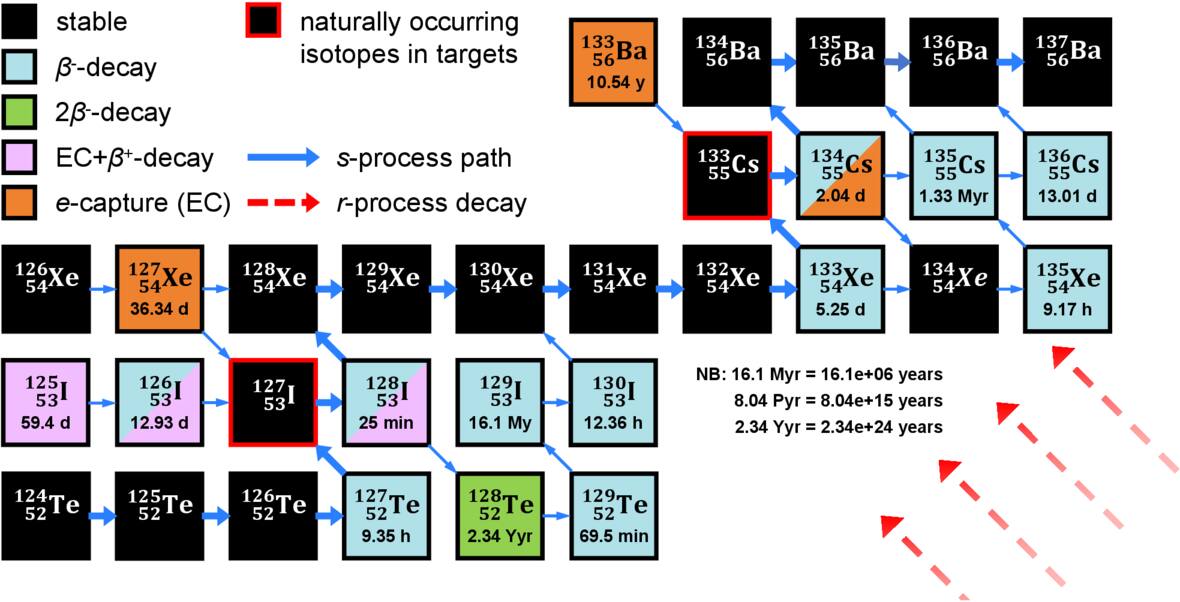
Figure 1. The s-process path in the vicinity of 127I and 133Cs.
Download figure:
Standard image High-resolution imageThe iodine–xenon (I-Xe) chronometer is a critical tool for determining the timing of meteorite closure ages, depending on the β-decay of 129I to 129Xe (J. D. Gilmour et al. 2006) and neutron-induced production of 128Xe from 127I (as shown in Figure 1). This method provides high temporal resolution for ESS events, such as chondrule formation and parent body alteration. However, absolute I-Xe dating requires a precise neutron capture cross section of 127I during reactor irradiation, and the accuracy is severely limited by the resonance-dominated neutron capture behavior of 127I (O. Pravdivtseva et al. 2017). Conventional approaches rely on coirradiation with meteorite standards to bypass this issue through relative age determination (C. Hohenberg & K. B.M 1981), yet this workaround cannot eliminate the fundamental need for precise neutron capture cross sections of 127I data in nonstandardized applications. Precise neutron capture cross sections 127I(n,γ) 128I  128Xe enable more accurate absolute age calculations, addressing a long-standing gap in nuclear data for I-Xe chronometry.
Accurate 127I(n,γ) cross sections are vital not only for astrophysics but also for optimizing CsI crystal detectors in dark matter and neutrino experiments (D. Akimov et al. 2017, 2022, 2023), where neutron capture constitutes a major background. Current simulations are limited to thermal neutron cross sections, as exemplified by the work of T. Ueki et al. (2019) on neutron dosimetry, lacking systematic measurements across the critical 1 eV–1 MeV resonance region. Our results present the continuous, high-precision cross section measurement over this entire range, providing the complete dataset needed for reliable background modeling and detector optimization using simulation tools such as Geant4.
However, the available experimental cross section data for 127I and 133Cs in the Experimental Nuclear Reaction Database (EXFOR) are limited in their energy coverage. While some datasets span broad energy ranges, they fail to clearly resolve fine resonance structures due to the relatively low resolution. Since neutron cross section data significantly impact the predictions of nuclear system behavior, many researchers have been investigating new data, striving for more accurate predictions (M. Kromar & S. B. Kurinčič 2022). Some discrepancies exist between experimental data and major evaluation libraries:
In the resolved resonance region (RRR) of 127I from 1 to 4 keV, J. Yoon et al. (2005) measured neutron capture reaction cross sections from 0.01 to 100 eV using the time-of-flight (TOF) method. While their measurements show good agreement with evaluated libraries in terms of peak positions, the reported peak intensities are systematically lower. Although earlier work by J. Popov & F. Shapiro (1962) covered a broad energy range (1.4 eV–50 keV) using the slowing-down in lead (SLODT) method that suffers from inherently poor energy resolution with resonance peak widths reaching ∼35% below 1 keV and ∼70% at 15 keV. Consequently, their measured cross section data lack distinct, precise resonance structures. The results given by R. Block et al. (1961) covered the energy range from 199 eV to 8.60 keV with the ORNL fast chopper TOF neutron spectrometer, but the data did not resolve fine resonance structures. In the latest study, G. Rovira et al. (2024) measured 127I(n,γ) from thermal energy to 500 keV, which shows good overall agreement with JENDL-5. However, only the resonance parameters below 100 eV were derived in their work, lacking the resonance parameters in the higher-energy region (up to 4 keV).
In the unresolved resonance region (URR) of 127I above 4 keV, the existing experimental data demonstrate relatively good completeness, with the majority of measurements showing satisfactory agreement with evaluated library values. However, notable exceptions include the systematically higher values reported by S. J. Bame & R. L. Cubitt (1959), Y. Y. Stavisskii et al. (1961), and V. S. Shorin et al. (1975) compared to the evaluated data.
In the RRR of 133Cs from 1 eV to 4 keV. Below 1 keV, the CENDL-3.2 library exhibits multiple omissions in its resonance structure, resulting in significant discrepancies when compared to other major evaluated libraries. J. Yoon & S. Lee (2011) measured neutron capture reaction cross sections from 0.03 to 60 eV by the TOF method; F. Widder (1975) obtained neutron capture cross sections from 0.01 to 10 eV using TOF method; using SLODT method, J. Popov & F. Shapiro (1962) obtained the 133Cs(n,γ) reaction cross sections for 0.875 eV–40 keV, which also suffers from the same poor resolution issue and differs markedly from the other experimental data.
In the URR of 133Cs above 4 keV, the latest TENDL-2023 (D. Rochman et al. 2025) evaluation demonstrates systematically higher cross section values compared to other major nuclear data libraries: ENDF/B-VIII.1 (G. Nobre et al. 2024), JEFF-3.3 (A. J. M. Plompen et al. 2020), and JENDL-5 (O. Iwamoto et al. 2020). While the majority of experimental measurements are consistent with these established libraries, the results reported by D. Kompe (1969) show significant deviations, displaying systematically higher values compared to most evaluated data and other experimental measurements. This discrepancy is attributed to normalization issues and statistical uncertainties in their methodology. Intriguingly, D. Kompe's (1969) data show better agreement with TENDL-2023.
In this work, the neutron capture cross sections of 127I and 133Cs in the 1 eV–1 MeV energy region will be measured with the help of the China Spallation Neutron Source (CSNS) Back-n white neutron beam, with wider energy regions and better energy resolution that is less than 1% below 150 keV (Y. Qiu et al. 2025). The Back-n facility and the C6D6 detectors used in this work are presented in Section 2. The data analysis is stated in Section 3, including the pulse-height weighting technique, Bayesian double-bunch unfolding method, background subtraction, normalization, and corrections. The results are presented and discussed in Section 4, where the SAMMY-fitted neutron capture cross sections, the average cross sections computed with TALYS, and the experimentally derived Maxwellian-averaged cross sections (MACS) are shown. Based on these cross sections, the corresponding reaction rates were calculated and compared with previous studies in Section 5. Finally, the conclusions are summarized in Section 6.
2. Measurements
2.1. The Back-n Facility at CSNS
The CSNS generates high-intensity white neutrons through a spallation process using a 1.6 GeV proton beam incident on a tungsten target. Its Back-n facility provides the world’s highest flux white neutron beam (107 n cm−2 s−1 at 55 m) with a continuous energy spectrum (0.5 eV–200 MeV), primarily dedicated to nuclear data measurements through TOF techniques (X. X. Li et al. 2022; Y.-J. Chen et al. 2025; T. Liu et al. 2026). The measurements for this work were conducted at the experimental station ES#2 of Back-n (as shown in Figure 2). CSNS provides three types of proton beam operation modes, including double-bunch operation mode, single-bunch operation mode, and short-bunch operation mode. The double-bunch operation mode was applied in this work in order to generate a higher neutron flux and save the experimental time. Under this mode, proton beams with two bunches separated by 410 ns at a pulse frequency of 25 Hz are produced by the accelerator (Q. An et al. 2017). To shape the neutron beam into a circular Gaussian-shaped profile, a neutron shutter is placed at 20 m from the spallation target, and three neutron collimators with inner diameters of Φ50 + Φ15 + Φ40 mm are located at ∼24, ∼50, and ∼70 m from the spallation target. A 1.0 mm thick cadmium foil in the neutron shutter absorbs the neutrons with energies below 0.3 eV to avoid overlapping between two consecutive neutron beam bunches.
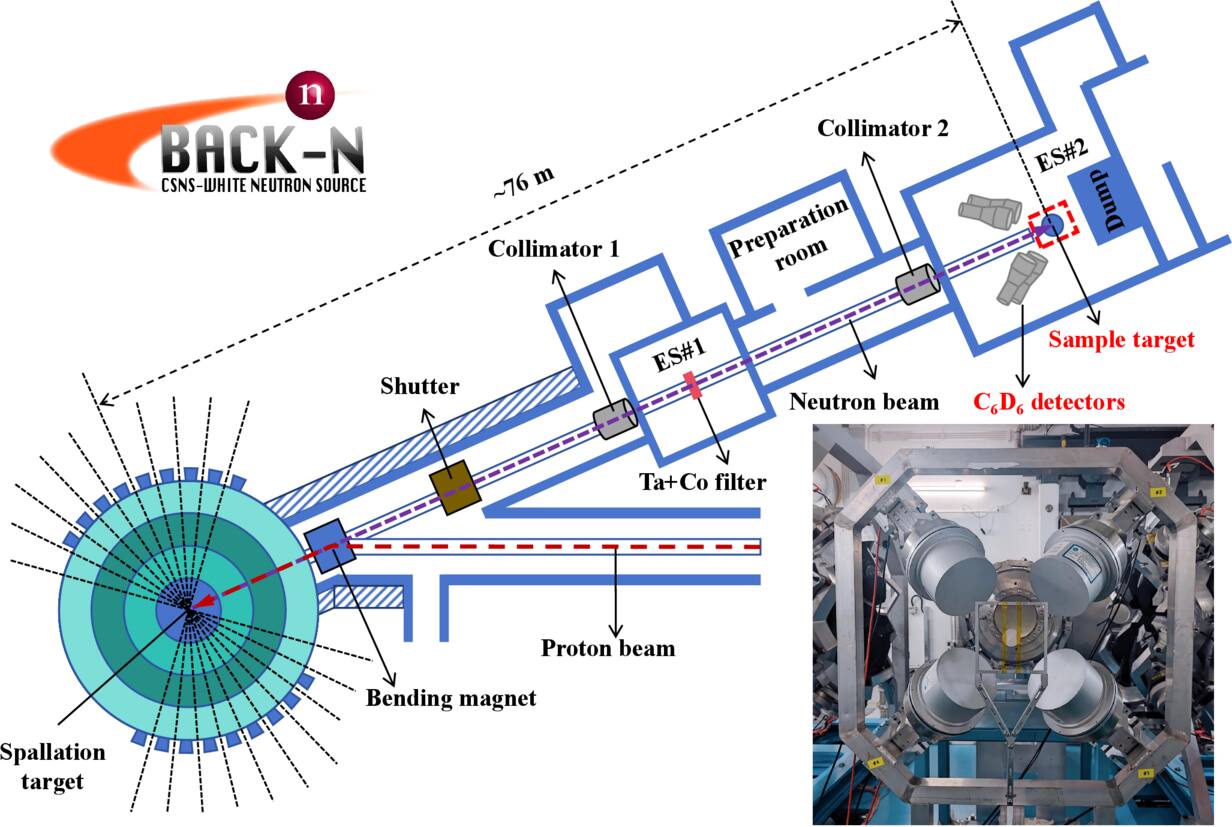
Figure 2. CSNS Back-n facility.
Download figure:
Standard image High-resolution imageThe γ-rays emitted during the decay of the compound nucleus are detected by a C6D6 detector system positioned at the center of experimental station ES#2, located 75.9 m from the spallation target (J. Ren et al. 2019). The detection system used in this work consists of four C6D6 detectors arranged with aluminum detector mounts and an aluminum sample holder. The C6D6 detectors are liquid scintillation detectors employing deuterated benzene as the scintillating material. These detectors exhibit high sensitivity to γ-rays while maintaining low sensitivity to neutrons, making them particularly suitable for TOF measurements. Furthermore, their fast timing response ensures precise time resolution, which is crucial for TOF experiments (A. Borella et al. 2007). The detectors are positioned at 110° relative to the sample target. This specific angular configuration was selected to minimize the effects of potential anisotropies in the emission of capture γ-rays, and to reduce background signals generated by in-beam γ-rays scattered from the sample (F. García-Infantes et al. 2024).
2.2. Time-of-flight Method
The TOF method is essential to determine the neutron energy in a white neutron beam. After a proton pulse impinges on the tungsten target, the spallation reaction produces an intense γ-flash that arrives at the C6D6 detector first (J. Ren et al. 2021). The γ-flash arrival time (tγ) serves as the timing reference and can be precisely calculated using

where L is the distance between the spallation target outer surface and detector front face, c is light speed. The neutron flight time (tn) is determined by

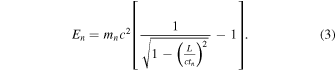
where tmn is the observed time of neutrons and tmγ is the observed time of γ-flash. Thus, the incident neutron energy (En in MeV) can be calculated:
2.3. Sample Parameters
Six main targets were used in this measurement: lithium iodide, cesium carbonate, natural carbon, lead, an aluminum box, and an empty target. Their parameters are shown in Table 1. The powdered samples of lithium iodide and cesium carbonate were separately packed in the disk-shaped aluminum box. The pellet target with the aluminum box was fastened in the middle of the sample holder before the C6D6 detector system with a piece of KAPTON tape. The natC, natPb, an empty Al box, and the empty target were also measured with the same arrangement to evaluate the experimental backgrounds.
Table 1. The Sample Parameters
| Material | Diameter | Thickness | Mass |
|---|---|---|---|
| (mm) | (mm) | (g) | |
| LiI | 40.00 | 2.00 | 9.64 |
| Cs2CO3 | 40.00 | 2.00 | 10.58 |
| natC | 40.00 | 1.00 | 2.58 |
| natPb | 40.00 | 1.00 | 13.93 |
| Al box | 40.00 | 0.80 | 3.51 |
| 197Au | 40.00 | 0.20 | 4.83 |
| Empty | ⋯ | ⋯ | ⋯ |
Download table as: ASCIITypeset image
natC and natPb are used to determine the background of scattered neutrons and in-beam γ-rays, respectively. The empty target was used to subtract the environmental background and the interaction of the in-beam neutrons with the environment. Besides, a 197Au target was used to calibrate the neutron flight distance L. Additionally, analyzing the results of 197Au can help verify whether the detection system is operating correctly. The 197Au target was also used for absolute normalization via the saturated resonance technique at its 4.9 eV resonance peak (R. L. Macklin et al. 1979). The parameters of the targets are shown in Table 1. To normalize the in-beam γ-ray backgrounds with the black resonance filter technique, a 181Ta–59Co filter was installed in the experimental station ES#1 (J. Ren et al. 2021), about 56 m away from the spallation target.
3. Data Analysis
The data analysis process includes detection efficiency correction using the pulse-height weighting technique, double-bunch unfolding method to resolve overlapping events, background subtraction to remove unwanted counts, correction for multiple scattering and self-shielding effects, and normalization to standardize the data.
3.1. Pulse-height Weighting Technique
The C6D6 detector exhibits relatively low sensitivity to neutrons while maintaining excellent detection efficiency for γ-rays, which renders it particularly advantageous for neutron capture experiments. However, due to the strong energy dependence of the detection efficiency of the C6D6 detector, the measured pulse-height spectrum cannot be directly used to determine the capture yield. Therefore, the pulse-height weighting technique (PHWT) developed by R. L. Macklin & J. H. Gibbons (1967) must be applied to correct for this efficiency variation. This technique requires prior determination of the detector’s response function to γ-rays of varying energies through Monte Carlo simulations, followed by weighted processing of the original energy spectrum to accurately reconstruct the neutron capture cross section (U. Abbondanno et al. 2004).
The probability of detecting at least one cascading emitted γ-rays per neutron capture event ( c) can be written as

where  represents the efficiency of detecting the ith cascading emitted γ-rays in one neutron capture event. As
 is low enough, Equation (4) can be simplified:

The nonlinearity causes c to depend on the deexcitation paths of the compound nucleus. This can be solved by applying a posteriori manipulation on the raw counts to correct the nonlinear energy dependence  to linear energy dependence.

where κ is the proportional coefficient. Hence, Equation (6) can be written as

Sn is the neutron binding energy, and En is the kinetic energy of the incident neutron in the center of the mass system. Then, by multiplying the detector’s raw counts of each depositional energy with a weighting function (WF), PHWT eliminates dependence of c on actual deexcitation path. The weighting functions are four stairs polynomial functions of the deposited energy of C6D6 detectors:

where the coefficients aj can be determined by the least-squares method:

where Ed is the deposited energy in the C6D6 detectors, El is low deposited energy threshold of C6D6,  is response function of detector to the jth gamma with energy
 determined by Geant4 Monte Carlo simulation (J. Allison et al. 2016; G. L. Yang et al. 2024). The weighted C6D6 detection efficiency and weighting function for iodine and cesium are shown in Figure 3.
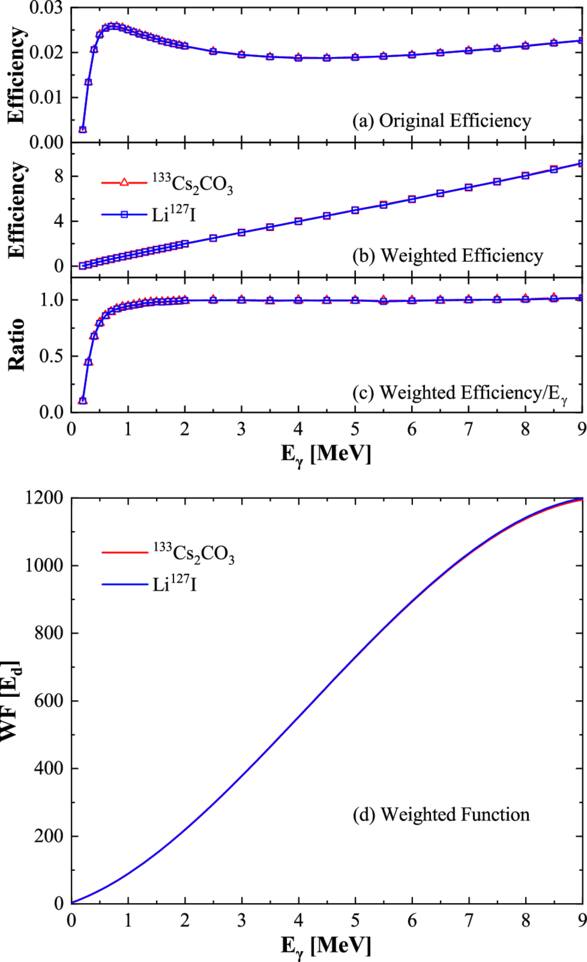
Figure 3. (a) The C6D6 original efficiency. (b) Weighted efficiency. (c) The ratio of weighted efficiency to γ-ray energy. (d) Weight function of C6D6 detector.
Download figure:
Standard image High-resolution image3.2. Double-bunch Unfolding Method
When CSNS operates in normal mode, two equivalent bunches with a 410 ns interval are generated in one pulse. This will cause the superposition of neutrons with different energies in the two bunches, reducing the TOF measurement resolution. Based on Bayes’ theorem, H. Yi et al. (2020) developed an interactive double-bunch unfolding method that can restore the double-bunch spectrum to the single-bunch to improve both temporal and energy resolution, and to avoid some oscillations caused by the matrix inversion method. The relationship between the double-bunch results and the single-bunch results is as follows:

The counts of the ith bin of the double-bunch spectrum Ei are contributed equally by the counts of the ith bin of the single-bunch spectrum Ci and the counts of the bin that is 410 ns apart from Ci−Δ. This could be written in the form of a matrix:

where R is the response matrix, with Rij = 1/2 when i equals j or j − Δ, and 0 otherwise. Explaining the energy spectrum as a mathematical function that describes the probability of different possible values of energy, let P(Ci) = Ci, P(Ej) = Ej, and P(Ej∣Ci) be the element Rji of the response matrix, by applying the Bayes’ theorem (G. D’Agostini 1995), the estimation  of Ci can be expressed as
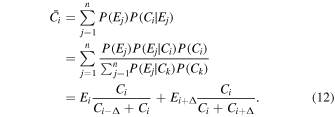
Through iterative solving of Equation (12), the estimator  asymptotically converges to the true value Ci:

where  is the kth iteration result. The initial
 is set as the Ei measured in the double-bunch distribution. The effect of this method is illustrated in Figure 4.
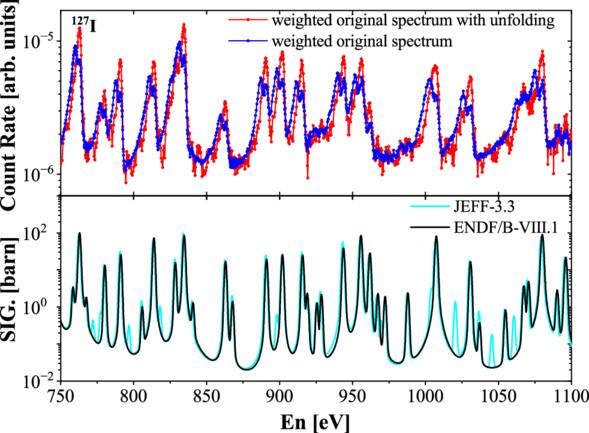
Figure 4. Comparison between the weighed original spectrum (blue curve) of Li 127I sample and the weighted original spectrum with the unfolding process (red curve).
Download figure:
Standard image High-resolution image3.3. Background Subtraction
The analysis of neutron capture reactions requires careful treatment of background contributions to obtain the true counts of the (n,γ) reaction. The preprocessed and normalized original spectra for various targets are shown in Figure 5, necessitating systematic background subtraction. The total background comprises three principal components: (i) empty background Nempty measured using empty target configurations, (ii) activation background (Nac) from radioactive decay of reaction products that is relatively constant within a certain time range, and (iii) target-dependent background Nsample that includes both neutron scattering Nsn and in-beam γ-ray Nsγ contributions (J. Ren et al. 2020; X. K. Li et al. 2022). Thus, the composition of the background is


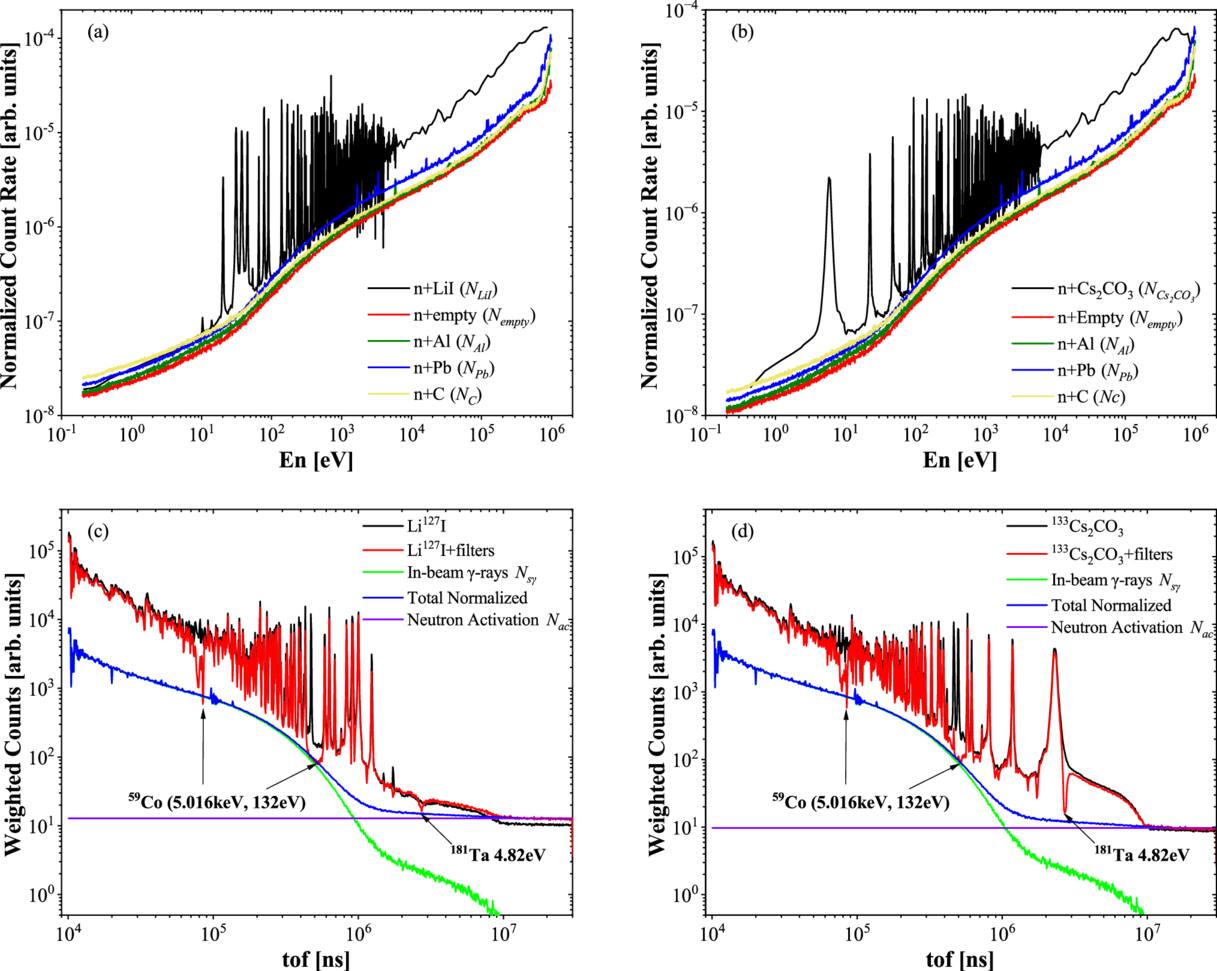
Figure 5. Preprocessed and normalized original spectra of (a) 127I, (b) 133Cs, natC, natPb, Al box, and empty target. Spectra of (c) 127I, (d) 133Cs without and with filter.
Download figure:
Standard image High-resolution imageFor measurements in the epithermal energy range (En < 0.3 eV, corresponding to neutron flight times >10.7 ms), the γ-ray background becomes negligible while neutron absorption by cadmium filters effectively eliminates scattered neutron effects. This permits determination of activation background Nac through characteristic plateau fitting in the time spectra (X. K. Li et al. 2023).
The neutron scattering background was quantified using carbon as a reference material, taking advantage of its favorable nuclear properties: its neutron capture cross section is relatively small compared to its scattered neutrons cross section, and its in-beam gamma scattering is comparatively low (D. Sun et al. 2025). In the background subtraction procedure, the elastic scattering contributions from Li in LiI and from C and O in Cs2CO3 must be considered. The neutron scattering background induced by the Al box should also be accounted for because lithium iodide powdered samples were packed in the disk-shaped aluminum box. Taking the lithium iodide target as an example, this component was calculated through the relation:

where Yel,C, Yel,Li + Yel,I, and Yel,Al are the neutron scattering yields of the carbon target, lithium iodide target, and Al box, respectively. NC is the spectrum of the carbon target. Nac,C is the activation background.
The in-beam γ-ray background, arising primarily from neutron capture in the water moderator, was characterized using lead targets (Pb) and the black resonance technique (D. Syme 1982). Lead has a large gamma scattering cross section and a small neutron capture cross section. Normalization factors K were determined through comparative measurements conducted with and without 181Ta–59Co filters at distinct strong absorption resonance energies, at which point the counts are mainly contributed by in-beam γ-rays (as shown in Figure 5). The in-beam γ-ray background extracted from the spectrum of Pb (green line) is normalized to the counts at 4.28 eV, 132 eV, and 5.02 keV.


where NPb is the spectrum of the lead target, Nempty is the empty background, Nsn,Pb is the neutron scattering background caused by lead target Nac,Pb is the activation background. The effect of the black resonance technique is shown in Figure 5.
For the lithium iodide and cesium carbonate target, which was contained within the Al box, the spectrum of the Al box (NAl) effectively represents the counts from the Al box plus the environmental background. Thus, the total background is

Finally, the true counts of the (n,γ) reaction of the target can be expressed as

where NLiI is the spectrum of the lithium iodide target.
This comprehensive approach accounts for all significant background sources, providing reliable background subtraction across the entire energy range of interest, from thermal to keV neutron energies.
Besides, it should be noted that the neutron capture cross section contribution from natLi in LiI, natC, and natO in Cs2CO3 cannot be experimentally or computationally separated. However, since these light elements natLi, natC, and natO, exhibit negligible resonance peaks in the 1 eV to 1 MeV energy range, and their (n,γ) cross sections are approximately three orders of magnitude smaller than those of the target nuclei (127I and 133Cs, respectively). Thus, their impacts on the final results were justifiably neglected.
3.4. Multiple Scattering and Self-shielding Effects Correction
In the URR above 4 keV, two competing nuclear effects introduce significant systematic uncertainties (X. X. Li et al. 2021b): (i) multiple scattering effect: due to multiple elastic scattering of incident neutrons in the target material, the average path length traveled by particles exceeds the physical thickness of the target. (ii) self-shielding effects cause an exponential attenuation of incident neutron flux intensity I with penetration depth x (C. Wang et al. 2016) according to:

where n is the atomic density and σtot is the total neutron cross section given by evaluated data of ENDF/B-VIII.1.
These effects are inherently unavoidable in experiments and cannot be corrected through experimental methods alone. In the RRR, the SAMMY program implements first-principles corrections for these effects. In the URR, multiple scattering is corrected using a dimensionless factor fc, derived from Geant4 simulations based on the material and geometric parameters of the target (Z. D. An et al. 2023; H. Liang et al. 2026). The ratio of the average path length in the target obtained from Geant4 simulations to the target physical thickness is defined as the fc factor. The energy-dependent behavior of fc is presented in Figure 6. A significant bulge is observed around 260 keV, where lithium reaches its maximum elastic scattering cross section of 11.46 barns due to the strong contribution from Li in the LiI compound. Oxygen also exhibits notable elastic scattering, with cross sections of 16.52 barns at 434 keV and enhanced values in the energy ranges 257.41–513.29 keV and 851.48–1000 keV, leading to distinct resonance features in these regions. In contrast, carbon maintains a moderate elastic scattering cross section between 2 and 5 barns across the URR, but does not produce significant resonant peaks.
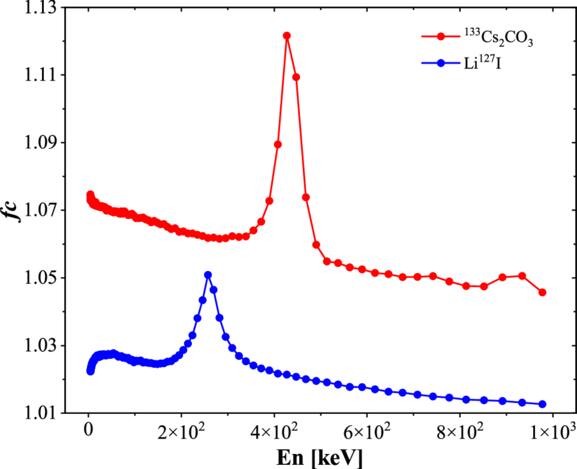
Figure 6. The multiple scattering and self-shielding correction factor fc curve of the samples calculated with Geant4.
Download figure:
Standard image High-resolution image3.5. Yields and Cross Sections
The PHWT was applied to determine the fraction of the incident neutron beam that were absorbed via neutron capture reactions within the sample, namely the neutron capture yield (Yw):

where Nw is the target counting spectrum after background subtraction, I denotes the neutron intensity, c denotes the possibility of detecting neutron capture events expressed by Equation (7), and F is the normalization factor, which is determined by applying the saturated resonance technique at the 4.90 eV resonance of 197Au. Finally, the absolute value for neutron capture cross section σγ can be obtained by

where σγ is the neutron capture cross section of the target, Ns denotes the atomic areal density of the sample.
3.6. Uncertainty Budget
The main uncertainty sources are shown in Table 2, including experimental conditions uncertainty, data analysis method uncertainty, and experimental statistical error.
Table 2. Uncertainties of This Work
| Uncertainty | Uncertainty Source | Value |
|---|---|---|
| Experiment conditions | ||

| Energy spectrum (<150 keV) | <8.0% |

| Energy spectrum (>150 keV) | <4.5% |
| σsample | Sample parameter | <0.5% |
| σbeam power | Proton beam power | <1.5% |
| Data analysis | ||
| σPHWT | PHWT method | <2.0% |
| σunfolding | Double-bunch unfolding method | <2.0% |
| σnorm | Normalization | <1.5% |
| Statistical error | ||
| σstatistic,I | 127I experiment | <2.9% |
| σstatistic,Cs | 133Cs experiment | <2.3% |
| Total error for 127I experiment | ||
| σtotal,I | below 150 keV | <9.2% |
| above 150 keV | <6.4% | |
| Total error for 133Cs experiment | ||
| σtotal,Cs | below 150 keV | <9.1% |
| above 150 keV | <6.2% | |
Download table as: ASCIITypeset image
The uncertainty of experimental conditions includes the uncertainty of the neutron spectrum, sample parameters, and proton beam power. The uncertainty of the neutron energy spectrum is determined by Y. Chen et al. (2019) based on the analysis of Back-n neutron beam spectrum using calibrated Li-Si detectors and a fission chamber. Before the experiment, the errors in the sample target’s geometric parameters were determined, and target material purity was also considered, ultimately controlling the total uncertainty of the sample target within 0.5%. During the experiment, the uncertainty of the proton beam current was recorded, which was about 1.5%. The systematic uncertainty associated with PHWT must be considered in this work. Following the methodology validated by U. Abbondanno et al. (2004), who demonstrated that the PHWT applied to C6D6 data with Monte Carlo calculated weighting factors is able to achieve an accuracy of 2% or better, we have adopted a conservative estimate of 2% for this contribution in our total uncertainty budget.
H. Yi et al. (2020) applied an iterative error-propagation method to estimate the uncertainty in double-bunch unfolding. Monte Carlo simulations confirmed that the pull-value standard deviation approaches unity. This was further validated by comparing measured single- and double-bunch energy spectra, which yield normally distributed pull values within [−2, 2] interval. The overall unfolding uncertainty was found to be ∼2.5%, supporting the statistical reliability of the error assessment.
The normalization uncertainty is conservatively estimated to be less than 1.5% (J. Ren et al. 2022; F. García-Infantes et al. 2024). The statistical error for the 127I and 133Cs experiments is less than 2.25% and less than 2.92%, respectively. According to the error propagation, the overall total error was derived (G.-L. Yang et al. 2023). Therefore, the experimental results presented in this study demonstrate relatively high precision, with errors controlled within approximately 10% across the entire energy range from 1 eV to 1 MeV.
4. Results
4.1. Resolved Resonance Region
In this work, the R-matrix SAMMY code was used to analyze neutron capture yields and extract resonance parameters in the energy range from 1 eV to 4 keV. The capture yields of 127I and 133Cs were fitted using the Reich–Moore approximation within the multilevel R-matrix framework (N. M. Larson & F. G. Perey 1980). A channel radius of 8.50 fm and a temperature of 293 K were adopted to account for the Doppler effect. SAMMY takes into account systematically experimental effects such as Doppler and resolution broadening, self-shielding, and multiple neutron scattering in the sample (C. Lederer-Woods et al. 2019). The resonance broadening due to the neutron energy resolution function was modeled using the implemented RPI parameterization (B. Jiang et al. 2021). From the measured capture yields, resonance parameters such as resonance energy ER, radiation width Γγ, neutron width Γn, and orbital angular momentum l were extracted. In many cases, only the resonance energy ER and the total capture kernel k are considered as the real measurable quantities due to the coupling between Γγ and Γn. The resonance parameters have been uploaded to the Science Data Bank and are accessible via doi:10.57760/sciencedb.30091. k is proportional to the area under an isolated resonance and expressed as

where g is a statistic factor defined as

where J is the total angular momentum, I represents the spin of the target nucleus in its ground state that must be determined based on the specific characteristics of the sample nucleus, and s denotes the channel spin that is the vector sum of the spin quantum numbers of the two particles in the pair, expressed as

When the incident particle is a neutron, the intrinsic spin i = 1/2, and its parity is positive. According to the coupling rules, i and I can couple to form different channel spins. Additionally, J is the vector sum of the channel spin and the orbital angular momentum, i.e.,

where l is orbital angular momentum. In the SAMMY code, the cross sections for different channels can be precisely calculated by incorporating resonance parameters with the R-matrix formalism, along with transformations of intermediate parameters and intermediate matrices. The SAMMY-fitted results for capture yields are shown in Figure 7.
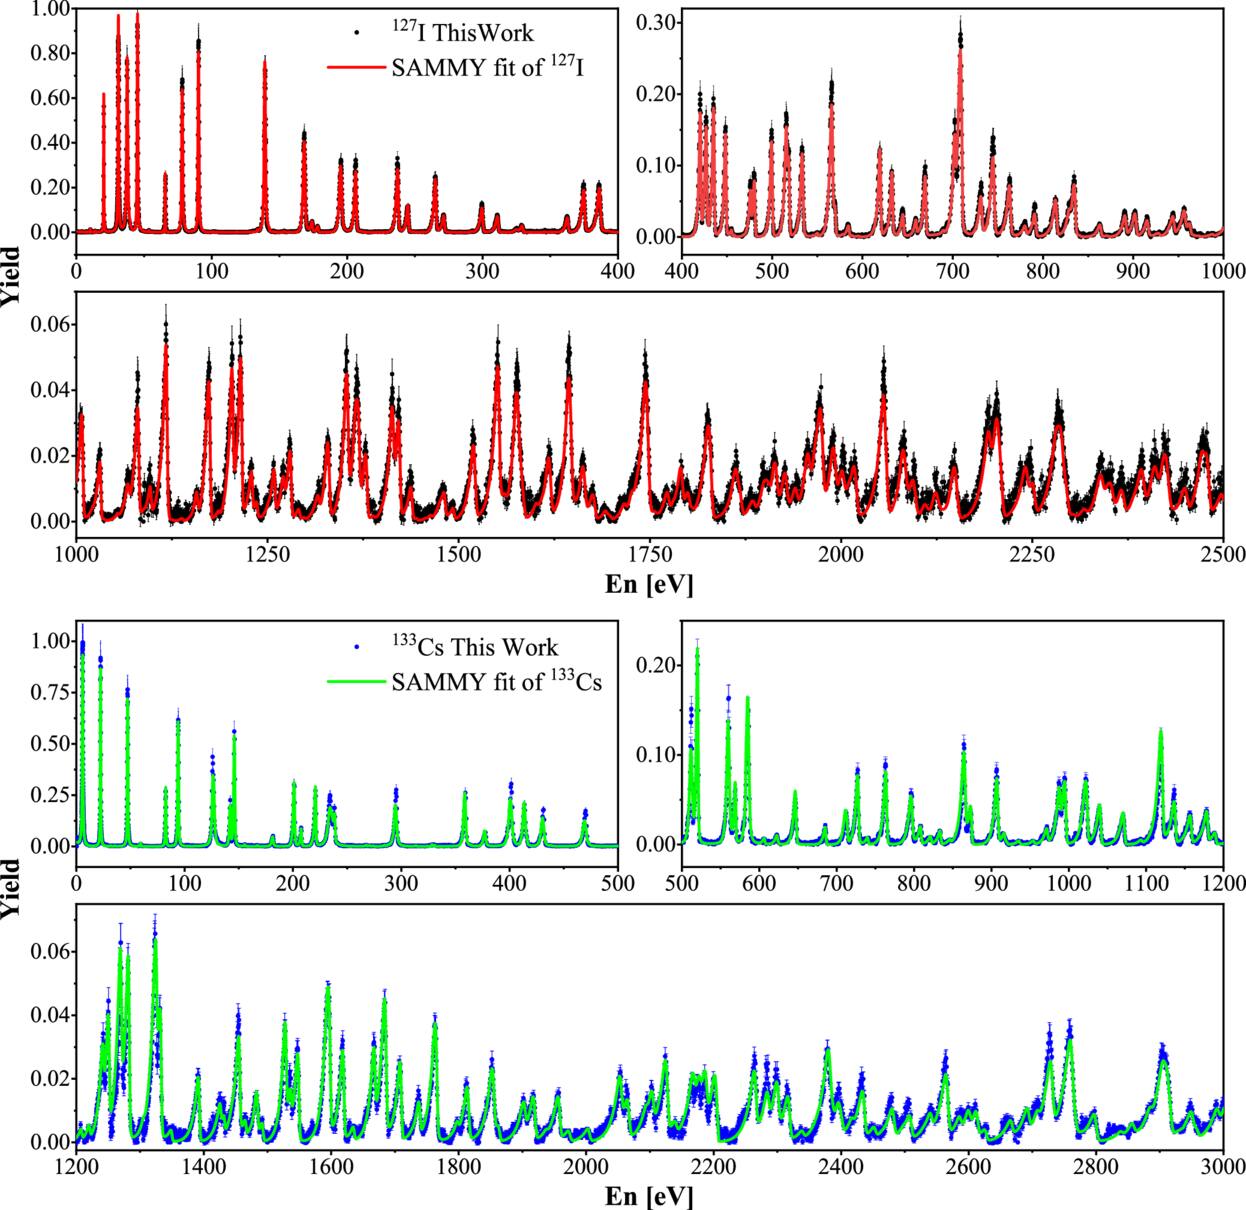
Figure 7. Experimental neutron capture yields in RRR of this work (black dot for 127I and blue dot for 133Cs) and fitted yield curve (red curve for 127I and green curve for 133Cs) by the R-matrix code SAMMY.
Download figure:
Standard image High-resolution imageUsing the resonance parameters from the evaluated nuclear data libraries as initial priors, the SAMMY code performs Bayesian fitting of the experimentally measured neutron cross section data. By iteratively adjusting the initial parameters and evaluating their uncertainties, the final resonance parameters in the RRR of this work were obtained. 127I employs resonance parameters from both the JEFF-3.3 and ENDF/B-VIII.1 as input, 133Cs employs resonance parameters from both JENDL-5 and ENDF/B-VIII.1 as input.
The fitted neutron capture yields Ysammy are converted into neutron capture cross sections σsammy by

The quality of the R-matrix SAMMY fits was assessed through residual analysis. The corresponding residual values in the RRR are provided in doi:10.57760/sciencedb.30091, confirming that the SAMMY fits describe the experimental data within uncertainties.
4.1.1. Resolved Resonance Region of 127I
The σsammy result in RRR of 127I is shown in Figure 8. The RRR of 127I is analyzed below.
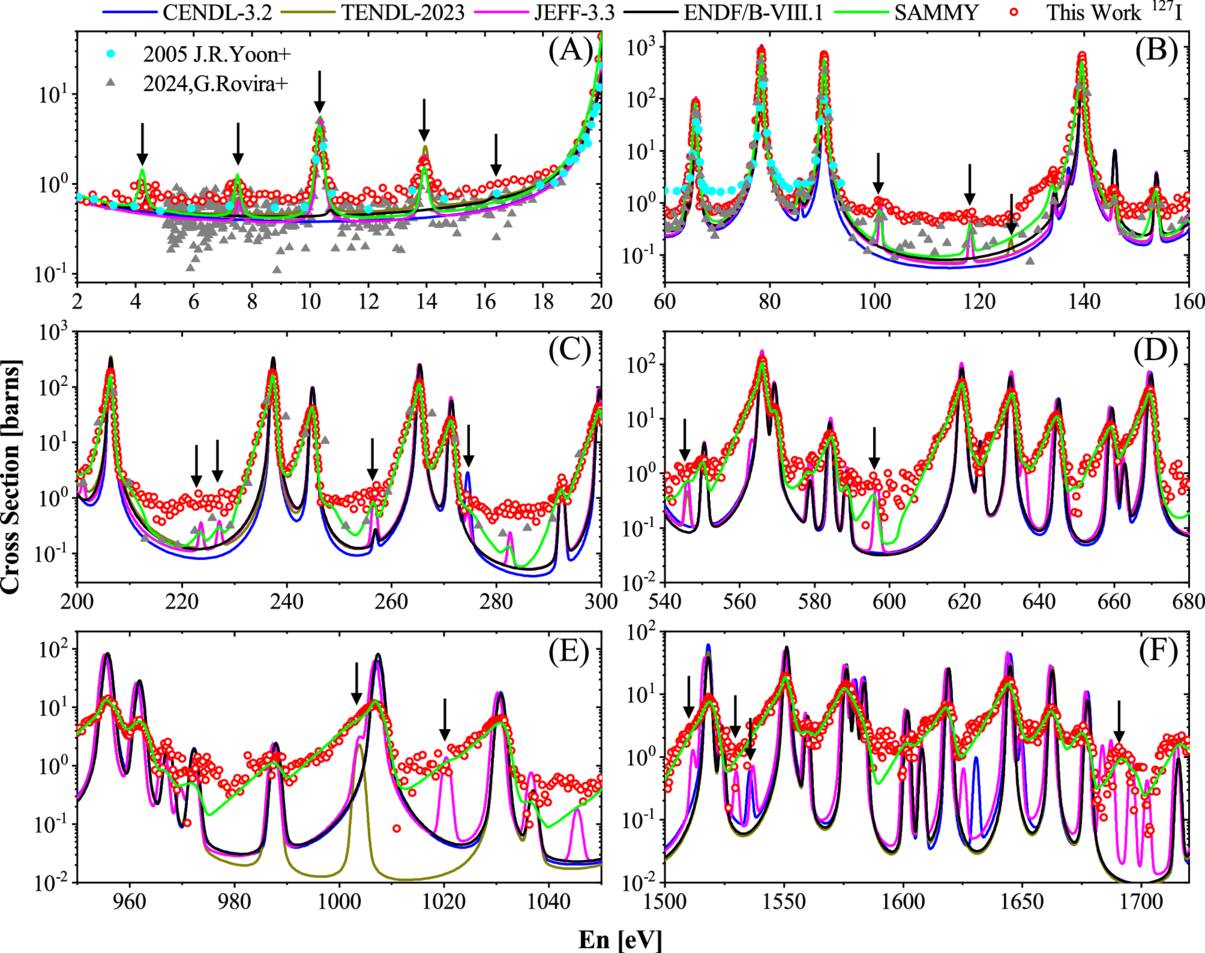
Figure 8. Comparison of neutron capture cross section in RRR calculated with experimental yield of this work 127I (red dot), SAMMY-fitted cross section (green curve), and evaluated values from various evaluated libraries.
Download figure:
Standard image High-resolution image(A) In the 1–20 eV resonance region, evaluated nuclear data libraries exhibit discrepancies (as shown in Figure 8): ENDF/B-VIII.1 and BROND-3.1 both identify three same resonance peaks at 4.41, 10.70 and 16.30 eV with low amplitude; JEFF-3.3 and JENDL-5 display three well-resolved overlapping peaks at 7.55, 10.35 and 13.95 eV; TENDL-2023 shows resonances at 7.55, 10.35 and 13.95 eV, while CENDL-3.2 shows no peaks in this region. The experimental data provided by J. Yoon et al. (2005) contains limited data points within this range, with only the prominent peaks at 10.33 and 13.93 eV being clearly identifiable. This work confirms four resonance structures at 4.43 eV (matching ENDF/B-VIII.1), 7.53 eV (consistent with TENDL-2023), 10.33 eV (aligned with TENDL-2023), and 13.93 eV (matching JENDL-5 and TENDL-2023). The resonance peak structures revealed by our experimental data are more precise than those reported by J. Yoon et al. (2005).
(B) In the 60–160 eV resonance region, two resonance peaks reported in JEFF-3.3 but absent in ENDF/B-VIII.1 were experimentally confirmed in this work at 101.10 and 118.27 eV. A small resonance is reported in TENDL-2023 at 126.01 eV, but could not be resolved in our measurement due to the high experimental background in this energy region.
(C) Two small resonances unique to JEFF-3.3 at 223.62 and 227.12 eV were obscured by experimental background but were still incorporated as priors in SAMMY’s Bayesian analysis. The observed resonance at 256.72 eV in this work is higher than in ENDF/B-VIII.1 and CENDL-3.2, with its peak height aligning more closely with JEFF-3.3. The observed resonance at 274.53 eV in this work is lower compared to CENDL-3.2, demonstrating better agreement with JEFF-3.3, while ENDF/B-VIII.1 shows no resonance here.
(D) The measured cross section shows a distinct resonance at 545.97 eV, supporting CENDL-3.2 and JEFF-3.3 here, in contrast to its absence in TENDL-2023 and ENDF/B-VIII.1. Our results show a distinct resonance at 595.15 eV, which is reported in JEFF-3.3 but absent in ENDF/B-VIII.1.
(E) Variations in resonance peak positions are observed among evaluated nuclear data libraries in the vicinity of the 1007.00 eV energy region: ENDF/B-VIII.1, CENDL-3.2 and BROND-3.1 show consistent peak locations at 1007.40 eV; TENDL-2023 exhibits a peak at 1003.80 eV with relatively lower amplitude; JEFF-3.3 positions its peak at 1006.79 eV; while JENDL-5 uniquely displays a double-peak structure at 1003.80 and 1006.79 eV in this energy range. This work identifies only a single resonance peak at 1007.68 eV, which aligns most closely with the ENDF/B-VIII.1, CENDL-3.2 and BROND-3.1 peak positions, demonstrating a deviation of just 0.28 eV. The peak at 1020.4 eV that exists only in JEFF-3.3 is supported by our data.
(F) However, due to peak broadening effects caused by the relatively low energy resolution, not all peaks reported in JEFF-3.3 could be unambiguously resolved, particularly minor peaks located in resonance troughs or those adjacent to dominant resonances, for example: 1511.70, 1529.90, and 1536.90 eV. To resolve these discrepancies, higher-precision experimental determinations at the specified resonance energies are required. Four resonance peaks, 1683.60, 1687.20, 1695.80, and 1702.40 eV, are reported in JEFF-3.3 but absent in other evaluated libraries; the results of this work only confirm two clear peaks at 1691.54 and 1696.61 eV.
4.1.2. Resolved Resonance Region of 133Cs
The σsammy result in RRR of 133Cs is shown in Figure 9. The RRR of 133Cs is analyzed below based on our experimental results.
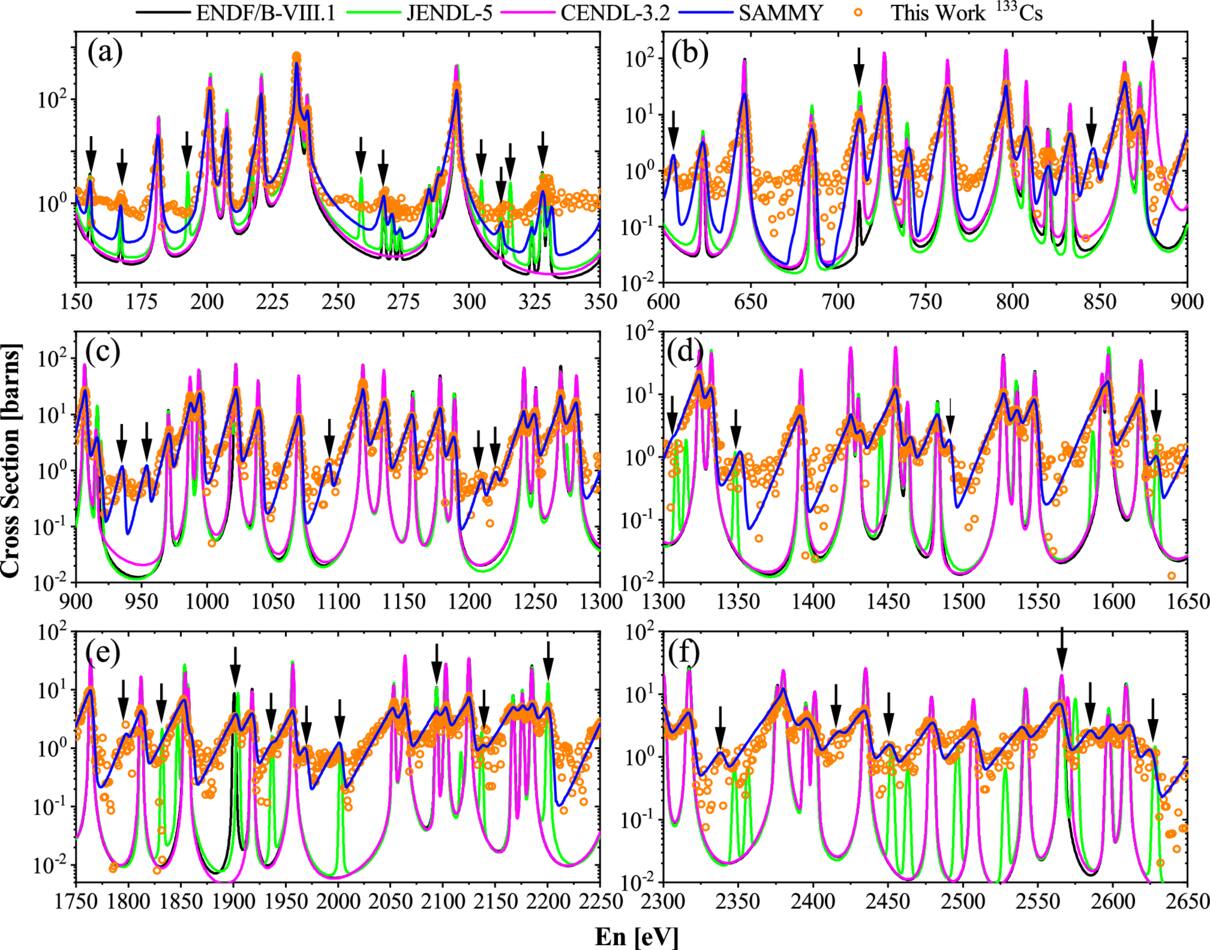
Figure 9. Comparison of neutron capture cross section in RRR calculated with experimental yield of this work 133Cs (red dot), SAMMY-fitted cross section (purple curve), and evaluated values from various evaluated libraries.
Download figure:
Standard image High-resolution image(a) This work reveals some discrepancy in the CENDL-3.2. From 150 to 350 eV, CENDL-3.2 fails to include multiple resonance structures, particularly weaker peaks, for example, at 155.55, 167.60, 267.90, 270.85, 272.74, 312.87, 324.11, 328.65, and 332.21 eV, that are consistently documented in other evaluated libraries and are now experimentally confirmed by this work. No definitive experimental evidence has been found to confirm the existence of the resonance peaks at 192.68, 258.85, 304.75, and 315.8 eV reported by JENDL-5.
(b) At 605.73 eV, a new evident resonance structure was observed in the experimental results, which is not supported by other evaluated data or previous work. The resonance peak observed in the experimental data at 712.03 eV aligns more closely with the JENDL-5, rather than ENDF/B-VIII.1 and CENDL-3.2. Therefore, resonance parameters given by JENDL-5 at 712.03 eV were selected as the input parameter to calculate the kernel ratio, which was determined to be 1.41. At 846.08 eV, a new resonance structure was observed in the experimental results, which is not supported by other evaluated data or previous work. No definitive experimental evidence has been found to confirm the existence of the resonance peaks at 880 eV reported by CENDL-3.2.
(c) At 935.40 and 954.16 eV, two new adjacent resonance structures were observed in the experimental results after examining the raw spectrum and the spectrum with the double-bunch unfolding method, which were not reported by other evaluated data. At 1093.22 eV, a new resonance structure was observed in the experimental results, which is not supported by other evaluated data or previous work. Two adjacent resonance structures were identified, located at 1209.04 and 1220.31 eV, respectively.
(d) JENDL-5 gives resonances at 1347.87 and 1629.40 eV, while no corresponding resonance structure is reported by other evaluated nuclear data libraries. These resonances are confirmed in this work, located at 1350.17 and 1632.67 eV respectively. However, due to peak broadening effects caused by the relatively low energy resolution, the existence of some additional resonance peaks reported in JENDL-5 cannot be definitively confirmed in this work, for example 1308.45 and 1315.01 eV. Higher-resolution measurements at these energy positions are required to clarify discrepancies. At 1491.08 eV, a new resonance structure was observed in the experimental results.
(e) At 1797.39 eV, a new resonance structure was observed in the experimental results after examining the raw spectrum and the spectrum with the double-bunch unfolding method. No definitive experimental evidence has been found to confirm the existence of the resonance peaks at 1832.12 eV reported by JENDL-5. ENDF/B-VIII.1 shows a resonance peak at 1901 eV, while JENDL displays a peak at 1904.49 eV, and CENDL-3.2 shows no corresponding peak structure in this region. This work exhibits a peak structure at 1902.47 eV, which demonstrates the difference between ENDF/B-VIII.1 and JENDL-5. At 1968.67 eV, a new resonance structure was observed in the experimental results. Resonances at 1937.00, 2002.51, 2137.01, and 2200.48 eV given in JENDL-5 but not reported by other evaluated libraries are confirmed in this work. The peak cross section of resonance at 2092.82 eV shows significantly better agreement with the JENDL-5 and ENDF/B-VIII.1 than with CENDL-3.2.
(f) JENDL-5 gives resonances at 2452.32 and 2628.35 eV, while no corresponding resonance structure is reported by other evaluated libraries. These resonances are confirmed in this work, located at 2453.84 eV, 2624.82 eV respectively. While JENDL-5 gives a resonance at 2347.37 eV, this work suggests this resonance position at 2337.88 eV, revealing a distinct 9.49 eV peak position difference. At 2412.02 eV, a new resonance structure is observed in the experimental results but not clearly resolved due to the relatively low energy resolution, highlighting the need for higher-resolution measurements to confirm this finding. In the energy range of 2550 to 2590 eV, significant discrepancies exist among various evaluated nuclear data libraries. JENDL-5 shows two distinct peaks at 2565.50 and 2575.07 eV, while CENDL-3.2 similarly exhibits a double peak at 2566 and 2570 eV. In contrast, JEFF-3.3 and TENDL-2023 both show only one single peak at 2564.60 eV, ENDF/B-VIII.1 and BROND-3.1 both show only one single peak at 2566 eV. This work resolves two clear resonances at 2564.51 and 2584.91 eV, demonstrating closer alignment with JENDL-5 and CENDL-3.2 in terms of resonance structure. But the peak at 2584.91 eV shows larger energy offsets relative to JENDL-5 and CENDL-3.2.
4.2. Unresolved Resonance Region
The averaged experimental neutron capture cross sections of this work in unresolved resonance energy (URR) from 4 keV to 1 MeV are accessible via doi:10.57760/sciencedb.30091. In Figure 10, the averaged cross sections of this work in URR are compared with previous experimental results and evaluated libraries.
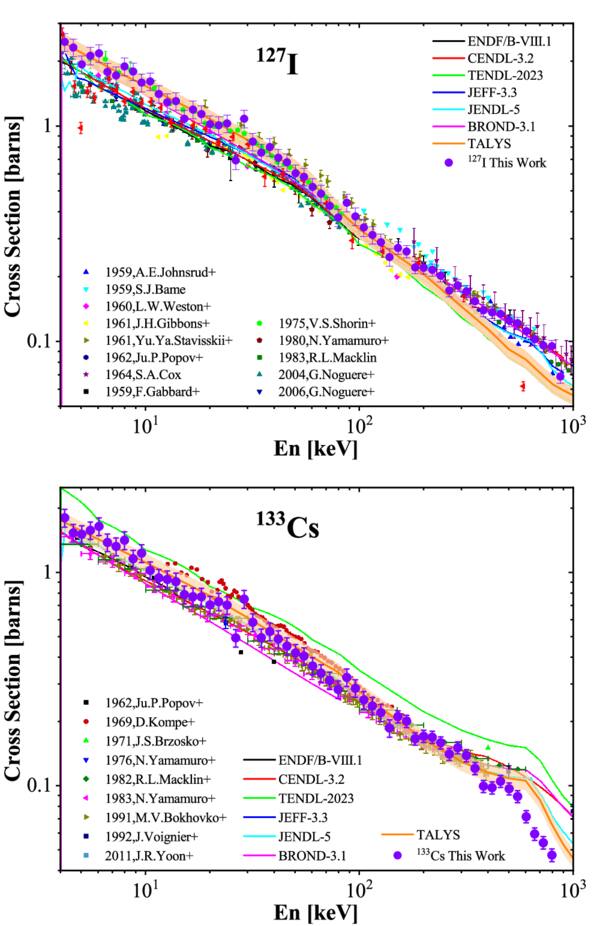
Figure 10. The averaged capture cross sections of 127I and 133Cs in the URR.
Download figure:
Standard image High-resolution imageIn the URR of 127I, our cross sections between 4 and 40 keV demonstrate closer consistency with the experimental data reported by V. S. Shorin et al. (1975). The data from Y. Y. Stavisskii et al. (1961) are higher than our measured values in the range from 19 to 116 keV. The cross section data reported by (G. Noguère et al. 2005) extend up to 100 keV; while their values are significantly lower than both our results and those of other evaluated libraries in the energy region 4–20 keV, they show good agreement with our data above 30 keV. The data from S. J. Bame & R. L. Cubitt (1959) are higher than our measurements above 80 keV. Between 180 and 1000 keV, the data reported by S. A. Cox (1964) are higher than our measurements
In the URR of 133Cs, the evaluated data given by TENDL-2023 are globally higher than those in other evaluated libraries, as well as our results. The majority of the experimental data follow the trend of our work. In contrast, the results reported by D. Kompe (1969) are systematically higher but show better agreement with TENDL-2023. The experimental cross section from this work drops abruptly above 500 keV, falling below the evaluated libraries.
The TALYS code (A. Koning et al. 2023) is used to describe the average cross sections of 127I and 133Cs in URR. The input parameters of the TALYS code are obtained from the statistics of RRR results, including s-wave average resonance space (D0) and average experimental cross sections (D. Sun et al. 2026). The comparison of TALYS calculation radiative capture width at the separation energy (〈Γγ〉), which enforces consistency of the RRR posterior resonance parameters and the prior average resonance parameters in the URR. Slight adjustments of some parameters of the global neutron optical model potential had been conducted to make the calculation reproduce the available experimental results for each isotope, with the evaluated data and previous experimental data shown in Figure 10.
For 127I, the neutron capture cross sections of this work are basically consistent with the theoretical averaged cross section predicted by the TALYS code. Above 400 keV, our experimental data are located above the TALYS predictions. For 133Cs, our measurements and the majority of previous work fall within the 10% error margin of the TALYS predictions. Above 500 keV, the measured cross section exhibits a sudden decrease, deviating downward from the predictions of the TALYS theoretical model.
4.3. Maxwellian-averaged Cross Sections
The MACS at 30 keV is the primary focus for most astrophysical studies when calculating s-process branching (Z. Bao et al. 2000). In order to investigate the s-process involving 127I and 133Cs within the stellar context, it is essential to integrate the (n,γ) cross sections with the kinetic energy distribution of neutrons (En) present in the stellar plasma. This integration is performed using Equation (29) to derive the MACS (Y. B. Li et al. 2026)

where σ(En) is the experimental averaged capture cross sections measured at the energy of En in this work. The MACSs from kT = 5–100 keV of 127I and 133Cs calculated by this work (as shown in Figure 11 and Table 3) and data from Karlsruhe Astrophysics Database of Nucleosynthesis in Stars (KADoNiS v0.3, I. Dillmann et al. 2014), previous experimental work, and the evaluated database are also shown as reference. As shown, there are differences between this work and the evaluated values.
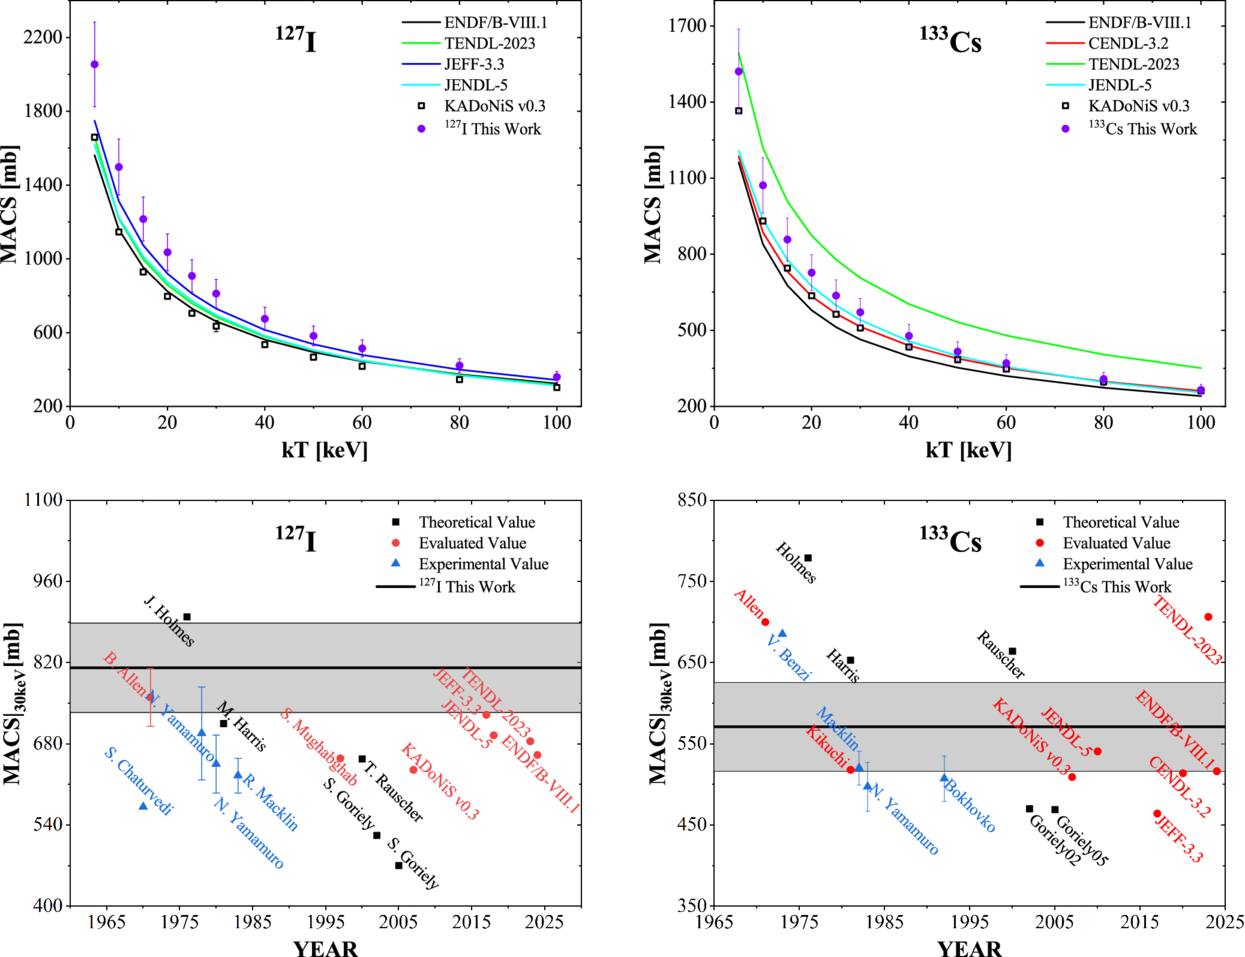
Figure 11. Comparison of the MACSs calculated by Talys code, evaluated data, and previous experiments. Comparison of the MACS at thermal energy kT = 30 keV in this work (black solid lines and gray regions that show the uncertainties), theoretical data (black dots), evaluated data (red dots), and previous works (blue triangles).
Download figure:
Standard image High-resolution imageTable 3. This Experiment is Compared with the MACSs of KADoNiS v0.3 about 127I and 133Cs at kT = 5–100 keV
| kT | 127I (mb) | 133Cs (mb) | ||
|---|---|---|---|---|
| (keV) | This Work | KADoNiS | This Work | KADoNiS |
| 5 | 2054 ± 228 | 1659 | 1521 ± 167 | 1365 |
| 10 | 1498 ± 152 | 1145 | 1071 ± 109 | 931 |
| 15 | 1215 ± 120 | 929 | 858 ± 85 | 745 |
| 20 | 1035 ± 100 | 797 | 727 ± 71 | 636 |
| 25 | 908 ± 87 | 705 | 637 ± 62 | 563 |
| 30 | 811 ± 77 | 635 | 571 ± 55 | 509 |
| 40 | 675 ± 63 | 535 | 478 ± 45 | 434 |
| 50 | 582 ± 53 | 467 | 416 ± 38 | 384 |
| 60 | 515 ± 46 | 417 | 371 ± 34 | 347 |
| 80 | 422 ± 37 | 345 | 308 ± 27 | 296 |
| 100 | 359 ± 30 | 302 | 265 ± 22 | 262 |
Download table as: ASCIITypeset image
In the energy range of 5–100 keV, the MACSs of 127I demonstrate better consistency with values of JEFF-3.3. Among all evaluated nuclear data libraries, the KADoNiS database, which primarily references the experimental data from R. L. Macklin (1983), provides systematically lower evaluated values compared to other libraries and our experimental results. The MACS of 127I at kT = 30 keV is 811.1 ± 77.1 mbarn, which is consistent with the evaluated values of B. J. Allen et al. (1971), JEFF-3.3. The theoretical value of J. A. Holmes et al. (1976) is higher than that of this work. This work is slightly higher than most existing data and most theoretical values.
In the energy range of 5–100 keV, the MACSs of 133Cs are higher than those in the major evaluated libraries, except for TENDL-2023. As the neutron energy increases, the discrepancies between the present work and other evaluated databases gradually diminish, demonstrating a convergence trend. The MACS of 133Cs given by this work show closer agreement with the values from JENDL-5. The MACS of 133Cs at kT = 30 keV was determined to be 570.9 ± 54.7 mbarn, which is approximately 12% higher than that in the KADoNiS v0.3 (509 mb). The theoretical value of J. A. Holmes et al. (1976), M. J. Harris (1981), and T. Rauscher & F.-K. Thielemann (2000), the experimental value of V. Benzi et al. (1973), and the evaluated values of B. J. Allen et al. (1971) and TENDL-2023 are higher than this work at kT = 30 keV. The experimental value of R. L. Macklin (1982) and the evaluated value from Y. Kikuchi et al. (1981), JENDL-5, CENDL-3.2, and ENDF/B-VIII.1 fall within the uncertainty range of this work. The experimental values of N. Yamamoto et al. (1983) and M. V. Bokhovko et al. (1992), the evaluated value from JEFF-3.3, are lower than that of this work.
5. Reaction Rate and Its Astrophysical Applications
Based on MACSs, the corresponding astrophysical reaction rate NA < σν > was also calculated:

where NA is the Avogadro number, ν =  is the mean thermal velocity, and μ is the reduced mass. Table 4 shows the reaction rate obtained in this work, along with its ratio to those from previous studies, as shown in Figure 12. This work obtained experimental neutron capture cross section data from 1 eV to 1 MeV. The broad energy coverage provides high-precision input, ensuring a more accurate calculation of the reaction rate.
Table 4. Experimentally Derived Reaction Rates of 127I and 133Cs(n,γ) in This Work (107 cm3 mol −1 s −1)
| T9 | 127I(n,γ) | 133Cs(n,γ) | ||||
|---|---|---|---|---|---|---|
| (GK) | Low | Median | High | Low | Median | High |
| 0.02 | 8.31 | 9.61 | 10.91 | 7.50 | 6.53 | 8.47 |
| 0.03 | 9.05 | 10.41 | 11.76 | 8.05 | 7.04 | 9.05 |
| 0.03 | 9.57 | 10.95 | 12.32 | 8.39 | 7.38 | 9.41 |
| 0.04 | 10.22 | 11.60 | 12.98 | 8.77 | 7.75 | 9.78 |
| 0.05 | 10.60 | 11.96 | 13.33 | 8.93 | 7.93 | 9.93 |
| 0.06 | 10.83 | 12.18 | 13.53 | 9.00 | 8.02 | 9.98 |
| 0.07 | 10.99 | 12.32 | 13.65 | 9.03 | 8.06 | 9.99 |
| 0.08 | 11.09 | 12.40 | 13.72 | 9.03 | 8.08 | 9.98 |
| 0.09 | 11.16 | 12.46 | 13.76 | 9.02 | 8.08 | 9.95 |
| 0.10 | 11.21 | 12.50 | 13.79 | 9.00 | 8.07 | 9.92 |
| 0.11 | 11.24 | 12.52 | 13.80 | 8.97 | 8.06 | 9.89 |
| 0.12 | 11.26 | 12.53 | 13.80 | 8.95 | 8.04 | 9.86 |
| 0.13 | 11.27 | 12.53 | 13.79 | 8.92 | 8.02 | 9.82 |
| 0.14 | 11.27 | 12.52 | 13.77 | 8.89 | 8.00 | 9.78 |
| 0.15 | 11.26 | 12.50 | 13.75 | 8.86 | 7.97 | 9.74 |
| 0.16 | 11.25 | 12.48 | 13.72 | 8.83 | 7.95 | 9.71 |
| 0.18 | 11.21 | 12.43 | 13.65 | 8.76 | 7.90 | 9.63 |
| 0.20 | 11.16 | 12.37 | 13.57 | 8.70 | 7.84 | 9.56 |
| 0.25 | 11.00 | 12.17 | 13.35 | 8.54 | 7.71 | 9.38 |
| 0.30 | 10.81 | 11.96 | 13.10 | 8.40 | 7.59 | 9.21 |
| 0.35 | 10.63 | 11.74 | 12.86 | 8.26 | 7.47 | 9.05 |
| 0.40 | 10.44 | 11.53 | 12.62 | 8.14 | 7.36 | 8.91 |
| 0.45 | 10.27 | 11.33 | 12.40 | 8.03 | 7.27 | 8.78 |
| 0.50 | 10.11 | 11.15 | 12.19 | 7.92 | 7.18 | 8.67 |
| 0.60 | 9.83 | 10.82 | 11.81 | 7.74 | 7.03 | 8.46 |
| 0.70 | 9.58 | 10.53 | 11.48 | 7.59 | 6.90 | 8.27 |
| 0.80 | 9.37 | 10.28 | 11.19 | 7.45 | 6.79 | 8.11 |
| 0.90 | 9.17 | 10.04 | 10.92 | 7.32 | 6.68 | 7.96 |
| 1.00 | 8.98 | 9.83 | 10.67 | 7.20 | 6.58 | 7.82 |
| 1.25 | 8.55 | 9.32 | 10.10 | 6.89 | 6.32 | 7.47 |
| 1.50 | 8.12 | 8.84 | 9.56 | 6.58 | 6.05 | 7.12 |
| 1.75 | 7.70 | 8.37 | 9.03 | 6.26 | 5.76 | 6.76 |
| 2.00 | 7.29 | 7.91 | 8.53 | 5.94 | 5.47 | 6.40 |
| 2.50 | 6.51 | 7.05 | 7.59 | 5.31 | 4.91 | 5.72 |
| 3.00 | 5.81 | 6.28 | 6.76 | 4.75 | 4.39 | 5.11 |
| 3.50 | 5.20 | 5.62 | 6.04 | 4.26 | 3.94 | 4.58 |
| 4.00 | 4.68 | 5.06 | 5.43 | 3.84 | 3.55 | 4.12 |
| 5.00 | 3.84 | 4.15 | 4.45 | 3.15 | 2.92 | 3.38 |
| 6.00 | 3.21 | 3.47 | 3.72 | 2.64 | 2.45 | 2.83 |
| 7.00 | 2.74 | 2.95 | 3.16 | 2.24 | 2.08 | 2.41 |
| 8.00 | 2.36 | 2.54 | 2.73 | 1.94 | 1.80 | 2.08 |
| 9.00 | 2.06 | 2.22 | 2.38 | 1.69 | 1.57 | 1.82 |
| 10.00 | 1.82 | 1.96 | 2.10 | 1.50 | 1.39 | 1.60 |
| 11.60 | 1.52 | 1.64 | 1.76 | 1.25 | 1.16 | 1.34 |
Download table as: ASCIITypeset image
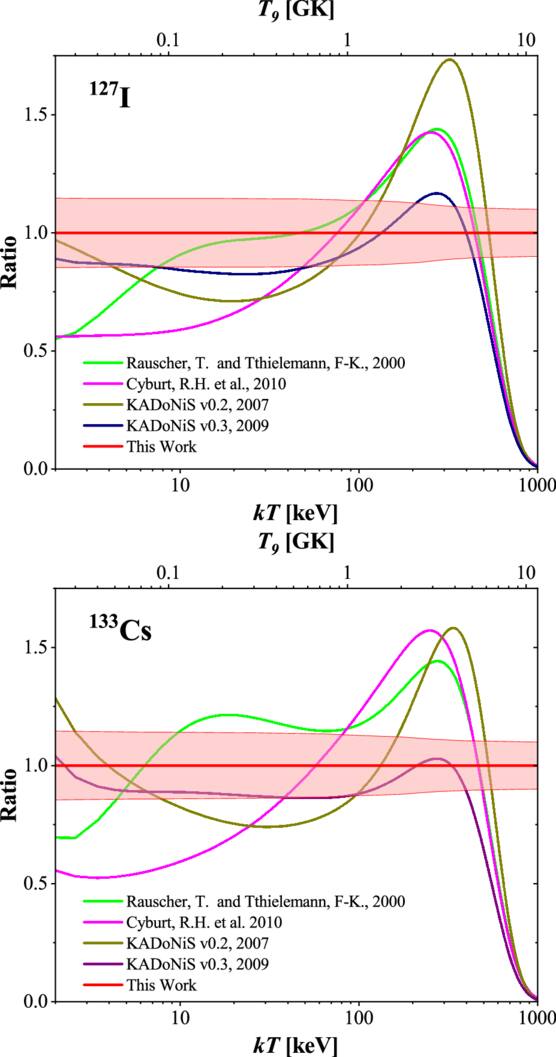
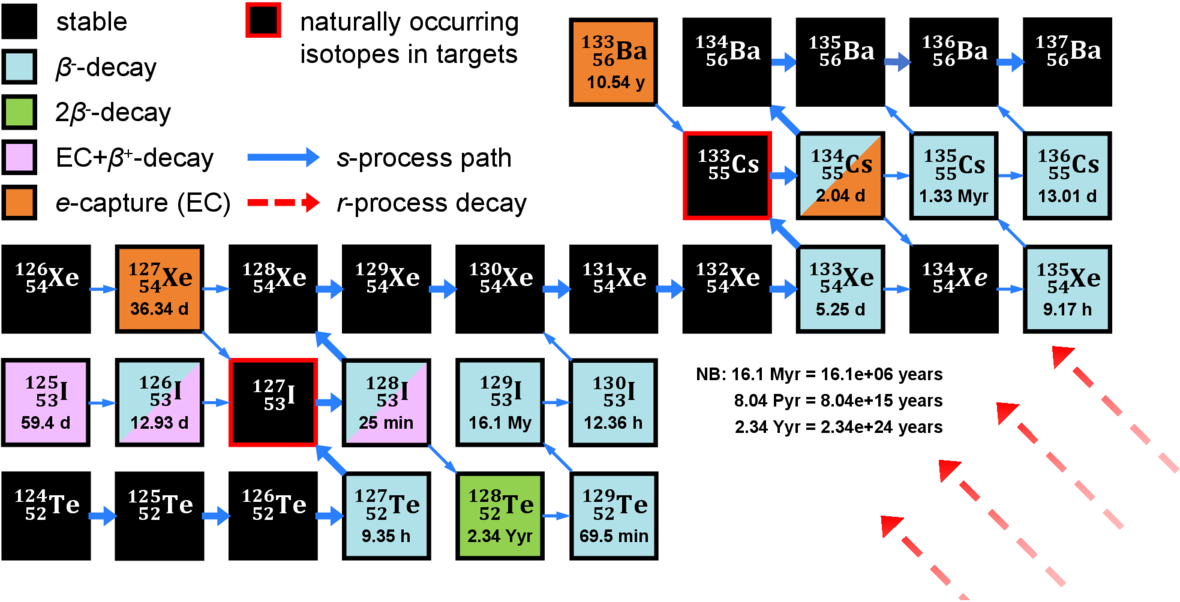
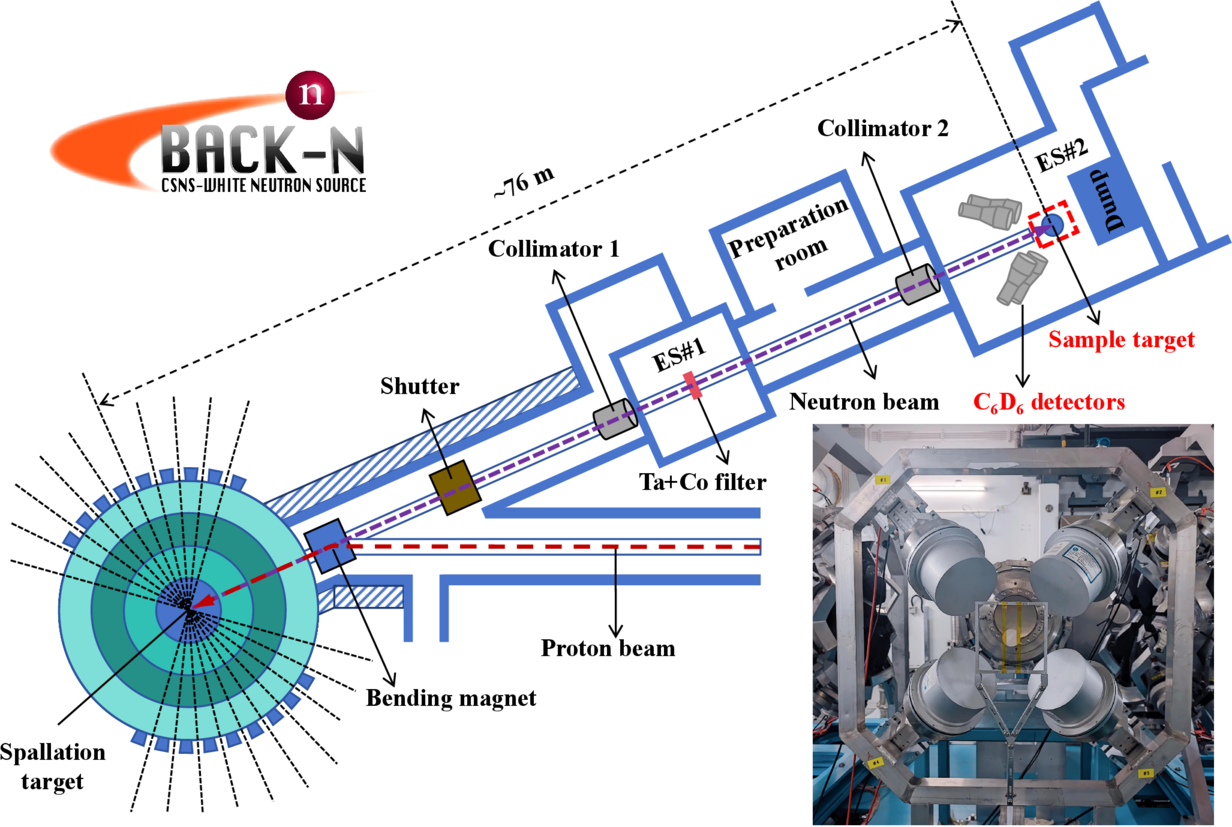
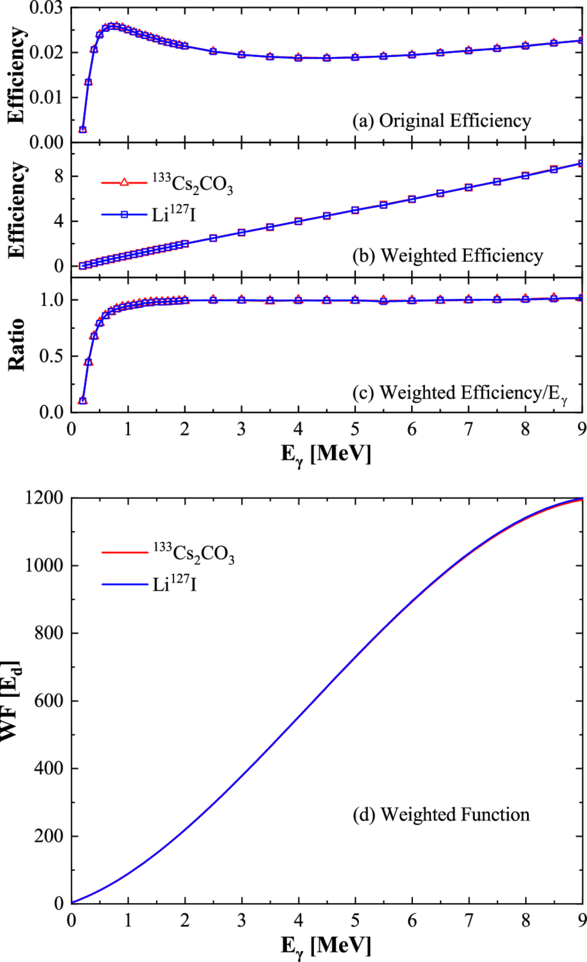
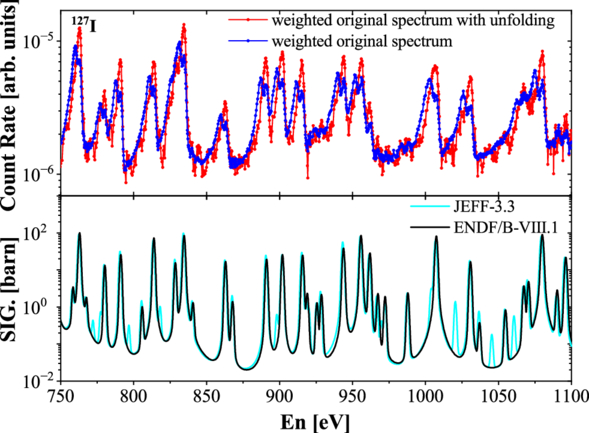
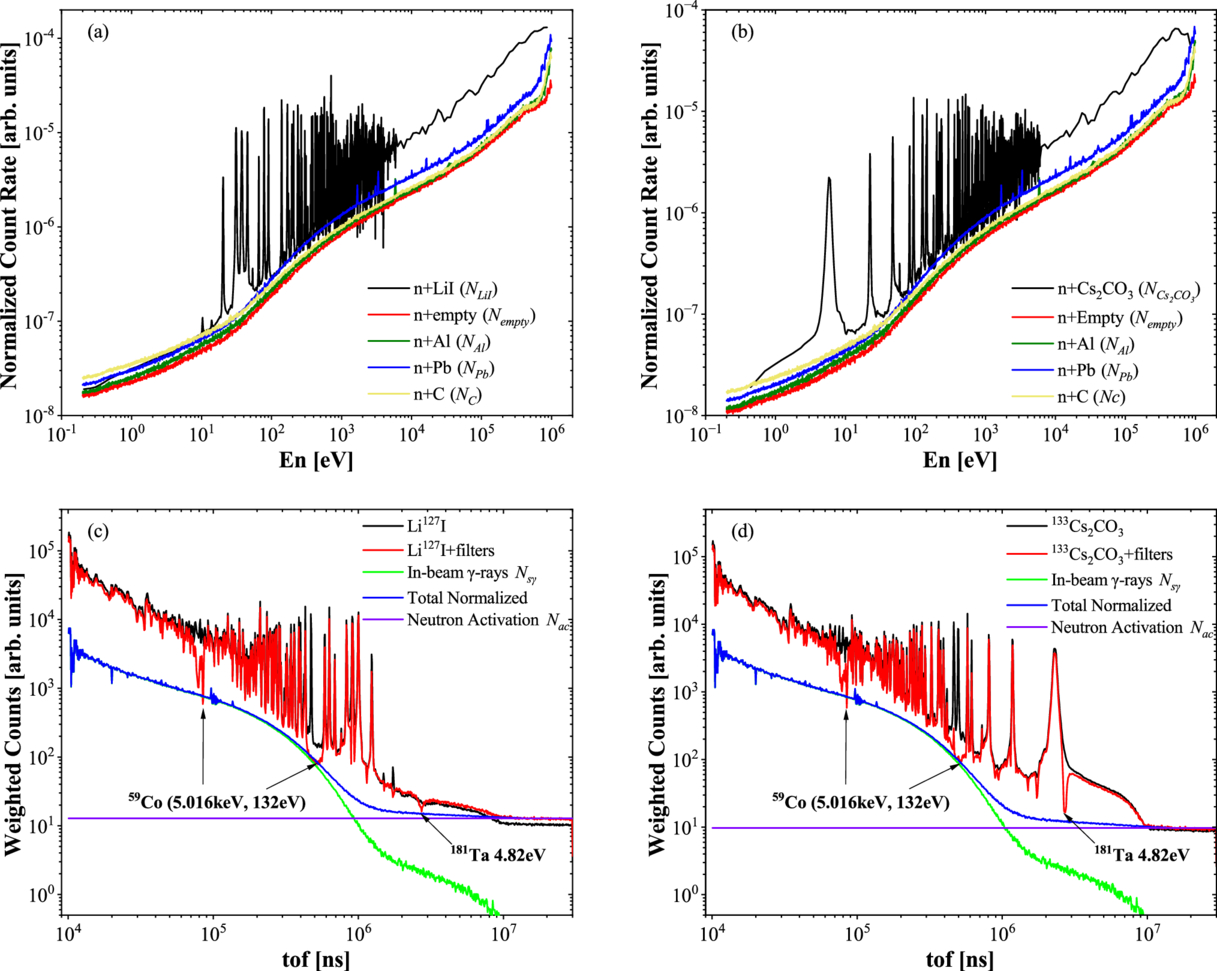
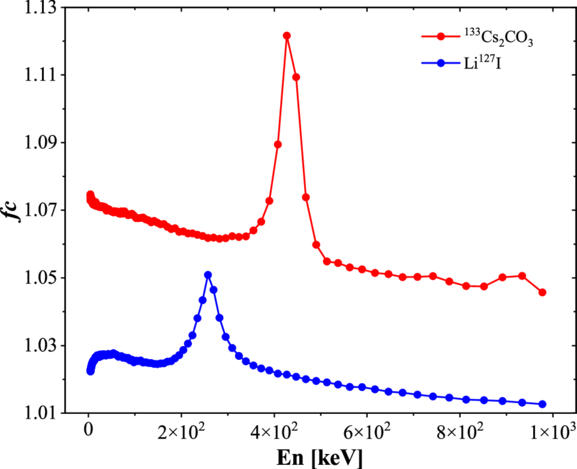
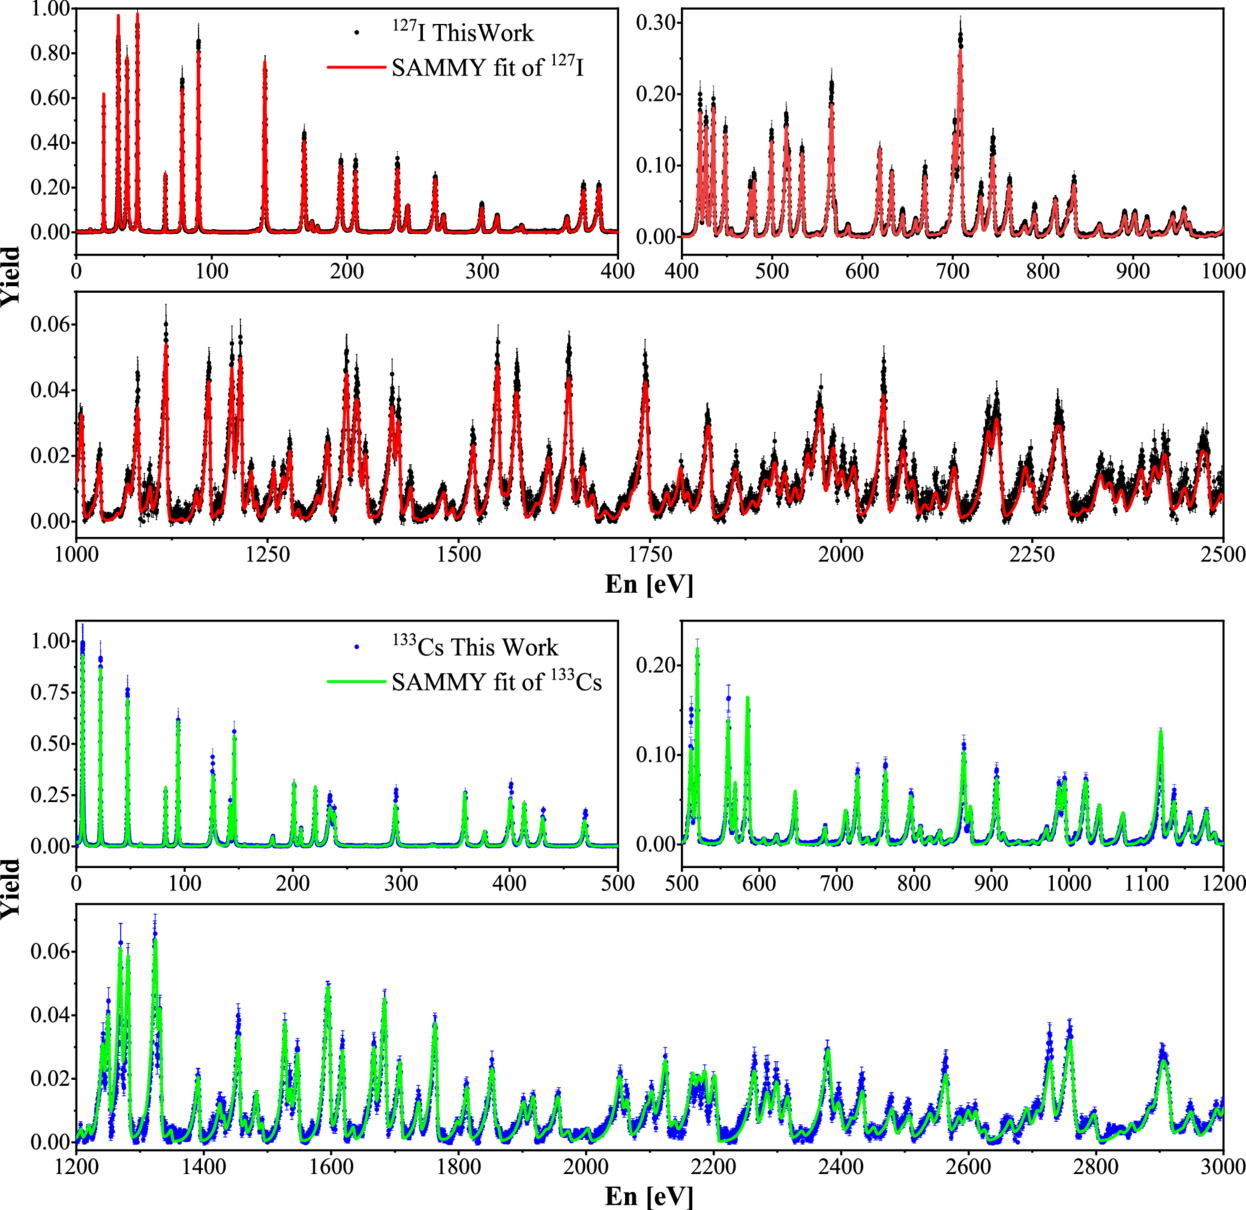
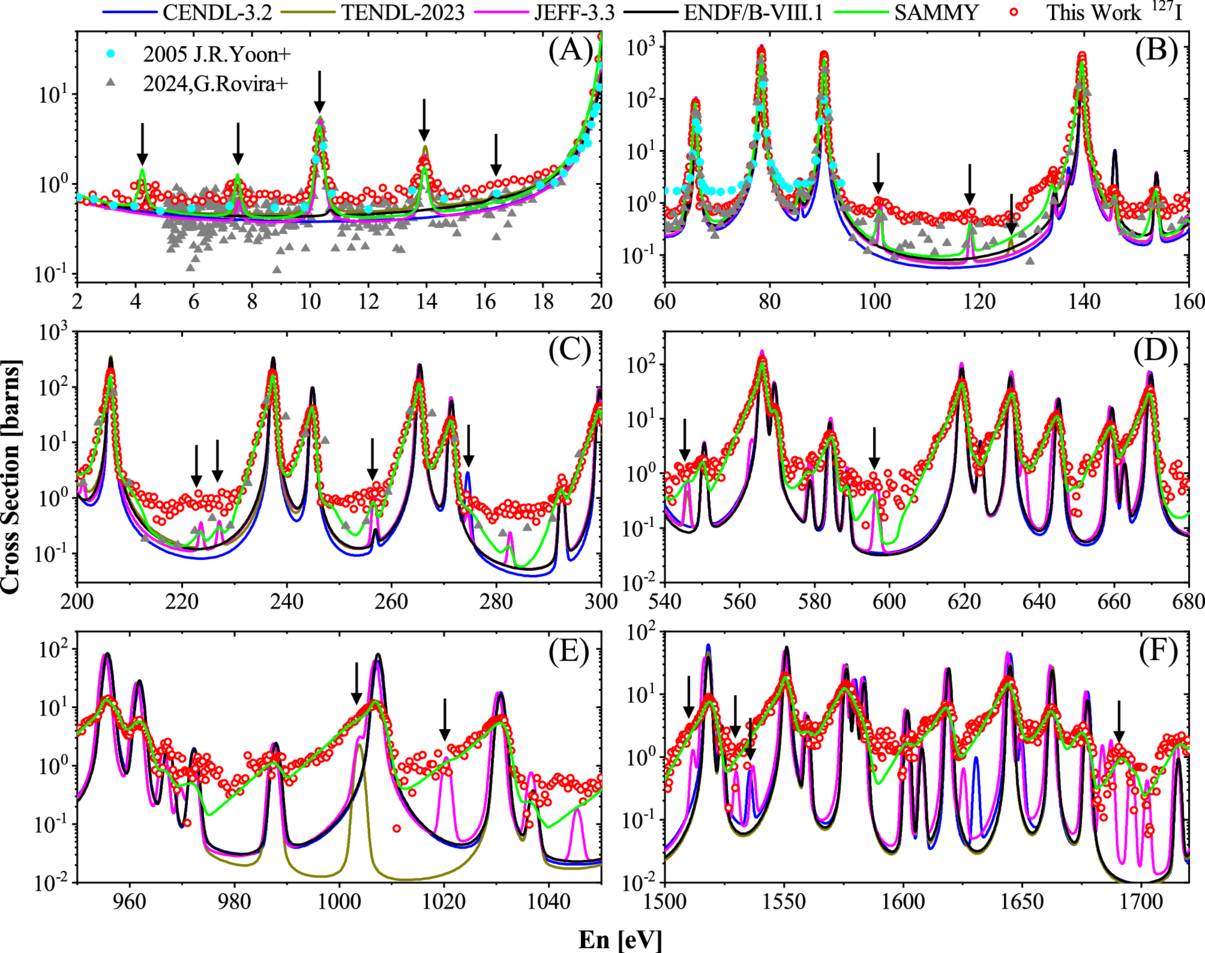
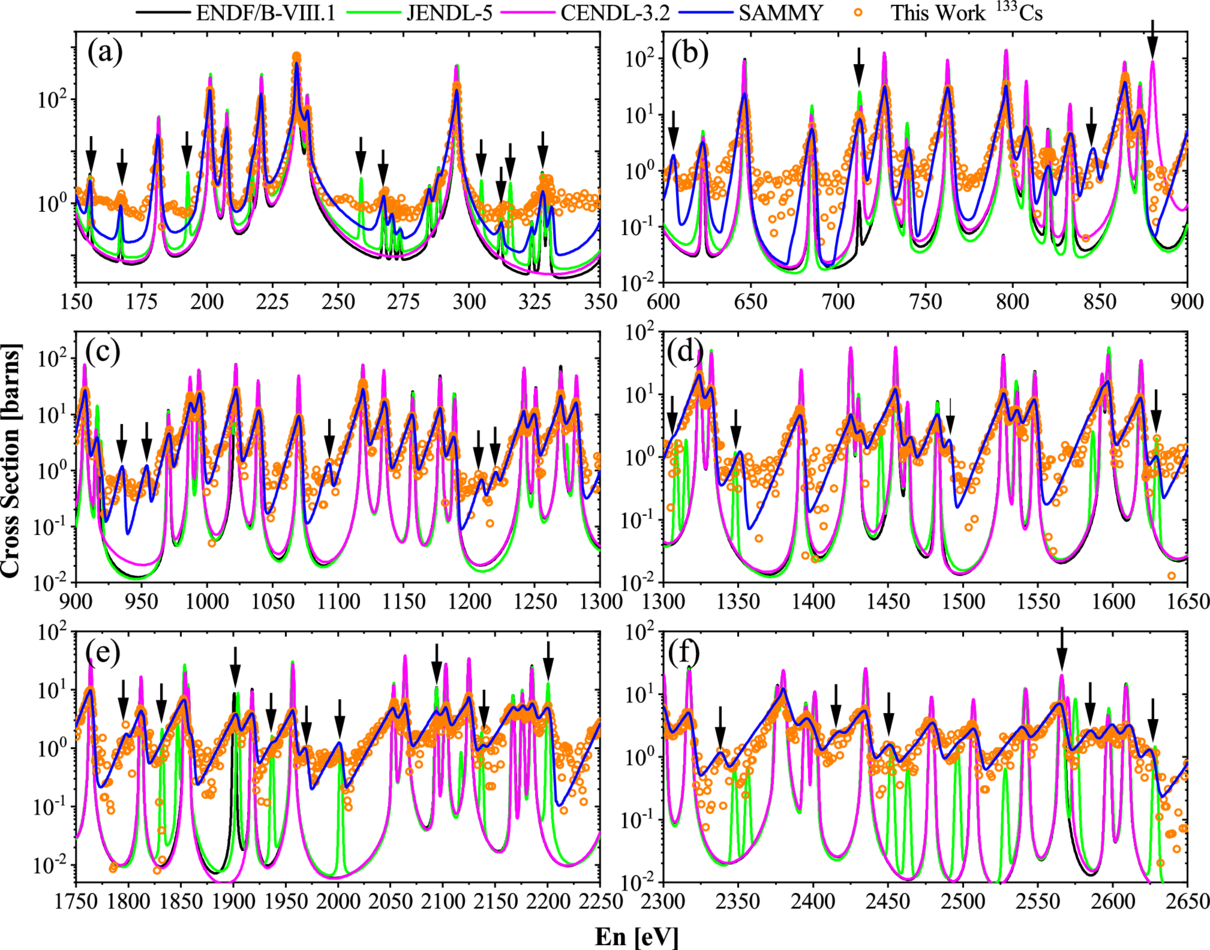
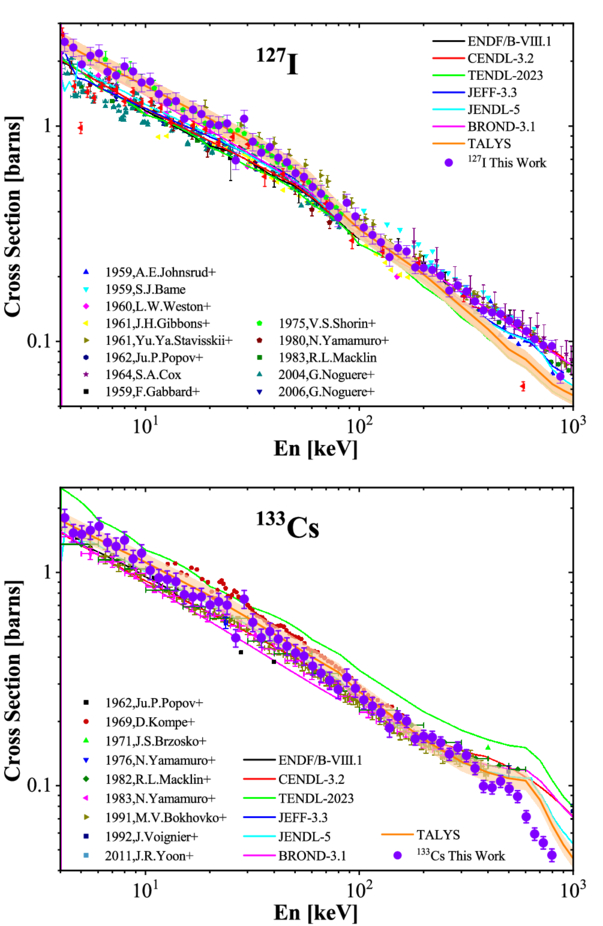
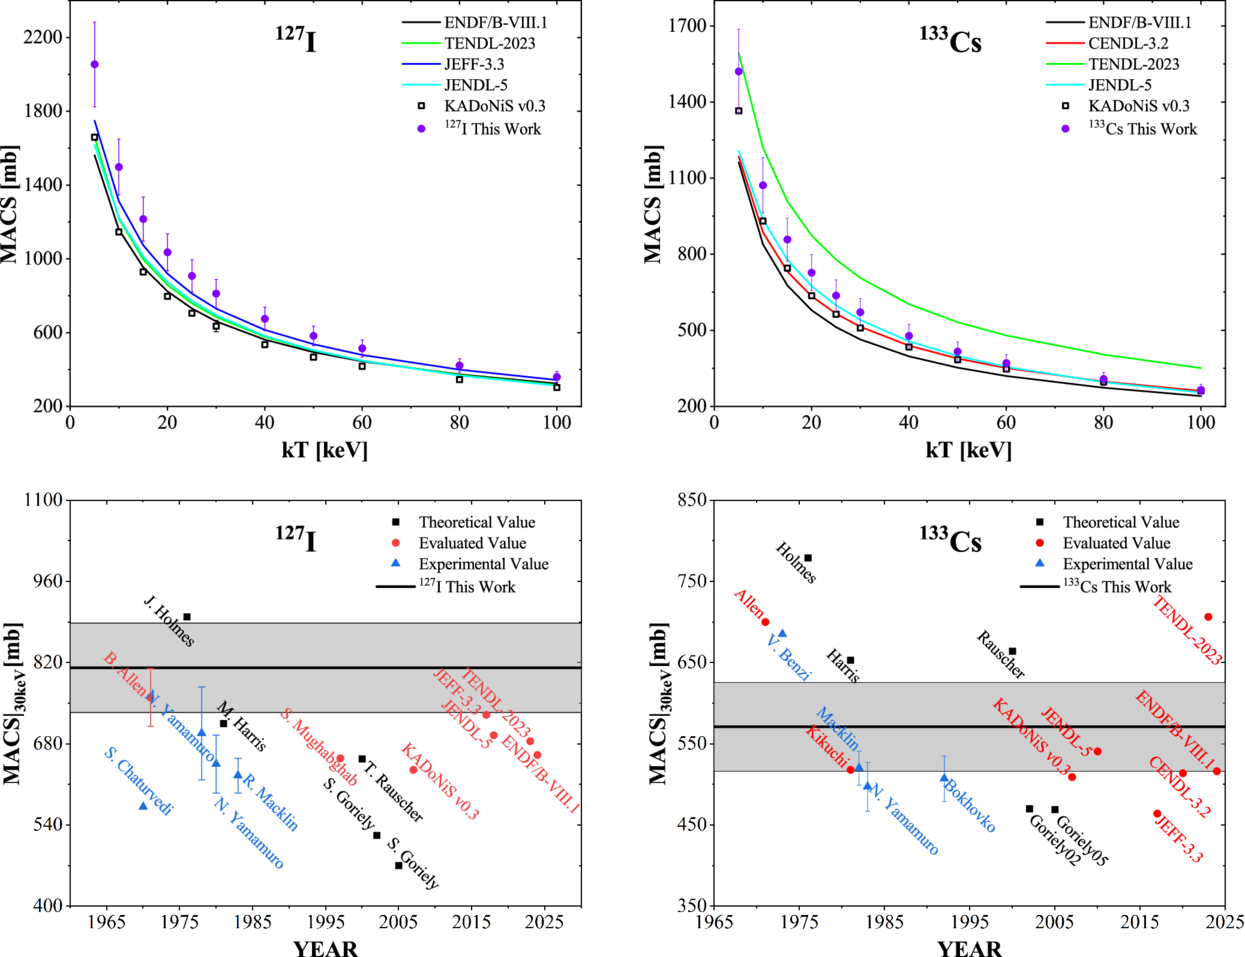
Figure 12. Comparison of the reaction rates reported in previous studies with this work.
Download figure:
Standard image High-resolution image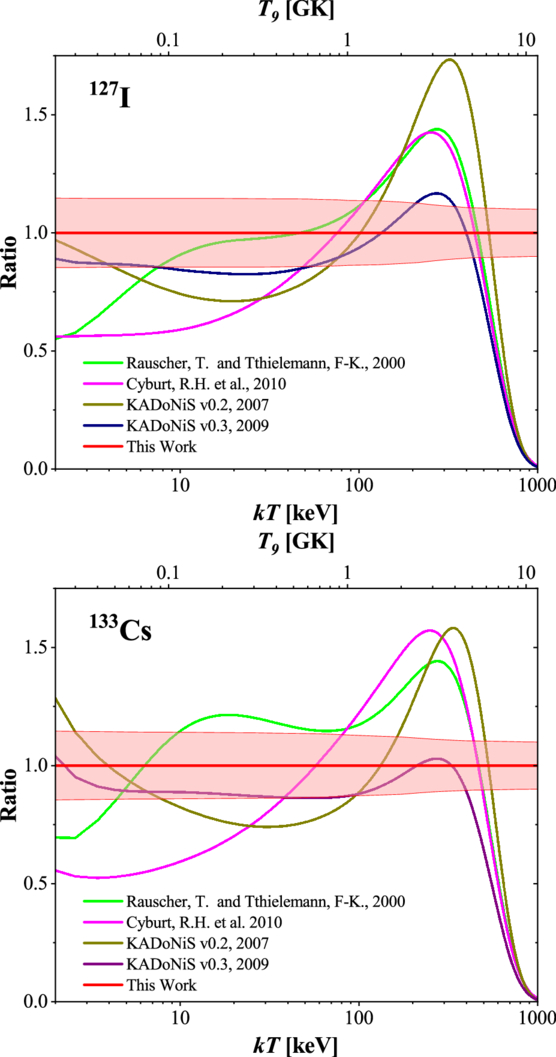
For 127I, in the region of kT < 50 keV, the reaction rate from this work is generally higher than those from most other works. As the energy increases to 50 keV < kT < 500 keV, the present reaction rate gradually becomes lower than the results from most other works. Above 600 keV, the reaction rates from other works drop below the present result.
For 133Cs, the data of KADoNiS v0.3 are generally lower than those of the present work. The reaction rate predicted by both T. Rauscher & F.-K. Thielemann (2000) and R. H. Cyburt et al. (2010) exhibit a consistent trend with our experimentally derived value, rising initially with increasing kT before subsequently decreasing.
A common form of reaction rate is an analytical formula with an appropriate parameterization for applications in the s-process of stellar models. We use the standard form of JINA Reaclib Database to fit neutron capture reaction rates as a function of T9 within the range of 0.02–10 GK and obtain aI,Cs = [a0, a1, a2, a3, a4, a5, a6] (R. H. Cyburt et al. 2010; J. H. Hu et al. 2026):

with relation between T9 and kT being

where kB is Boltzmann’s constant. The fitting results show that aI = [15.369, 0.007, −1.752, 5.318, −0.749, 0.055, −1.919] with  , aCs = [15.063, −0.003, −1.021, 4.818, −0.780, 0.059, −1.461] with
 .
MACSs and their corresponding reaction rates are essential input quantities for stellar nucleosynthesis models (S. Amaducci et al. 2024; A. Casanovas-Hoste et al. 2024). In recent years, a series of systematic studies has demonstrated that the uncertainties in s-process nucleosynthesis predictions primarily originate from errors in neutron capture reaction rates. N. Nishimura et al. (2017), in their study of the s-process in massive stars, identified the 127I(n,γ) 128I and 133Cs(n,γ) 134Cs reactions as level-1 key reactions, whose uncertainties directly dominate the reliability of iodine and cesium abundance predictions. Concurrently, in the work of G. Cescutti et al. (2018), the investigation of the main s-process in low-mass AGB stars also recognized these two reactions as level-1 key reactions. This indicates that the 127I(n,γ) 128I and 133Cs(n,γ) 134Cs reactions are critical nuclear physics inputs influencing the uncertainty of s-process nucleosynthesis yields, both in massive and low-mass stars. Therefore, precise measurements of these two reactions provide crucial experimental data for astrophysical models, effectively constraining and reducing theoretical uncertainties.
6. Conclusion
In this work, the (n,γ) cross sections of 127I and 133Cs were measured from 1 eV to 1 MeV using the Back-n white neutron beam line at CSNS, with C6D6 liquid scintillation detectors and the TOF technique. The data preprocessing and analysis method is highlighted, including the PHWT, the double-bunch unfolding method, background deduction, etc.
In the RRR, accurate resonance parameters are derived by the R-matrix code SAMMY within 1 eV–4 keV, helping to resolve some discrepancies among evaluated libraries. Our new results for 127I demonstrate stronger agreement with JEFF-3.3 and resolve some discrepancies among major evaluated libraries. The results for 133Cs confirm the presence of resonances predicted by JENDL-5, which are absent in other major evaluated libraries. Besides, this work also identified several new resonance structures in 133Cs after examining the raw spectrum and the spectrum with the double-bunch unfolding method, which were not reported in previous work: 605.73, 846.08, 935.40, 954.16, 1093.22, 1209.04, 1220.31, 1491.08, 1797.39, 1968.67, and 2412.02 eV.
In the URR, the average cross sections of 127I(n,γ) 128I and 133Cs(n,γ) 134Cs show general consistency with previous experimental and evaluated data, though discernible differences exist in certain energy ranges. And the MACSs within the thermal temperature kT range of the s-process nucleosynthesis model are calculated by numerical integrations. The astrophysical reaction rates NA〈σv〉 were subsequently derived from the experimental MACSs, providing essential inputs for s-process nucleosynthesis models. The present reaction rates deviate significantly from previous theoretical predictions, and the uncertainties are significantly reduced.
The newly obtained cross sections and reaction rates demonstrated substantial inconsistencies with major nuclear data libraries and theoretical work, offering an essential contribution to the improvement of knowledge regarding the reaction mechanism of 127I(n,γ) 128I and 133Cs(n,γ) 134Cs. These results provide critical benchmarks for the s-process nucleosynthesis of nuclear astrophysics, the I-Xe chronometer on early meteorite evolution, and optimizing CsI crystal detectors in dark matter and neutrino experiments.
Acknowledgments
We thank the staff members of the Back-n white neutron facility (https://cstr.cn/31113.02.CSNS.Back-n) at the CSNS (https://cstr.cn/31113.02.CSNS), for providing technical support and assistance in data collection and analysis. This work was supported by the National Natural Science Foundation of China (grant Nos. 12475152, 12147101, U1832182, and U2032137), and the Natural Science Foundation of Guangdong Province, China (grant No. 2022A1515011184). Supplementary data to this article can be found online via doi:10.57760/sciencedb.30091.