


Abstract
We present two large catalogs of active galactic nucleus (AGN) candidates identified across 30,093 deg2 of extragalactic sky from the Wide-field Infrared Survey Explorer's AllWISE Data Release. Both catalogs are selected purely using the Wide-field Infrared Survey Explorer (WISE) W1 and W2 bands. The R90 catalog consists of 4,543,530 AGN candidates with 90% reliability, while the C75 catalog consists of 20,907,127 AGN candidates with 75% completeness. These reliability and completeness figures were determined from a detailed analysis of UV- to near-IR spectral energy distributions of  sources in the 9 deg2 Boötes field. The AGN selection criteria are based on those of Assef et al. (2013) recalibrated to the AllWISE data release. We provide a detailed discussion of potential artifacts and excise portions of the sky close to the Galactic Center, Galactic Plane, nearby galaxies, and other expected contaminating sources. These catalogs are expected to enable a broad range of science, and we present a few illustrative cases. From the R90 sample, we identify 45 highly variable AGNs lacking radio counterparts in the FIRST survey. One of these sources, WISEA J142846.71+172353.1, is a changing-look quasar at z = 0.104, which has changed from having broad Hα to being a narrow-lined AGN. We characterize our catalogs by comparing them to large, wide-area AGN catalogs in the literature. We identify four ROSAT X-ray sources that are each matched to three WISE-selected AGNs in the R90 sample within 30''. Spectroscopy reveals that one of these systems, 2RXS J150158.6+691029, consists of a triplet of quasars at z = 1.133 ± 0.004, suggestive of a rich group or forming galaxy cluster.
Export citation and abstract BibTeX RIS
1. Introduction
Most UV through near-IR emission constituting the spectral energy distribution (SED) of an active galactic nucleus (AGN) is produced by the innermost regions of the accretion disk, which spans distances down to the last stable orbital radius of the black hole (e.g., Shakura & Sunyaev 1973). At larger distances from the accretion disk, a dusty medium, usually referred to as the "dust torus" (see, e.g., Antonucci 1993; Urry & Padovani 1995; Netzer 2015), absorbs the light of the accretion disk and re-emits it in the infrared, dominating the SED at wavelengths longer than ∼1 μm. Initially assumed to be a smooth dust structure with a toroidal geometry (hence its name), observations suggest that the dust is more likely found in geometrically and optically thick clouds, toroidally distributed around the central engine (e.g., Krolik & Begelman 1988; Nenkova et al. 2002, 2008; Elitzur & Shlosman 2006; Tristram et al. 2007), although a number of uncertainties remain about the exact properties and distribution of the dust (e.g., Feltre et al. 2012; Netzer 2015). The dust is heated by the accretion disk emission, with the inner boundary of the torus being set by the sublimation temperature of the dust. Given the high temperatures of the torus, its emission is most prominent in the shorter mid-IR wavelengths (≲50 μm). At longer wavelengths, the observed emission can become dominated by the cold dust of the host galaxy, typically associated with star formation. Because of the torus and accretion disk emission, the mid-IR is ideal for AGN identification, as its SED is very different from that of stars and inactive galaxies. At low redshifts, the SED in the observed mid-IR bands is dominated by emission from the dust torus, while at higher redshifts, the mid-IR bands map the optical/near-IR accretion disk emission.
Along with mid-IR selection, the other most successful methods of AGN identification are arguably those based on X-ray observations and those based on UV and optical broadband photometry and spectra. Each of these wavelengths has different advantages and disadvantages, and obtains samples with different biases. For example, optical AGN identification is severely affected by dust obscuration (either from the torus or the host galaxy), making samples heavily biased against type 2 (or obscured) AGNs, while both mid-IR and X-ray identification are much more robust against obscuration, particularly at higher energy, or hard X-ray identification. Furthermore, mid-IR and optical identification can be diluted significantly by emission from the host galaxy, as host light can be very significant at these wavelengths, rivaling the AGN emission in many cases. As host emission light is related to the black hole mass (e.g., Marconi & Hunt 2003), this translates into samples that are biased against AGNs accreting at small fractions of their Eddington limit (e.g., Hickox et al. 2009; Assef et al. 2011; Mendez et al. 2013). On the other hand, optical/UV broadband photometry can be efficiently obtained by ground-based telescopes, making the observations much easier than in the X-rays and the mid-IR. Although mid-IR observations can be obtained from the ground for the brightest targets in the sky, broadband photometry to identify large AGN samples can only be efficiently obtained by space-based observatories due to the Earth's atmosphere. X-ray observations can only be obtained by space-based facilities, but they require significantly longer exposure times than space-based mid-IR observations. For example, Gorjian et al. (2008) finds that 97.5% of X-ray sources identified in the 5 ks XBoötes survey Chandra observations (Murray et al. 2005) have counterparts in the 90 s observations of the Spitzer IRAC Shallow Survey (Eisenhardt et al. 2004), with an additional ∼1% of the X-ray sources expected to be spurious. Despite some of its shortcomings, mid-IR AGN identification is very important for a thorough census of AGN activity, being significantly less biased than UV/optical identification while requiring a significantly shorter observing time than X-ray identification.
For all of these reasons, the Wide-field Infrared Survey Explorer (WISE; Wright et al. 2010) is an ideal mission to identify a very large number of AGNs across the full sky. With its 40 cm aperture, the WISE mission imaged the entire sky in four mid-IR bands, centered at 3.4, 4.6, 12, and 22 μm, referred to as W1, W2, W3, and W4, respectively. The FWHM of the point-spread function (PSF) in the W1, W2, and W3 bands is 6'' while in the W4 band it is 12''. WISE is in a polar orbit, requiring approximately six months to scan the entire sky. The cryogenic survey was conducted between 2010 January and August, and completed slightly more than one pass over the entire sky. After the exhaustion of cryogen, NASA's Planetary Division funded an extension to focus on near-Earth objects (Mainzer et al. 2011), which continued observing in the W1 and W2 bands until a second pass over the entire sky was completed in 2011 February. All data obtained by WISE from 2010 and 2011 have been made public in the AllWISE Data Release,6 and we use this data set as the starting point to construct the mid-IR AGN catalogs presented here.
A substantial number of mid-IR AGN identification techniques have been developed in the literature. Although the initial techniques were developed for the IRAS satellite observations (e.g., de Grijp et al. 1985, 1987; Leech et al. 1989), which provided the first infrared survey of the sky, the majority have been developed for the more recent observatories, such as Spitzer and WISE (Lacy et al. 2004, 2007, 2013; Stern et al. 2005, 2012; Assef et al. 2010; Jarrett et al. 2011; Donley et al. 2012; Mateos et al. 2012; Messias et al. 2012; Wu et al. 2012; Assef et al. 2013). Stern et al. (2012) studied the WISE colors of AGNs in the 2 deg2 Cosmic Evolution Survey (COSMOS; Scoville et al. 2007) field, relying on its earlier deep Spitzer/IRAC observations for the AGN identification. Stern et al. (2012) were able to define WISE AGN selection criteria based solely on the W1 and W2 magnitudes, showing that down to a W2 magnitude of 15.05 (10σ detection at the ecliptic latitude of the COSMOS field), 78% of Spitzer-identified AGNs have W1 – W2 > 0.8, and that 95% of the objects with such red WISE colors are bona fide AGNs. Using this criterion, Stern et al. (2012) identified 61.9 ± 5.4 AGNs per deg2. Motivated by these results, Assef et al. (2013, hereafter A13) expanded such studies to the larger 9 deg2 NOAO Deep, Wide-Field Survey (NDWFS; Jannuzi & Dey 1999) Boötes field. Because its higher ecliptic latitude as compared to the COSMOS field has denser coverage from the WISE survey (see Section 3.3.1), the NDWFS Boötes field also allowed us to probe the AGN selection to significantly deeper WISE magnitudes. Using the extensive UV through mid-IR photometric and spectroscopic observations available for this field (see A13 for a detailed account of the data), we were able to reliably identify AGNs down to W2 = 17.11 (3σ detection), thereby extending and improving the WISE AGN selection and providing different selection criteria separately optimized for reliability and completeness. In particular, the criteria optimized for 90% reliability, referred to as R90, yield a surface density of 130 ± 4 AGNs candidates per deg2.
Relying on different selection criteria, AGN catalogs based on WISE observations have been published by several other authors (e.g., Edelson & Malkan 2012; DiPompeo et al. 2015; Secrest et al. 2015). In this work, we apply the selection method devised by A13 to generate the largest AGN catalog based on the AllWISE data release. In Section 2, we recalibrate the selection function of A13 to the AllWISE data using the same set of multiwavelength observations in the NDWFS Boötes field, as there are significant improvements in the photometry from the All-Sky to the AllWISE data releases. In Section 3, we discuss the generation of two WISE AGN catalogs, respectively based on reliability- and completeness-optimized selections. We also include a discussion of the spatial filters applied and discuss the general properties of these catalogs. In Section 4, we discuss the highest variability sources in the reliability-optimized catalog, and in Section 5, we compare our AGN catalogs with large AGN catalogs in the literature. We assume a flat ΛCDM cosmology with  ,
,  , and
, and  . All photometry are presented in the natural photometric system of their bands unless stated otherwise (i.e., AB for griz and Vega for the rest, i.e., Bw, R, I, J, H, Ks, K as well as the Spitzer and the WISE bands).
2. The AGN Selection Criteria
The selection criteria we use to produce the WISE AGN catalogs presented in Section 3 are based upon the selection criteria developed by A13 using AGNs in the NDWFS Boötes field. A13 presented four distinct AGN selection criteria based only on the W1 and W2 magnitudes of the sources, chosen based on the results of Stern et al. (2012), not requiring detections in the lower sensitivity W3 and W4 bands. Two of the criteria presented by A13 were aimed at producing catalogs with 90% and 75% reliability (referred to as the R90 and R75 criteria, respectively), while the other two were aimed at yielding 90% and 75% completeness (C90 and C75, respectively). Specifically, the two reliability-optimized AGN selection criteria of A13 are given by

with (αR90, βR90, γR90) = (0.662, 0.232, 13.97) and (αR75, βR75, γR75) = (0.530, 0.183, 13.76). The two completeness-optimized AGN selection criteria of A13 are in turn given by

with  and
and  . A13 observed that in order to obtain highly reliable samples at increasingly fainter W2 magnitudes, redder W1 – W2 colors were required due to a combination of evolution in the contamination by non-active galaxies and the larger uncertainties at fainter magnitudes. Conversely, the completeness fractions for a given W1 – W2 color cut appeared to be independent of magnitude. Hence, the functional forms of the R90 and R75 criteria have strong dependencies on the W2 magnitudes while the C90 and C75 criteria solely rely on W1 – W2 color boundaries. In fact, the C75 criterion is nearly identical to that proposed by Stern et al. (2012) for brighter magnitudes, namely, W1 – W2 > 0.80.
In the following sections, we will present two AGN catalogs, one optimized for reliability and one for completeness. These catalogs are respectively based on modified versions of the R90 and C75 criteria of A13. Modifications are needed over the criteria presented by A13 because they used the earlier WISE All-Sky data release7 for their study, while in this study we use the newer AllWISE data release. The All-Sky data release is limited to the data obtained during the cryogenic mission, while the AllWISE release incorporates data obtained during the post-cryogenic main mission extension, known as NEOWISE. Furthermore, Lake et al. (2013) show that WISE All-Sky profile-fitting fluxes of faint sources are underestimated by 7 ± 2 μJy and 11 ± 2 μJy in W1 and W2, respectively, due to excessive sky subtraction, an issue that has been corrected in the AllWISE data release.
To recalibrate the WISE AGN selection criteria developed by A13, we use the same auxiliary photometric data sets available in the NDWFS Boötes field and follow the same analysis steps. We refer the reader to A13 and Assef et al. (2010) for a detailed account of the auxiliary photometric and spectroscopic data sets used and of the methods used to derive the SED classifications and photometric redshifts when no spectroscopic ones were available. In summary, the photometric broadband data span the UV to the mid-IR with very good sampling. In addition to the original deep Bw, R, I, and K broadband imaging from the NDWFS survey, we also use data from the NUV and FUV bands of GALEX (Martin et al. 2005); z-band from the zBoötes survey (Cool 2007); J, H and Ks bands of NEWFIRM (Gonzalez et al. 2010); the Spitzer/IRAC [3.6], [4.5], [5.8], and [8.0] bands from SDWFS (Ashby et al. 2009); and Spitzer/MIPS 24 μm data from MAGES (Jannuzi et al. 2010). Specifically, we use 6'' diameter aperture magnitudes, corrected for PSF losses and obtained from PSF-matched images in all but the GALEX and Spitzer bands. With the exception of the GALEX and MIPS data, source photometry is extracted from all images at the positions of [4.5] sources. Photometry from those two catalogs were obtained from positional matching. The spectroscopic redshifts come mainly from the AGN and Galaxy Evolution Survey (AGES; Kochanek et al. 2012), which obtained deep optical spectra of 23,745 sources in the field and are supplemented with deeper spectroscopy of ∼2000 sources obtained with various facilities, although primarily from Keck (e.g., Eisenhardt et al. 2008).
We start with the sources listed in the AllWISE catalog of objects in the NDWFS Boötes field, obtained through the NASA/IPAC Infrared Science Archive (IRSA8 ). The AllWISE Source Catalog consists of sources detected with signal-to-noise ratio (S/N) > 5 in at least one band and not flagged as spurious detections, among other criteria, and provides all magnitudes with a significance of at least 2σ. We direct the reader to the AllWISE documentation9 for details. In addition, for this experiment we further require all of our sources to be (i) detected at the 3σ level in W1 and at the 5σ level in W2; (ii) point sources (ext_flg=0); (iii) not contaminated by image artifacts in any band (cc_flags=0000); and (iv) not blended with other sources (nb = 1). For the WISE AGN catalog presented in the following sections, we relax requirements (i), (iii), and (iv), but we enforce them here when defining the selection criteria.
We cross-match the positions of the WISE sources with sources in the auxiliary photometric catalogs described above using a 2'' matching radius. Although somewhat conservative when considering the width of the WISE PSF, we adopt this matching radius as A13 found it to work well for matching WISE data to the data sets described earlier. Approximately 4% of WISE sources do not have matches in the Spitzer [4.5] catalog, usually because of source blending in the lower resolution WISE images (Stern et al. 2012). Using the full, broadband multiwavelength data, we determine which sources are AGNs based on their SEDs. As discussed in A13, we use the SED fitting algorithm and templates of Assef et al. (2010) to obtain photometric redshifts for sources lacking spectroscopic redshifts and to model the SEDs of all sources in the field. Specifically, each source is modeled as a non-negative linear combination of three galaxy SED templates, resembling, respectively, E, Sbc, and Im galaxies, and an AGN SED template while also fitting for its redshift. We also fit for the reddening of the AGN SED template with a weak prior that punishes large obscurations, and we include IGM absorption for all four templates using the prescription outlined in Assef et al. (2010). These templates span the wavelength range of 0.03–30 μm and were iteratively derived by Assef et al. (2010) from the UV (rest-frame 0.03 Å) through mid-IR photometry of 14,448 galaxies and 5,347 likely AGNs with spectroscopic redshifts from the AGES survey in this field. To derive the photometric redshifts, we also apply a luminosity prior based on the Las Campanas Redshift Survey (Lin et al. 1996) luminosity function that only affects the galaxy templates. We conservatively consider as AGNs all sources with  , where
  is defined as the fraction of the 0.1–30 μm luminosity coming from the AGN component, after correcting the latter for obscuration, namely,

We refer the reader to Assef et al. (2010), Chung et al. (2014), and A13 for details on the SED modeling and the analysis. Note that the  parameter is relatively robust to uncertainties in the redshift, which is particularly important given the large uncertainties of the AGN photometric redshifts (Assef et al. 2010).
Our primary aim here is to recalibrate the mid-IR AGN selection of A13 based on the W1 – W2 color and W2 magnitude. In general, AGNs are easily identified in the W1 and W2 bands because they are significantly redder than galaxies at the depth of the WISE survey in the NDWFS Boötes field, so the main criterion to select AGNs can be written as  . Indeed, Stern et al. (2012) showed in the COSMOS field that for W2 < 15.05,
  yields an AGN sample that is 95% reliable and 75% complete, while A13 showed that the contamination rate for a given
  is a strong function of W2 at fainter magnitudes. With this in mind, Figure 1 shows the reliability (left panel) and completeness (right panel) of AGN samples selected for a given
  as a function of W2 magnitude. The general behavior is consistent with that described by A13, implying that to maintain the sample reliability, it is necessary to adopt a functional form of
  that depends on W2, while a fixed value of
  is appropriate for maintaining a given AGN sample completeness. Hence, it is necessary to develop different selection criteria depending on whether the primary goal is to optimize the reliability or the completeness of the WISE-selected AGN sample.

Figure 1. Reliability (left panel) and completeness (right panel) of AGN candidates defined by  selected by the color cut
  as a function of W2 magnitude. Reliability and completeness of 90% (75%) are shown as a function of magnitude by the solid (dashed) black lines. Objects redder than the top-right corner of the panels are missing due to the W1
  requirement. The proposed reliability-optimized criteria (Equation (4)) for 90% (R90) and 75% (R75) reliability are shown in the left panel by the white solid and dashed lines, respectively. For comparison, the dotted gray line shows the R90 criterion of A13. The completeness-optimized criteria (Equation (5)) for 90% (C90) and 75% (C75) completeness are shown in the right panel with the same respective line styles as in the left panel.
Download figure:
Standard image High-resolution imageWe model the AGN selection criteria using the same functional forms of A13, with one minor modification. For the reliability-optimized criteria, we consider the following form:

where the value of the  ,
,  , and
, and  depend on the reliability fraction targeted. This form of the selection criteria is equivalent to that used by A13 for W2 magnitudes fainter than
  , while it stops evolving with W2 for brighter magnitudes. A13 neglected to specify the constant term for bright magnitudes, simply presenting the term for fainter magnitudes. The number of point sources at magnitudes bright enough where this is an issue is very small and certainly has no effect on the results presented by A13. However, since the goal of this work is to present an AGN sample across most of the sky, we correct this detail. Using the results of Figure 1, we find that a reliability of 90% is achieved by (αR90, βR90, γR90) = (0.650, 0.153, 13.86), while a reliability of 75% is achieved by
  ,
,  . Both criteria are shown in the left panel of Figure 1. For comparison, the figure also shows the R90 criterion of A13 obtained using the WISE All-Sky Data Release instead of the AllWISE Data Release. The much steeper dependence on W2 magnitude of the A13 criteria is expected due to the previously mentioned flux bias present in the All-Sky Data Release (Lake et al. 2013). We find that the R90 and R75 criteria have a completeness of 17% and 28%, respectively.
For the completeness-optimized criteria, we use the functional form of Stern et al. (2012) and A13, namely,

and we find that 75% completeness is achieved for  while 90% completeness is achieved for
  . Both criteria are shown in the right panel of Figure 1. Although
  has the same value as found by A13,
  is 0.06 mag bluer than that found by A13. This is also a likely consequence of the flux bias in the All-Sky Data Release, as the value of
  seems systematically bluer for W2 ≳ 15 mag. We find that the C90 and C75 criteria have a reliability of 34% and 51%, respectively. In the next section, we present WISE-selected AGN catalogs across ∼75% of the sky based on the R90 and C75 criteria derived here.
Figure 2 shows the magnitude distribution in the I, J, H, and Ks bands of the R90- and C75-selected AGNs in the Boötes field. As expected, the R90 sample is brighter on average than the C75 sample in all four bands. Interestingly, the I-band distribution is bimodal, reflecting the fact that our criteria select unobscured as well as obscured AGNs. The near-IR bands, on the other hand, do not show this behavior, consistent with the fact that redder bands are less affected by obscuration. Figure 3 shows the redshift distribution for the R90- and C75-selected AGNs in the NDWFS Boötes field, primarily obtained by AGES (Kochanek et al. 2012). The bimodality of the distribution is likely caused by the fact that at lower redshifts, mid-IR selection is more sensitive to obscured AGNs than at higher redshifts. The prominent photometric redshift peak at 1 ≲ z ≲ 2 observed for the C75 sample is likely due to the contribution of contaminating elliptical galaxies as well as of real AGNs too faint for spectroscopic redshifts. As expected, the number of sources in both catalogs declines for z ≳ 2, and very few are found at z ≳ 3. This is likely caused in part by the characteristics of the spectroscopic follow-up as well as by the WISE colors becoming progressively bluer with redshift in the range 2 ≲ z ≲ 5 (see, e.g., Figure 1 of A13). We refer the reader to A13 (and references therein) for a discussion of the spectroscopic sample and the photometric redshift reliability.

Figure 2. Magnitude distribution of the R90- (blue) and C75- (red) selected AGNs in the NDWFS Boötes field in the I (top-left panel), J (bottom-left panel), H (top-right panel), and Ks (bottom-right panel) bands. The vertical dashed lines show the approximate magnitude at which the S/N in the given band is equal to 3.
Download figure:
Standard image High-resolution image
Figure 3. Redshift distribution of the sources selected by the R90 (top) and C75 (bottom) criteria in the NDWFS Boötes field. The black hashed histograms show the distribution of spectroscopic redshifts, and the gray histograms show the distribution of spectroscopic and photometric redshifts combined.
Download figure:
Standard image High-resolution image3. The WISE AGN Catalogs
Using the selection criteria presented in Section 2, we construct a map of WISE-selected AGNs across ∼75% of the sky. We construct two different catalogs, a reliability-optimized one based on the R90 selection criterion and a completeness-optimized one based on the C75 criterion. We only consider sources with W1 and W2 magnitudes fainter than the saturation limits of the survey (i.e., W1 > 8 and W2 > 7) and with  in W2, classified as point sources and not flagged as either artifacts or affected by artifacts (i.e., we require that the cc_flags parameter is 0 in both W1 and W2). We refer to these as the "raw catalogs," since these catalogs are affected by a number of contaminants not present in the NDWFS Boötes field due to its size and high Galactic latitude. Next, we discuss several spatial filters applied to the raw catalogs designed to limit the number of such contaminants in the final catalogs.
3.1. Spatial Filters
3.1.1. The Galactic Plane and the Galactic Center
The NDWFS Boötes field is an extragalactic field, centered approximately 67° away from the Galactic Plane (GP) and 77° away from the Galactic Center (GC). This limits the number of stellar contaminants that could affect our sample in the Boötes field, such as young stellar objects (YSOs), asymptotic giant branch (AGB) stars, and H ii regions as well as possible artifacts arising from the high concentration of sources in regions near the GP and the GC.
To avoid these issues, the first spatial filter we apply removes all sources closer than 30° from the GC, and all sources closer than 10° from the GP. We chose these cuts following the approach of Eisenhardt et al. (2012), who used them to select hot dust-obscured galaxies in the WISE data, although the general properties of the final catalog should be insensitive to small changes in these parameters. The area removed by these cuts is 8753 deg2.
Nikutta et al. (2014) finds that YSOs are primarily distributed within 6° of the GP, and hence the above cut should eliminate the majority of these sources. The remainder should be associated with star-forming regions at higher Galactic latitudes, which we discuss further in Section 3.1.3. Nikutta et al. (2014) also studied the colors of AGB stars in the WISE bands, and panel 4 of their Figure 8 shows that the majority of these sources have W1 – W2 ≲ 0.5, implying that only a small fraction would make it into our AGN catalogs. While Jackson et al. (2002) estimates that our Galaxy contains approximately 200,000 AGB stars in total, most of them should be close to the GP and GC. Specifically, their Figure 8 shows that the great majority of the sources in their sample are within 10° of the GP, implying that the above cut should eliminate the majority of these sources from our AGN catalogs.
Secrest et al. (2015) report effects of the GP up to 15° in Galactic latitude. To test this, we studied the surface density of sources with W2 < 15 as a function of distance to the GP in several slices of Galactic longitude. We apply this magnitude limit as AllWISE achieves this depth in all regions in the sky farther than 10° away from the GP. We find that the main issue caused by the GP is a noticeably lower surface density due to source confusion noise. This effect can be observed up to ∼40° away from the GP and is progressively more severe closer to the GP. At a distance of ∼15° from the GP, the source density is about 50% of that in the high Galactic latitude sky. This implies that the completeness of our catalog is lower for low Galactic latitudes, although reliability should not be severely affected.
3.1.2. Planetary Nebulae
Upon visual inspection of the raw catalogs, we find that extended planetary nebulae (PNe) can generate spurious sources in the AllWISE source catalog that meet our selection criteria. To avoid such sources, we cross-correlate our catalog with the Strasbourg-ESO Catalog of Galactic Planetary Nebulae (Acker et al. 1992), obtained from the VizieR Astronomical Server.10 We conservatively eliminate all sources within twice the radius of a known PN. If both a radio and an optical diameter are listed for a given nebula, we assume the larger of the two. The catalog contains 1142 PNe, although many are within the regions close to the GP and GC removed earlier. This filter removes an additional area of 2 deg2.
3.1.3. H ii and Star-forming Regions
Similarly to PNe, a large number of sources that meet our selection criteria are associated with H ii regions in our Galaxy. Some of them can be, for example, YSOs and AGB stars, which have similar colors to AGNs in the WISE bands (see, e.g., Koenig et al. 2012; Nikutta et al. 2014). To avoid such sources, we use the H ii regions in the Anderson et al. (2014)11 catalog, and again conservatively eliminate all sources within twice the radius of each H ii region in the catalog. The catalog of Anderson et al. (2014) contains 8405 sources and removes an additional 105 deg2 from our final catalog.
A similar effect is observed near known star-forming regions. To filter such sources out, we use Lynds' catalogs of Dark and Bright Nebulae (LDN and LBN, respectively; Lynds 1962, 1965). The LDN catalog only lists the surface area of the nebula,  , so for simplicity we assume a radius
  . For the LBN catalog, we assume a radius equal to half of the largest diameter measured for the nebula. Instead of using the conservative approach used before for the PN and H ii regions, here we only eliminate sources within the radius of each nebula. This step eliminates an additional 1443 deg2 from the final catalog.
3.1.4. Nearby Galaxies
Finally, we also consider the possibility of contaminants associated with well-resolved, nearby galaxies. Although this is most likely only an issue for the largest galaxies such as the Large Magellanic Cloud, Small Magellanic Cloud, and M31, we conservatively consider all galaxies listed in the Catalog and Atlas of the Local Volume Galaxies (LVG; Karachentsev et al. 2013),12
as well as all sources in the 2MASS Extended Source Catalog (XSC; Skrutskie et al. 2006). As done for several previous stages of the spatial filtering, we eliminate all sources within twice the radius of each of the sources in the LVG and 2MASS XSC catalogs. For the LVG sources, we use the Holmberg isophote ( in the B band), while for the 2MASS XSC sources, we use the total radius estimate. There are 1,647,900 sources between the two catalogs, and this step removes an additional 856 deg2 from the final AGN catalog.
3.2. Final Catalog
The final R90 and C75 AGN catalogs are presented in Tables 1 and 2, respectively. The R90 catalog contains 4,543,530 sources, while the C75 catalog contains 20,907,127 sources. After applying the spatial filters, the effective area of the final catalogs is 30,093 deg2. This implies that the average source density of the R90 catalog is 151 deg−2 while the corresponding value for the C75 catalog is 695 deg−2.
Table 1. R90 Catalog
| WISE ID | R.A. | Decl. | W1 | σ(W1) | W2 | σ(W2) | W3 | σ(W3) | W4 | σ(W4) | Moon–SAA Flag |

|
|---|---|---|---|---|---|---|---|---|---|---|---|---|
| (WISEA) | (deg) | (deg) | (mag) | (mag) | (mag) | (mag) | (mag) | (mag) | (mag) | (mag) | (deg−2) | |
| J000000.00–165522.3 | 0.0000140 | –16.9228655 | 15.817 | 0.048 | 14.934 | 0.066 | 12.146 | ⋯ | 8.851 | ⋯ | 0 | 205 |
| J000000.01–422938.4 | 0.0000527 | –42.4940188 | 16.774 | 0.086 | 15.022 | 0.068 | 11.332 | 0.162 | 8.716 | ⋯ | 0 | 176 |
| J000000.04+033452.5 | 0.0001897 | 3.5812751 | 15.568 | 0.047 | 14.800 | 0.077 | 11.185 | 0.171 | 8.560 | ⋯ | 0 | 200 |
| J000000.05–201340.3 | 0.0002095 | –20.2278802 | 17.705 | 0.225 | 16.055 | 0.187 | 12.034 | ⋯ | 8.847 | ⋯ | 0 | 310 |
| J000000.06–223834.6 | 0.0002592 | –22.6429645 | 16.429 | 0.078 | 15.079 | 0.086 | 11.943 | 0.341 | 8.610 | ⋯ | 0 | 281 |
| J000000.06–473835.1 | 0.0002617 | –47.6430989 | 14.086 | 0.027 | 13.233 | 0.028 | 9.987 | 0.048 | 7.551 | 0.155 | 0 | 157 |
| J000000.08+165703.8 | 0.0003373 | 16.9510671 | 17.022 | 0.127 | 15.692 | 0.134 | 11.894 | 0.333 | 8.309 | ⋯ | 0 | 210 |
| J000000.09–293647.0 | 0.0003889 | –29.6130691 | 16.248 | 0.064 | 15.226 | 0.083 | 12.108 | 0.276 | 8.700 | ⋯ | 0 | 200 |
| J000000.12–324059.2 | 0.0005112 | –32.6831183 | 17.134 | 0.125 | 15.862 | 0.132 | 12.411 | ⋯ | 9.189 | ⋯ | 0 | 281 |
| J000000.14+190345.9 | 0.0006023 | 19.0627595 | 18.092 | ⋯ | 16.126 | 0.191 | 12.571 | ⋯ | 9.054 | ⋯ | 0 | 172 |
Note. The magnitudes and errors shown correspond to the profile-fitting measurements in the AllWISE catalog. Undetected sources in a given band lack a magnitude uncertainty measurement, and the magnitude column shows a 95% confidence upper bound. The quantity  is defined in Section 3.3.4.
Download table as: ASCIITypeset image
Figures 4–7 show the all-sky source density maps of the R90 and C75 samples, using the Mollweide projection of HEALPix13 (Górski et al. 2005). The distribution of sources is not uniform, with both large-scale, smoothly varying structures in the all-sky maps as well as isolated high concentration regions.

Figure 4. Surface density of sources in the final R90 catalog, obtained with HEALPix and displayed using a Mollweide projection. The colors display different surface densities in units of deg−2, as indicated by the color bar at the bottom of the figure. The white solid line shows the plane of the ecliptic, while the solid white dots show the ecliptic poles.
Download figure:
Standard image High-resolution image
Figure 5. Same as Figure 4 but limiting the R90 catalog to only sources detected with S/N > 10 in W2.
Download figure:
Standard image High-resolution image
Figure 6. Same as Figure 4, but for the C75 catalog.
Download figure:
Standard image High-resolution image
Figure 7. Same as Figure 6, but limiting the C75 catalog to only sources detected with S/N > 10 in W2.
Download figure:
Standard image High-resolution imageIn the next sections, we describe some of these map features and their origins.
3.3. Systematic Structures in the All-sky Map
Most of the systemic features seen in Figures 4–7 are related to known variations in the depth of the WISE survey, which result from the WISE survey strategy.14 However, we also identify additional artifacts introduced by extremely bright stars, planets, and the south Atlantic anomaly (SAA).
3.3.1. Smooth Density Gradients Toward the Ecliptic Poles
The WISE spacecraft is in a polar orbit with a period of 95 minutes, taking images every 11 s in the direction perpendicular to the Earth–Sun line (Wright et al. 2010). Because the scan lines are along lines of ecliptic longitude, this survey pattern results in increasingly denser coverage at higher absolute values of the ecliptic latitudes, as every scan goes through the ecliptic poles.
The gradients caused by such patterns are most apparent in the all-sky density maps of the C75 sample (Figures 6 and 7) but are much less evident in the R90 maps (Figures 6 and 7). The reason for this difference is that the C75 sample is effectively S/N limited, implying a source density that increases with survey depth. The R90 selection criteria instead disfavors fainter sources in W2 by requiring them to be increasingly redder, making it much less susceptible to differences in survey depth.
Interestingly, however, the highest overdensities are not exactly coincident with the ecliptic poles (EPs) but are actually located ∼10° away from the EPs in the direction directly opposite to the GP. This is most likely due to Galactic dust, which is increasingly abundant closer to the GP (see, e.g., Schlegel et al. 1998) and could lower the S/N of a given source either by obscuring its W2 magnitude or by raising the local background. Hence, the location of the highest density regions in the C75 sample is due to a trade-off between lower dust content and deeper survey depth.
Although these large-scale overdensity patterns are mostly dependent on ecliptic and Galactic declination, there is also clearly a pattern that depends on ecliptic longitude, with features that connect both EPs. These features are due to the Moon-avoidance maneuvers of the survey strategy, which avoids fields highly contaminated by scattered Moonlight. We refer the reader to Wright et al. (2010) and the AllWISE Explanatory Supplement for details.
3.3.2. High-density Regions at the SAA Declinations
The SAA is located at intermediate southern Earth latitudes and, as described by Wright et al. (2010), the WISE survey design adopted a specific approach to deal with the decrease of sensitivity when nearing this region. The expectation then would be that there should be no obvious signatures of the SAA in our all-sky source density maps. This is true for the C75 sample but is only true for the R90 sample with W2 S/N > 10. For the R90 sample with W2  , however, there are obvious overdensities at such latitudes. This implies that in these regions, there is an excess of red sources near the detection threshold of the W2 band.
These overdensities are elongated at approximately constant ecliptic longitude, suggesting a relation with the survey scanning pattern. Upon visual inspection of a sample of images in these regions, we find that they display significant background gradients due to scattered Moonlight. However, contamination by Moon-scattered light is not a unique condition of fields near the SAA, but it is only the latter that show such a source enhancement.
It is not clear at this point what is the relation between the SAA and the Moon-scattered light that results in an enhancement of red sources near the detection threshold of the W2 band, and also whether these sources are real or not, although they are likely related to an excess of cosmic rays. We hence strongly caution the user when considering faint sources near the SAA in fields with high Moon background. To aid in identifying possibly problematic sources, we have added a MOON_SAA flag to the catalog (see Tables 1 and 2), which is equal to 1 if the source is at a declination between −15° and −45°, consistent with the SAA latitude, has a moon_lev flag in W2 equal or greater to 3, and W2  .
.
Table 2. C75 Catalog
| WISE ID | R.A. | Decl. | W1 | σ(W1) | W2 | σ(W2) | W3 | σ(W3) | W4 | σ(W4) | Moon–SAA Flag |

|
|---|---|---|---|---|---|---|---|---|---|---|---|---|
| (WISEA) | (deg) | (deg) | (mag) | (mag) | (mag) | (mag) | (mag) | (mag) | (mag) | (mag) | (deg−2) | |
| J000000.00–314627.5 | 0.0000000 | –31.7743100 | 16.874 | 0.099 | 16.093 | 0.168 | 12.211 | ⋯ | 9.099 | ⋯ | 0 | 896 |
| J000000.00–485007.6 | 0.0000076 | –48.8354646 | 17.411 | 0.144 | 16.350 | 0.206 | 11.834 | ⋯ | 8.542 | ⋯ | 0 | 920 |
| J000000.00–165522.3 | 0.0000140 | –16.9228655 | 15.817 | 0.048 | 14.934 | 0.066 | 12.146 | ⋯ | 8.851 | ⋯ | 0 | 729 |
| J000000.01–422938.4 | 0.0000527 | –42.4940188 | 16.774 | 0.086 | 15.022 | 0.068 | 11.332 | 0.162 | 8.716 | ⋯ | 0 | 896 |
| J000000.01–323326.5 | 0.0000589 | –32.5573670 | 16.771 | 0.091 | 16.002 | 0.166 | 12.545 | ⋯ | 9.133 | 0.468 | 0 | 963 |
| J000000.01–112405.6 | 0.0000639 | –11.4015677 | 17.179 | 0.140 | 16.153 | 0.199 | 12.517 | ⋯ | 9.035 | ⋯ | 0 | 620 |
| J000000.01+350440.6 | 0.0000738 | 35.0779461 | 16.990 | 0.109 | 16.035 | 0.170 | 12.066 | ⋯ | 9.083 | ⋯ | 0 | 477 |
| J000000.02–485353.6 | 0.0001188 | –48.8982362 | 16.537 | 0.073 | 15.815 | 0.138 | 12.146 | ⋯ | 8.554 | ⋯ | 0 | 920 |
| J000000.03+140926.9 | 0.0001278 | 14.1574789 | 17.271 | 0.149 | 16.094 | 0.194 | 12.386 | ⋯ | 8.188 | ⋯ | 0 | 596 |
| J000000.03–191610.5 | 0.0001360 | –19.2696075 | 16.617 | 0.091 | 15.652 | 0.140 | 12.459 | ⋯ | 8.962 | ⋯ | 0 | 581 |
Note. The magnitudes and errors shown correspond to the profile-fitting measurements in the AllWISE catalog. Undetected sources in a given band lack a magnitude uncertainty measurement, and the magnitude column shows a 95% confidence upper bound. The quantity  is defined in Section 3.3.4.
Download table as: ASCIITypeset image
3.3.3. Diffraction Spikes
A number of additional overdensities in the R90 and C75 maps can be associated with spurious sources coincident with diffraction spikes from bright saturated stars. Diffraction spikes around bright stars produce a significant number of artifacts, and the AllWISE source extraction attempts to flag detections that are either contaminated by or spurious detections of diffraction spikes. The accuracy of the flagging was limited by the imperfect knowledge of heavily saturated stars and by changes in the survey sensitivity because of depth-of-coverage variations around the sky.
Upon visual inspection of these overdense regions, we found that the algorithm used for the artifact detection sometimes underestimates the length of the diffraction spikes and hence did not flag a number of spurious sources. It is, however, only a small fraction of bright stars for which the length of the diffraction spikes was underestimated. Inspecting a randomly selected group of the brightest stars in the WISE catalog, we find that this issue is generally not observed, implying that the diffraction spike detection algorithm is generally working properly. It is not clear, however, why the process would be failing just for a small number of bright stars. It is possible that this issue is due to the inherent difficulty of measuring the brightness of heavily saturated stars. Additionally, stellar variability might play a role by effectively varying the length of the diffraction spikes from image to image. Hence, faint sources near bright stars should be treated with caution.
3.3.4. Solar System Planet Residuals
Finally, we find a number of spurious sources associated with residuals left by solar system planets in the co-added WISE data. Although moving objects are typically suppressed in the co-added images, the brightest ones, namely, Mars, Jupiter, and Saturn, can leave residuals that trigger spurious detections that may persist in the AllWISE catalog (see the AllWISE Explanatory Supplement for details). Upon inspection of some of the highest density HEALPix pixels in the all-sky density maps of the R90 and C75 samples, we find that some such residuals meet our selection criteria and hence appear in our final R90 and C75 catalogs. Unlike bright stars, the quick apparent motion of planets makes it more difficult to deal with in a simple manner.
Note, however, that spurious sources arising from unflagged artifacts due to the residuals of solar system planets and the diffraction spikes of bright stars result in much higher local surface densities of AGNs. This is also the case for the Moon-contaminated SAA fields, as well as for fields with PNe, H ii regions, and star-forming regions outside the areas used to filter the R90 and C75 catalogs in Section 3.1. Considering this, we include for each source in the final R90 and C75 catalogs the surface density of the HEALPix pixel that contains it ( ) so the user can decide how to best deal with the described artifacts.
Figure 8 shows the distribution of  for the R90 and C75 catalogs, including their restricted versions requiring S/N > 10 in W2. Each figure also shows the median, 95th, and 99th percentile of the distributions, which are listed in Table 3.

Figure 8. Distribution of  , the AGN candidate surface density in HEALPix pixels (NSIDE = 27) containing at least one object. The area of each pixel is 0.21 deg2. The dashed black line shows the median of the distribution, while the blue and red lines show the
  and 99th percentiles. The highest pixel densities might be indicative of the contaminants discussed in Section 3.3.
Download figure:
Standard image High-resolution imageTable 3.
HEALPix Pixel Surface Density  (deg−2)
| Sample | Percentiles | |||
|---|---|---|---|---|
| Median | 90th | 95th | 99th | |
| R90, W2 S/N > 5 | 143 | 219 | 248 | 319 |
| R90, W2 S/N > 10 | 81 | 124 | 133 | 157 |
| C75, W2 S/N > 5 | 643 | 1096 | 1249 | 1516 |
| C75, W2 S/N > 10 | 119 | 238 | 305 | 448 |
Download table as: ASCIITypeset image
4. Highly Variable Objects
The AllWISE catalog classifies sources according to their probability of variability, which is determined from forced photometry at the individual frame level (see the AllWISE Data Release Explanatory Supplement for details). The classification is done per band, assigning a number ranging from 0 through 9 going from least to most probable for variability.
Here, we focus on the subset of sources from the R90 catalog that are most likely to be real variables. Specifically, we select all objects that have a variability flag of 9 in both the W1 and W2 bands. Only 687 such sources, corresponding to 0.015% of the R90 catalog, match this criterion. Given the survey design, there are two natural cadences for the WISE data: the cadence of ∼3 hr that corresponds to twice the orbital period of the satellite, and the cadence of about six months set by half of the orbital period of the Earth around the Sun. For every region in the sky, WISE obtained at least eight images (with coverage increasing with distance to the ecliptic) separated in time by the shorter cadence, and then returned to the same region at least once more with a time separation of six months.
The sensitivity to short variability timescales means that a significant number of these 687 sources are likely to be blazars. To assess the fraction of these sources that are blazars, we use the FIRST survey (Becker et al. 1995). Although in general cross-matching radio surveys with surveys at other wavelengths can be quite challenging due to highly extended radio structures that necessitate sophisticated approaches (de Vries et al. 2006), blazars avoid this issue since they contain compact, beamed radio cores. Therefore, we simply use a 5'' matching radius to find counterparts between our highly variable R90 catalog sources and FIRST sources through the official FIRST Catalog Search tool.15 Of the 687 mid-IR variable sources, 207 are within the FIRST footprint and 162 (78%) are detected by FIRST. The remaining 45 objects (22%) are not detected by FIRST and are therefore unlikely to be blazars. In the next section, we discuss the spectra of some of those highly variable R90 AGN candidates, while in Section 4.2 we focus on one of these objects for which new spectroscopy reveals that the source is a changing-look quasar, transitioning from a type 1 to a type 2 AGN. The light curves of the variable sample will be discussed in detail in R. J. Assef et al. (2017, in preparation).
For completeness, we also cross-match our highly variable R90 sources with the source catalog of the NVSS survey (Condon et al. 1998). We obtained the NVSS source catalog through the VizieR Astronomical Server. We find that 411 of the highly variable R90 sources are within 22 5 (HWHM of the NVSS beam) of an NVSS source, 251 of which are outside of the FIRST footprint. There are a total of 150 highly variable AGNs within the NVSS footprint (i.e., with declination >–40°) but without an NVSS source within 225. Of these, 103 are outside the FIRST footprint. Given the somewhat shallower depth of the NVSS survey as well as the very large beam size, these results are somewhat harder to interpret, and hence we focus the discussion of the following sections only on those objects within the FIRST survey footprint.
4.1. Optical Spectroscopy
Of the 687 highly variable sources, 136 have optical spectra in the Sloan Digital Sky Survey Data Release 12 (Alam et al. 2015). Of these, 132 are within the FIRST survey footprint, and 103 have measured fluxes at 1.4 GHz. This implies that 29 out of the 45 non-radio, highly variable AGNs have optical spectra from SDSS. Their spectroscopic redshifts and classifications are listed in Table 4. We also add spectroscopic redshifts and classifications for four more objects from SIMBAD. For the SDSS objects classified as stars as well as those with significant warnings from the SDSS pipeline, we show the SIMBAD classification instead. Finally, we also add a photometric redshift and classification from SIMBAD for WISEA J150954.94+203619.6. Of the 33 non-radio, highly variable WISE AGN candidates, we find that 19 are classified as type 1 AGNs (either QSO or Seyfert 1), six are classified as "Galaxy AGNs" (meaning they have narrow-emission lines characteristic of type 2 AGNs), one is classified as a possible AGN, four are classified as galaxies, and three are classified as stars. Upon inspection of the spectra of the four objects classified as galaxies, we find that their Hα emission lines have significantly broadened bases, suggesting an important AGN contribution. Of the three sources classified as stars, two are classified as carbon stars. These cool giant stars can produce significant amounts of dust. For the remaining object classified as a star, WISEA J163518.38+580854.6, no further information on its nature is provided by SIMBAD. However, this object is likely associated with the ROSAT X-ray source 1RXS J163518.7+580856 located only 278 away, implying it may be an unrecognized quasar. Note that if the 90% reliability of the R90 sample were to hold for this subgroup of highly variable mid-IR AGN candidates, we would have expected about 3 of the 33 sources to be contaminants, consistent with the number of Galactic sources found if all four targets classified as galaxies host AGN activity.
Table 4. Spectroscopic Properties of Radio-quiet, Highly Variable WISE AGNs
| WISE ID | Redshift | Classification | References |
|---|---|---|---|
| (WISEA) | |||
| J000011.72+052317.4 | 0.0400 | Seyfert 1 | SIMBAD |
| J014004.69–094230.4 | 0.1461 | QSO | SDSS |
| J090546.35+202438.2 | ⋯ | Carbon Star | SIMBAD |
| J091225.00+061014.8 | 0.1453 | Galaxya | SDSS |
| J094806.56+031801.7 | 0.2073 | QSO | SDSS |
| J095824.97+103402.4 | 0.0417 | Galaxy AGN | SDSS |
| J100933.13+232255.7 | 0.0719 | Galaxy AGN | SDSS |
| J104241.08+520012.8 | 0.1365 | QSO | SDSS |
| J112537.83+212042.2 | 0.0894 | QSO | SDSS |
| J130155.84+083631.7 | ⋯ | Carbon Star | SIMBAD |
| J130716.98+450645.3 | 0.0843 | QSO | SDSS |
| J130819.11+434525.6 | 0.0365 | Galaxy AGN | SDSS |
| J140033.66+154432.1 | 0.2152 | QSO | SDSS |
| J141053.43+091027.0 | 0.1781 | QSO | SDSS |
| J141105.45+294211.8 | 0.0724 | QSO | SDSS |
| J141758.60+091609.7 | 0.1389 | QSO | SDSS |
| J142747.45+165206.0 | 0.1435 | QSO | SDSS |
| J142846.71+172353.1 | 0.1040 | QSO | SDSS |
| J144039.30+612748.1 | 0.0811 | QSO | SDSS |
| J144131.81+321612.9 | 0.1993 | QSO | SDSS |
| J144439.59+351304.7 | 0.0790 | Galaxya | SDSS |
| J144510.14+304957.1 | 0.2754 | QSO | SDSS |
| J144603.98–013203.4 | 0.0840 | Galaxy AGN | SDSS |
| J145222.03+255152.0 | 0.1204 | QSO | SDSS |
| J150954.94+203619.6 | 0.4149b | Possible AGN | SIMBAD |
| J151215.73+020316.9 | 0.2199 | Galaxy AGN | SDSS |
| J151444.52+364237.9 | 0.1944 | QSO | SDSS |
| J151518.56+312937.5 | 0.1036 | QSO | SDSS |
| J155223.29+323455.0 | 0.1277 | Galaxya | SDSS |
| J161846.36+510035.1 | 0.3189 | QSO | SDSS |
| J162140.25+390105.1 | 0.0642 | Galaxy AGN | SDSS |
| J163518.38+580854.6 | ⋯ | Star | SIMBAD |
| J213604.22–050152.0 | 0.1284 | Galaxya | SIMBAD |
Notes.
aAlthough the object is classified as a galaxy in SDSS or SIMBAD, the Hα emission line shows a broad base, suggesting the presence of an AGN. bPhotometric redshift. No spectroscopic classification is available for this object.Download table as: ASCIITypeset image
As the SDSS targeting criteria is biased toward unobscured AGNs, we complement this sample with long-slit optical spectroscopic observations obtained for five additional highly variable AGN candidates within the SDSS survey footprint but without SDSS spectra. The observations were carried out on the night of UT 2016 February 6 using the DBSP optical spectrograph at the Palomar Observatory 200 inch telescope. We used the D55 dichroic with the 600 lines/mm grating (4000 Å blaze) on the blue arm and the 316 lines/mm grating (7500 Å blaze) on the red arm. The slit used had a width of 15. Due to scheduling constraints, most of the targets selected were in regions close to the GP. Reductions were carried out in a standard manner using IRAF.16
Table 5 shows the results of these observations. We first observed two sources that were not detected in the FIRST survey, as per the sources listed in Table 4. We find that both are AGNs. WISEA J015858.48+011507.6 has a spectrum consistent with a type 2 AGN at z = 0.184, with high [O iii]/Hβ and [N ii]/Hα ratios and clear detection of the high excitation [Ne v] line. WISEA J101536.17+221048.9 shows broad emission lines and a continuum consistent with a reddened type 1 AGN at z = 0.555.
Table 5. Spectroscopic Follow-up of Highly Variable WISE AGNs
| WISE ID | Redshift | Classification |
|---|---|---|
| (WISEA) | ||
| Undetected by FIRST | ||
| J015858.48+011507.6 | 0.184 | Type 2 AGN |
| J101536.17+221048.9 | 0.555 | Red Type 1 AGN |
| Detected by FIRST | ||
| J090931.55–011233.3 | 0.201 | |
| J095528.76+572837.2 | ⋯ | Blazar? |
| Outside FIRST | ||
| J051939.78+160044.0 | ⋯ | Galactic CV |
Download table as: ASCIITypeset image
Additionally, we observed two sources that are well-detected in the FIRST survey but are within the 25% faintest radio fluxes. WISEA J090931.55–011233.3 ( ) has a spectrum consistent with a type 2 AGN at z = 0.201, although with a red continuum and unusually low equivalent width emission lines. WISEA J095528.76+572837.2 (
 ) shows a featureless continuum consistent with a blazar.
Finally, we observed one source, WISEA J051939.78+160044.0, outside of the FIRST radio survey areal coverage. This source is a Galactic cataclysmic variable (CV), likely associated with the ROSAT source 1RXS J051939.7+160042 which is offset by only 2'' according to SIMBAD.17 This source is in the vicinity of the Orion Nebula and only 12° away from the GP, so its Galactic nature is reasonably expected.
4.2. WISEA J142846.71+172353.1: A Changing-look Quasar
We obtained new spectroscopic observations for WISEA J142846.71+172353.1, classified as a broadline QSO by SDSS (see Table 4), to study its spectral evolution in the face of the strong WISE variability. Observations were obtained on the night of UT 2017 January 30 (MJD 57783) with the DBSP optical spectrograph at the Palomar Observatory 200 inch telescope using the same setup described in the previous section. Figure 9 shows the resulting spectrum as well as the earlier SDSS spectrum obtained on the night of UT 2008 February 10 (MJD 54506).

Figure 9. Optical spectroscopic observations of WISEA J142846.71+172353.1. The top panel shows the earlier spectrum obtained by SDSS while the bottom panel shows a recently obtained spectrum with the DBSP instrument at the Palomar Observatory 200 inch telescope. Note that for the latter we have not corrected for telluric absorption (i.e., A band at about 7600–7630 Å and B band at about 6860–6890 Å). The broad component of Hα observed in the SDSS spectrum is missing in the recent Palomar observations.
Download figure:
Standard image High-resolution imageA decade ago, the source exhibited a clear broad component to the Hα emission line that is not present in 2017. However, neither spectrum shows a broad Hβ component, indicating that the source transitioned from an intermediate-type AGN at the time of the SDSS observations to a type 2 AGN at the time of our Palomar observations. Figure 10 shows the W1 and W2 light curve of this source. We include the latest publicly available W1 and W2 data from NEOWISE-R (Mainzer et al. 2014). Additionally, we include its optical light curve from the Catalina Real-Time Transient Survey18 (CRTS; Drake et al. 2009), retrieved from the Catalina Surveys Data Release 2. Between the WISE and NEOWISE-R epochs, the source dimmed by approximately 1 mag in both W1 and W2, with further, lower amplitude variability observed between the epochs of each survey independently. In contrast, there is no strong optical variability observed by CRTS. This is consistent with both spectroscopic classifications, as in both an intermediate-type and a type 2 AGN, the optical emission is dominated by the host galaxy. The large drop in mid-IR fluxes suggests that the change in spectroscopic classification is most likely due to a decrease in accretion rate rather than a change in obscuration.

Figure 10. Light curve of WISEA J142846.71+172353.1 in the optical from CRTS (green points) and in the WISE bands W1 (purple points) and W2 (red points). All magnitudes are shown in the AB system to limit the dynamic range of the vertical axis. For W1 and W2, the small circles show the individual frame photometry in the AllWISE and NEOWISE-R surveys. The large circles show the median of each epoch.
Download figure:
Standard image High-resolution image5. Comparisons with Other Surveys
As mentioned earlier, a number of AGN catalogs already exist in the literature that are similarly as large as ours. In this section, we compare with a number of them in order to characterize how they differ from our R90 and C75 catalogs as well as to assess what the relative completeness and biases are. We consider both mid-IR selected catalogs as well as catalogs selected in different wavelength ranges and, hence, affected by very different systematics.
5.1. Secrest et al. (2015) WISE AGN Catalog
Recently, Secrest et al. (2015) presented an all-sky AGN catalog selected purely on their WISE colors, based on the selection criteria of Mateos et al. (2012). These criteria require a detection in the W3 band. A13 showed these criteria to be less reliable than the R90 criterion at faint W2magnitudes, though they are equally reliable at brighter magnitudes. The trade-off is that the Mateos et al. (2012) selection criteria are more complete at faint W2 magnitudes than the R90 selection. As noted by Jarrett et al. (2011), requiring a detection in W3 can be particularly useful near the high survey coverage areas at the EPs, where W1 and W2 are confusion limited, and the lower source density W3 band provides robust photometry. However, the lower sensitivity of the W3 band restricts the AGN sample size created using the selection criteria of Mateos et al. (2012). Additionally, Secrest et al. (2015) required a 5σ detection in all three WISE bands, creating a robust catalog at the cost of decreasing the number of sources selected. Indeed, the full catalog presented by Secrest et al. (2015) consists of 1,354,775 sources, and once we apply the same spatial filters as described in Section 3.1, the catalog is reduced by 15% to 1,140,022 sources. This is roughly 25% of the sources in our R90 catalog.
Comparing the catalogs, we find that only 50,877 (4.5%) of the Secrest et al. (2015) AGN candidates after applying the spatial filtering are not contained in our R90 sample. This number is further reduced to 42,565 (3.7%) when we eliminate objects that do not meet the additional requirements we imposed in Section 3. These are likely real AGNs that fall outside the R90 selection criterion. Our R90 sample hence recovers the great majority of the objects selected as AGNs by Secrest et al. (2015) but contains approximately four times more sources, making it a much more complete AGN sample with comparable reliability. Comparing to our C75 catalog instead, we find that only 17,284 (1.5%) of the Secrest et al. (2015) AGN candidates, after applying the spatial filtering and additional requirements, are not contained in it.
5.2. Match to the Updated XDQSOz Catalog
As another comparison of this new WISE AGN catalog to other large, multiwavelength quasar catalogs, we matched the R90 sample to the updated extreme deconvolution quasar catalog presented by DiPompeo et al. (2015). Bovy et al. (2011) originally developed and applied an extreme deconvolution technique to build a quasar catalog (XDQSO) from all point sources in Data Release 8 of the Sloan Digital Sky Survey (Aihara et al. 2011). Bovy et al. (2012) added photometric redshift information, UV photometry, and near-IR photometry to produce the XDQSOz. That catalog was further updated by DiPompeo et al. (2015) to incorporate public all-sky WISE photometric data, which improves both quasar likelihood assessments and photometric redshifts; we refer to the updated catalog as the uXDQSOz. The uXDQSOz identifies 5,537,436 potential quasars with probability  , or 3,874,639 quasars weighted by probability.
As before, we apply our spatial filtering procedure to the uXDQSOz, which reduces the number of uXDQSOz sources within our R90 footprint to 4,105,027. We then match the two catalogs with TOPCAT19
(Taylor 2005) using a matching radius of 45 determined using single matches only (i.e., closest pairs); above this threshold, chance coincidences start to become significant. We obtain 631,662 matches, of which >99% are single matches. This represents just 15.4% of uXDQSOz sources within the area under consideration. However, 83.6% of the matched R90 sources have  , as compared to just 42.1% of the uXDQSOz within this area. These percentages become even more extreme if we consider that 80.7% of the matched sources have
  while only 37.3% of the entire uXDQSOz catalog within the R90 footprint has this very high likelihood of being quasars. Many of the uXDQSOz high-likelihood quasars not identified by the WISE color selection are at higher redshifts (z ≳ 3), where the observed mid-IR colors become bluer (e.g., Figure 1 of A13). Conversely, WISE identifies robust quasar candidates across most of the sky, whereas the uXDQSOz is restricted to the SDSS footprint. Furthermore, WISE identifies obscured quasars, most of which would be lost by the initial requirement of the extreme deconvolution quasar samples that the target be unresolved in SDSS optical imaging.
5.3. The SDSS Quasar Catalog
We compare our WISE-selected AGN catalogs with the latest edition of the SDSS quasar catalog, based on the 12th data release of the survey (Pâris et al. 2017). Because SDSS is an optical survey, the DR12 quasar catalog preferentially contains unobscured AGNs. We refer the reader to Ross et al. (2012) and Pâris et al. (2017) for the exact details of sample selection.
The SDSS DR12 quasar catalog contains 297,301 spectroscopically confirmed AGNs. We find that 209,758 (70%) of these sources have a counterpart in the AllWISE catalog within a matching radius of 2''. This number reflects the fact that SDSS targets significant numbers of quasars that are fainter than the WISE detection limits. However, this fraction is higher than the 64% AllWISE matches reported by Pâris et al. (2017) for the same matching radius (190,408 sources within the entire catalog). The source of the discrepancy is currently unknown but is likely related to the additional quality flags applied by Pâris et al. (2017) on the WISE photometry. Of these 209,758 WISE matches, 158,356 (75%) meet the data quality requirements used to build the main sample from which the R90 and C75 samples were generated in Section 3 (i.e., WISE point sources, not flagged as either artifacts or affected by artifacts, fainter than the saturation limits in W1 and W2, and with W2  ) and are within the area allowed by the spatial filters applied in Section 3.1.
Cross-matching with our WISE-selected AGN catalogs, we find that 90,326 (30%) of the SDSS AGN are in the R90 sample and 138,410 (47%) are in the C75 sample. This means that 57% and 87% of the objects in the SDSS DR12 quasar catalog with WISE matches that pass the data quality and spatial filter requirements of our main sample are found in the R90 and C75 samples, respectively. Note that the completeness is higher than expected for the C75 sample, implying that SDSS misses a fraction of the WISE-detected AGNs used to calibrate the selection in Section 2. The fraction of SDSS AGNs missed by the R90 and C75 catalogs is not random though, but rather depends significantly on other parameters. Figure 11 shows the redshift distribution of SDSS quasars recovered by the R90 (left panel) and C75 (right panel) criteria, as well as of those with matches in the AllWISE catalogs that meet all the requirements of Section 3 but were not recovered by the respective selection criteria. The redshift distribution of the SDSS quasar catalog is triple peaked. The peaks at z ∼ 0.8 and z ∼ 1.6 are due to degeneracies in the SDSS color–redshift space (Ross et al. 2012; Pâris et al. 2017), while the peak at  is mostly related to the Baryon Oscillation Spectroscopic Survey experiment (BOSS; Dawson et al. 2013), which primarily targeted
  quasars. The R90 criterion recovers SDSS AGNs with a higher efficiency in the 1 ≲ z ≲ 2 range. At z ≳ 2, the W1 – W2 color of unobscured AGNs starts becoming progressively bluer (see, e.g., Figure 1 of A13), while the R90 color cut becomes progressively redder for fainter W2 magnitudes (see Figure 1 and Equation (4)). At z ≲ 1, the recovered fraction is somewhat lower, most likely due to missing the less luminous AGNs that will have a higher host-galaxy contribution to the total luminosity. The stellar emission of those objects will make them have somewhat bluer W1 – W2 colors that are missed at faint W2 fluxes by the R90 selection criterion. The C75 criterion has a much higher recovery rate at all redshifts, containing a very large fraction of all the SDSS quasars in the 1 ≲ z ≲ 3 redshift range. At z > 3, the W1 – W2 colors of unobscured AGNs become too blue to be selected by the C75 criterion, in part due to the contribution of the broad Hα emission line to the W1 band (Assef et al. 2010, A13). Although the z ≲ 1 the recovery rate is also much higher than for the R90 criterion, the lower efficiency compared to higher redshifts is most likely also due to the host-galaxy contamination discussed above for the R90 selection. Figure 12 shows a similar comparison, but for the absolute i-band magnitudes instead of redshift. As for the redshift distribution, the recovery efficiency of the R90 criterion is highest for intermediate luminosities while being lower at the bright and faint ends, which primarily correspond to the highest and lowest ends of the redshift distribution. Similarly, the C75 criterion has a higher recovery for
  , which corresponds to the highest redshift ranges.

Figure 11. (Left) Redshift distribution of SDSS DR12 quasars with matches in the AllWISE catalog that pass the requirements outlined in Section 3. The gray histograms show the distribution of quasars, while the blue (red) lines shows those found (not found) within the R90 catalog. (Right) Same as the left panel but comparing to the C75 catalog.
Download figure:
Standard image High-resolution image
Figure 12. Absolute i-band magnitude distribution of SDSS DR12 quasars with matches in the AllWISE catalog that pass the requirements outlined in Section 3. Lines and panels have the same definition as in Figure 11.
Download figure:
Standard image High-resolution image5.4. Second ROSAT All-sky Survey
The ROSAT X-ray satellite scanned the entire sky between 1990 June and 1991 August in the 0.1–2.4 keV energy band, making it the most sensitive all-sky high-energy survey to date and the best suited for comparing X-ray and WISE all-sky mid-IR AGN selection. For these scanning mode observations, the ROSAT beam has an FWHM of ∼30''. The second release of these observations, presented as the second ROSAT All-Sky Survey (2RXS; Boller et al. 2016), includes 135,118 X-ray sources down to a likelihood threshold of 6.5 (i.e., EXI_ML ≥ 6.5), where the catalog is expected to contain about 30% spurious detections. Adopting a more conservative likelihood threshold of EXI_ML ≥ 9, the catalog contains 74,453 sources with an expected 5% spurious fraction. The flux limit of 2RXS corresponds to  .
.
To match the R90 quasar catalog to 2RXS, we begin by applying the spatial filtering procedure described in Section 3.1, which reduces the number of 2RXS sources under consideration to 51,973 for the more conservative likelihood threshold. Using TOPCAT, we match the filtered 2RXS catalog to the R90 catalog using a matching radius of 36'' and allowing for multiple matches. This radius was determined using single matches only (i.e., closest pairs); above this threshold, chance coincidences start to dominate. Boller et al. (2016) use a similar value (40'') when matching 2RXS to the Tycho-2 catalog (Hog et al. 1998). We obtain 18,241 matches, corresponding to 35.1% of the X-ray sources but to only 0.4% of the R90 sources. Figure 13 shows the distribution of source X-ray fluxes for the spatially filtered conservative likelihood threshold as well as the distribution and fraction matched to WISE AGN candidates. We see that the bulk of the 2RXS sources have fluxes of a  and that the fraction with WISE AGN candidate counterparts varies only slightly with flux, dropping at the highest fluxes. The 64.9% of 2RXS sources not associated with R90 sources likely represent a combination of spurious X-ray sources, Galactic X-ray sources, and galaxy clusters. For example, considering more than 2000 high Galactic latitude (
 ) ROSAT sources with X-ray fluxes ≳10× the detection threshold from the ROSAT Bright Survey, Schwope et al. (2000) show that approximately half the X-ray sources are Galactic, with the remaining split approximately 2:1 between X-ray AGNs and galaxy clusters (i.e., only 32.3% of bright ROSAT sources are AGNs). Assuming no dramatic changes as one considers sources closer to the ROSAT detection threshold, the results here suggest that the vast majority of ROSAT AGNs are identified by the R90 selection criterion.

Figure 13. Open histogram in the top panel shows the distribution of 0.1–2.4 keV X-ray fluxes for the 2RXS, considering the 51,973 sources with EXI_ML ≥ 9 (∼5% spurious fraction) and subject to the spatial filtering discussed in Section 3.1 to avoid the Galactic plane and other areas subject to elevated levels of false positive mid-IR-selected AGN candidates. Fluxes have been calculated by multiplying the count rate by  , which assumes an X-ray power-law model (cf., Boller et al. 2016). The filled histogram shows the X-ray flux distribution of this subset of 2RXS sources with mid-IR-selected AGN candidate counterparts. The bottom panel shows the matched fraction as a function of X-ray flux. The fraction is relatively constant at a value slightly below 40%, except at the highest fluxes where the fraction dips.
Download figure:
Standard image High-resolution imageThe intersection of X-ray-selected and mid-IR-selected AGNs has been addressed multiple times previously (i.e., Gorjian et al. 2008; Hickox et al. 2009; Wilkes et al. 2009; Eckart et al. 2010; Donley et al. 2012; Stern et al. 2012; Mendez et al. 2013). Mid-IR AGN selection requires the AGN component to dominate over the host-galaxy SED in the observed mid-IR bands, restricting such selection to more luminous AGNs (in the quasar regime), albeit with enhanced sensitivity to even heavily obscured AGNs compared to optical quasar selection. X-ray selection has much less emission to contend with from stellar-related processes, making X-ray selection sensitive to lower luminosity AGNs, reaching into the Seyfert regime. However, most sensitive wide-field X-ray surveys to date are in the lower energy, or soft X-ray, regime (<10 keV), making them susceptible to absorption and thus less comprehensive for obscured AGN selection. This is particularly true for ROSAT, with its high-energy cut-off at 2.4 keV. Illustrating the luminosity dependence, Eckart et al. (2010) compares the X-ray and mid-IR selection of several hundred AGNs and AGN candidates using data from six relatively deep fields observed by Chandra and Spitzer. While >80% of X-ray AGNs with  are selected using the Stern et al. (2005) Spitzer mid-IR AGN selection criteria, this fraction drops monotonically with X-ray luminosity, such that only 36% of sources with
  are selected by the Spitzer mid-IR AGN selection criteria. Therefore, the ROSAT-detected AGNs not selected by the R90 criterion are expected to primarily be lower luminosity AGNs, while the WISE-selected AGNs not detected by ROSAT are likely to be luminous quasars below the ROSAT detection threshold including obscured quasars.
We note that recently, Salvato et al. (2017) have presented a catalog of AllWISE counterparts to the 2RXS catalog sources. Instead of simply relying on positional proximity as done above, Salvato et al. (2017) uses a Bayesian matching algorithm that considers the astrometric information of the sources as well as a prior on the color and magnitude of the AllWISE sources determined empirically from the cross-match between the AllWISE catalog and the 3XMM-DR5 catalog of X-ray sources (Rosen et al. 2016), which is considerably deeper than the 2RXS catalog. Salvato et al. (2017) finds at least one AllWISE counterpart to 48,416 2RXS sources that pass the spatial filters described in Section 3.1 and that have EXI_ML ≥ 9. Because of the nature of their approach, the catalog does not differentiate between AGN and non-AGN sources. We find that of the best-matched AllWISE source to those 48,416 X-ray sources (i.e., those with match_flag=1; see Salvato et al. 2017 for details), 19,109 (39.5%) are in the R90 catalog. Of the 29,307 sources not in the R90 catalog, we find that only 15,777 meet the additional requirements we imposed in Section 3 and are likely a combination of Galactic sources, galaxy clusters, and low-luminosity AGNs as discussed earlier as well as some chance alignments. Specifically, if we compare for these 15,777 sources their p_any values, defined by Salvato et al. (2017) as the probability that any of their AllWISE associations to 2RXS sources is the correct one, we find that 40% have p_any above 0.8 and 32% have p_any below 0.2. Instead, for the 19,109 sources that are in the R90 catalog, we find that 80% have p_any above 0.8, and only 2% have p_any below 0.2, suggesting a significantly lower fraction of chance alignments.
5.4.1. Quasar Triplets with ROSAT Counterparts
Of the 18,241 matches between the R90 and filtered 2RXS catalogs discussed above, 17,217 (94.4%) are single matches. The remainder are multiple matches, where two or more R90 AGN candidates are within 36'' of a 2RXS X-ray source. Multiple-quasar systems are extremely rare, with only a few confirmed cases reported in the literature (Djorgovski et al. 2007; Farina et al. 2013; Hennawi et al. 2015). We consider this sample in greater detail next, as it has the potential to identify galaxy clusters based on an overdensity of AGNs. In particular, since AGNs are more common in distant galaxy clusters, with a rate that vastly outpaces their field evolution (e.g., Galametz et al. 2012; Martini et al. 2013), this could be a promising method to identify distant ( ) X-ray-emitting galaxy clusters and illustrates just one of the multitude of new studies enabled by this WISE AGN catalog.
Most of the multiple matches correspond to two R90 sources matched to a single 2RXS source, but there are 33 cases of a single X-ray source having three R90 sources within the matching radius, one case of a single X-ray source matching with four R90 sources (2RXS J094004.6+122047), and one extreme case of a single X-ray source having eight R90 sources within 36'' (2RXS J002057.4−194632). The most extreme overdensities prove to be spurious, where the octet is associated with an excess of sources in a field affected by both the SAA and the Moon (cf., Section 3.3.2), and the quartet is associated with diffraction spikes from the well-studied, IR-bright carbon star IRC+10216 (also known as CW Leonis), which is the brightest 5 μm source in the sky outside the solar system (see Section 3.3.3). Considering the 33 triplets, several also seem to be affected by elevated noise associated with SAA and lunar passages. Section 3.3.2 shows that the SAA and lunar contamination is significantly less problematic if one only considers W2 sources detected at ≥10σ. One draconian, but effective, method to avoid contamination is therefore to require bright mid-IR AGN candidates. Adopting a photometric limit of W2 ≤ 15.05, roughly corresponding to the 10σ threshold at the shallowest regions of the WISE survey (Stern et al. 2012), reduces the sample of triplets to the four 2RXS sources listed in Table 6.
Table 6. Quasar Triplets with ROSAT Counterparts
| 2RXS Source | WISE Source | W1 | W2 | z |
|---|---|---|---|---|
| 2RXS J144427.2+311322 | WISEA J144426.93+311307.8 | 14.87 | 13.89 | 0.449 |
| WISEA J144427.97+311313.9 | 15.91 | 14.68 | 1.798 | |
| WISEA J144429.40+311321.2 | 13.98 | 12.62 | 1.730 | |
| 2RXS J150158.6+691029 | WISEA J150156.58+691018.3 | 15.78 | 14.78 | 1.129 |
| WISEA J150158.49+691014.6 | 14.68 | 13.54 | 1.130 | |
| WISEA J150200.15+691020.0 | 14.93 | 13.58 | 1.137 | |
| 2RXS J162949.1+052341 | WISEA J162948.86+052353.1 | 15.10 | 14.41 | |
| WISEA J162949.68+052358.0 | 13.94 | 12.89 | ||
| WISEA J162951.29+052328.1 | 15.92 | 14.88 | ||
| 2RXS J220938.7-332250 | WISEA J220936.03–332247.2 | 15.97 | 14.86 | |
| WISEA J220938.34–332237.6 | 13.43 | 12.17 | ||
| WISEA J220940.80–332244.4 | 16.60 | 15.01 |
Note. The redshift of the brightest 14 hr source is from SDSS, while redshifts of the other two are from our Keck follow-up. The three redshifts for the 15 hr sources are from our Palomar follow-up.
Download table as: ASCIITypeset image
We obtained optical spectroscopy of the three WISE AGN candidates associated with one of these triplets, 2RXS J150158.6+691029 (Figure 14), on UT 2016 October 2 with the optical dual-beam Double Spectrograph on the Hale 200 inch Telescope at Palomar Observatory, and we obtained optical spectroscopy of the three WISE AGN candidates associated with another of these triplets, 2RXS J144427.2+311322, on UT 2017 April 28 with the Low Resolution Imaging Spectrometer (LRIS; Oke et al. 1995) at Keck Observatory. The Palomar night had 1'' seeing, with slight cirrus in the morning, and we configured the instrument with the 15 wide slit, the 5500 Å dichroic, the 600 lines/mm grating on the blue arm ( ; spectral resolving power
  ), and the 316 lines/mm grating on the red arm (
 ; R ∼ 1800). The Keck night was photometric with sub-arcsecond seeing, and we configured the instrument with the 10 wide slit, the 5600 Å dichroic, the 600 lines/mm grism on the blue arm (
 ; R ∼ 1200), and the 400 lines/mm grating on the red arm (
 ; R ∼ 1200). At Palomar, we obtained two 900 s integrations, both at a position angle of 58
 6. The first integration simultaneously observed the two AGN candidates to the east, while the second integration observed the western candidate. At Keck, we obtained a single 300 s integration at a position angle of 657, which simultaneously covered all three WISE AGN candidates. We processed all of the data using standard techniques within IRAF and calibrated the spectra using standard stars from Massey & Gronwall (1990) observed on the same nights. Table 6 presents the results from the spectroscopy, and Figure 15 presents the processed Palomar spectroscopy, revealing three broad-lined quasars at z ∼ 1.13; the system observed at Keck turns out to be a quasar twin at z ∼ 1.75 with a foreground interloper. Higher resolution X-ray imaging will be required to determine if the ROSAT emission detected in these systems is due to associated hot intracluster media, is due to emission from one (or more) of the quasars, or, least likely, is from unrelated sources.

Figure 14. Images of 2RXS J150158.6+691029 at optical wavelengths (Bj band, from POSS II; left) and mid-IR wavelengths (WISE W1 band; right). Images are ∼3' × 2 5, with north up and east to the left. Highlighted are the three WISE-selected AGN candidates within 36'' of the ROSAT source.
Download figure:
Standard image High-resolution image
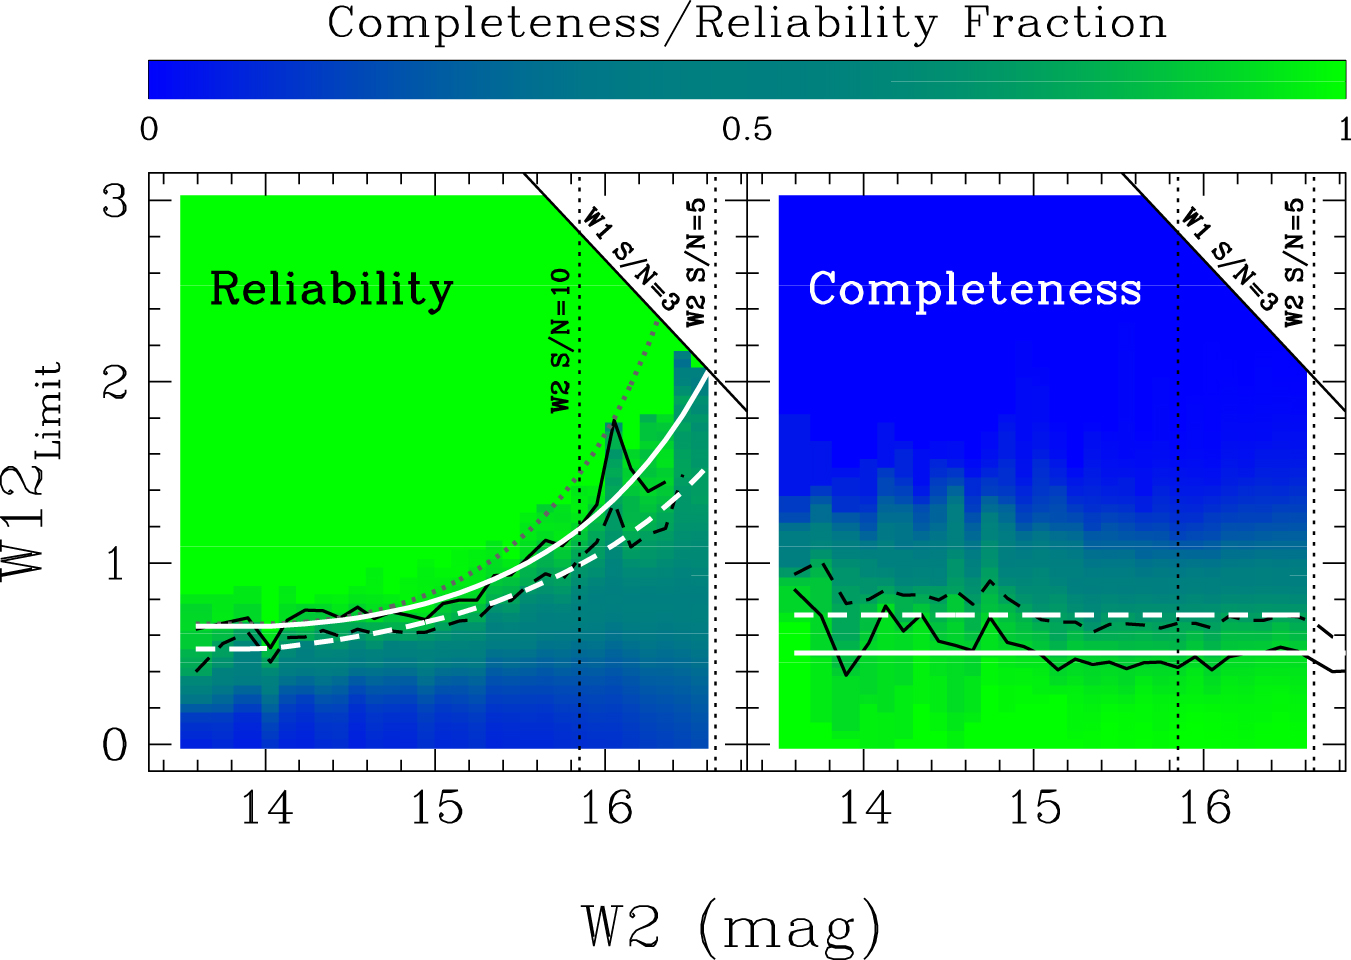
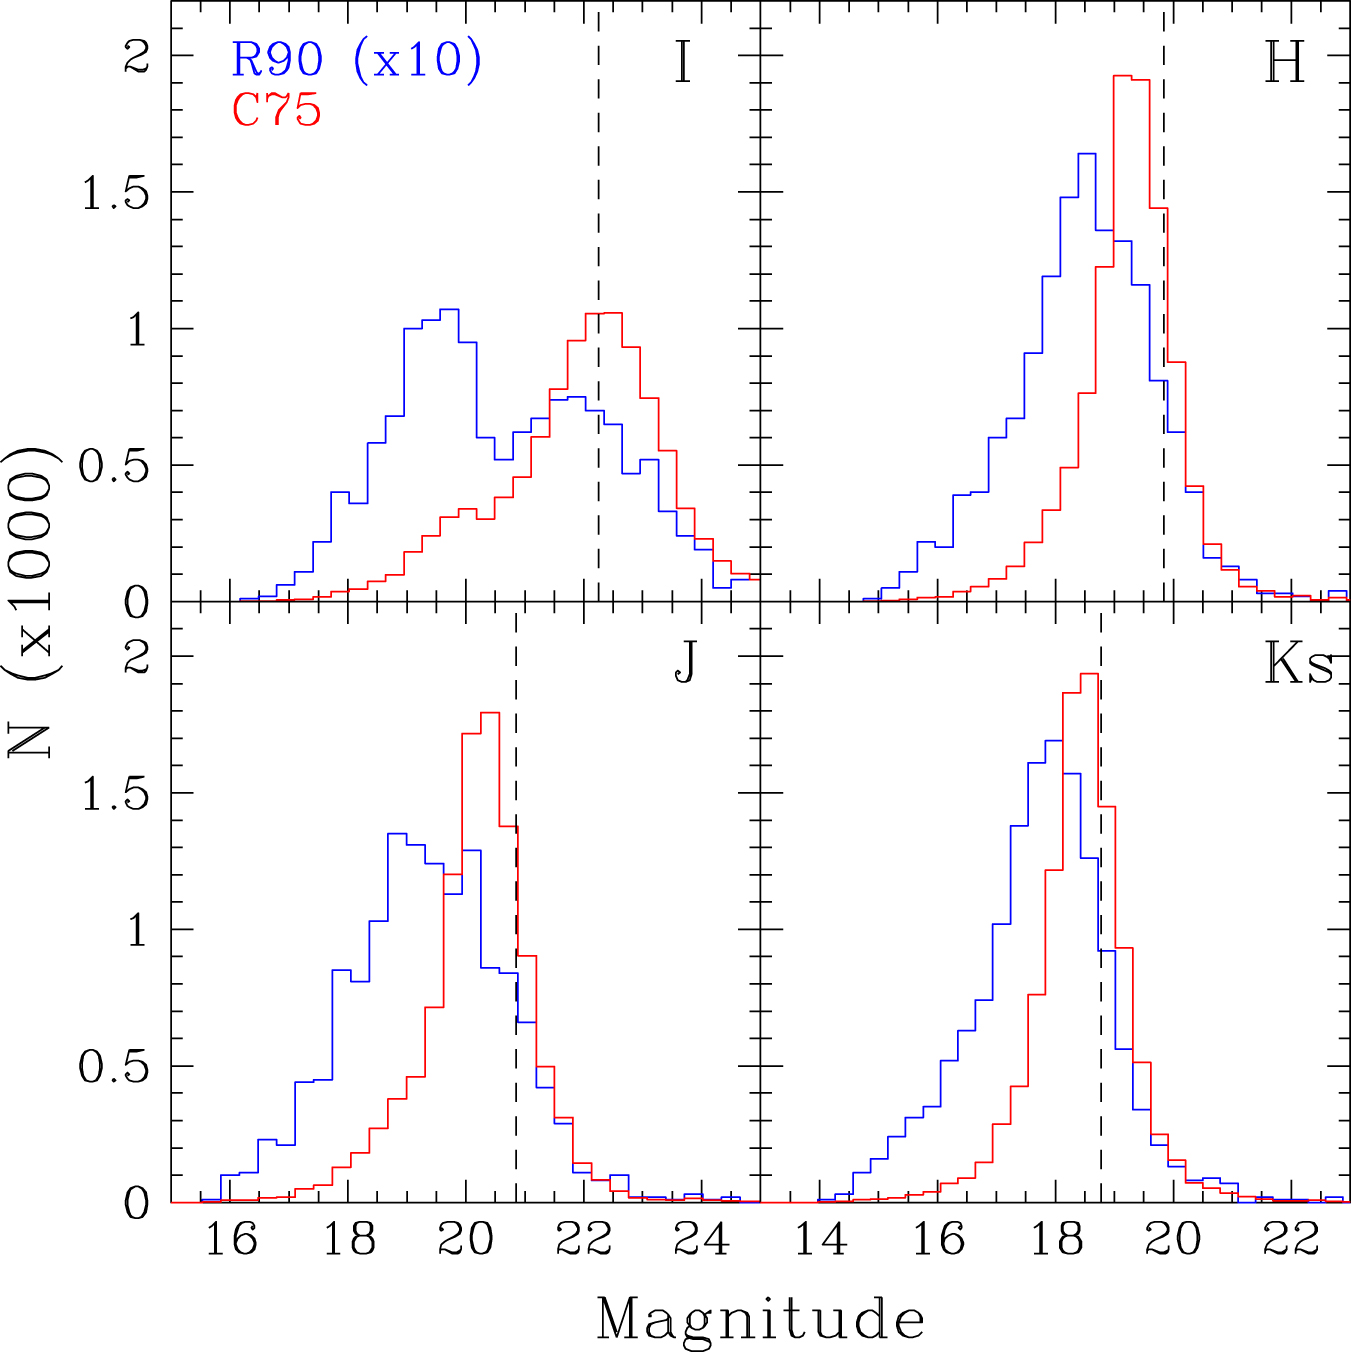
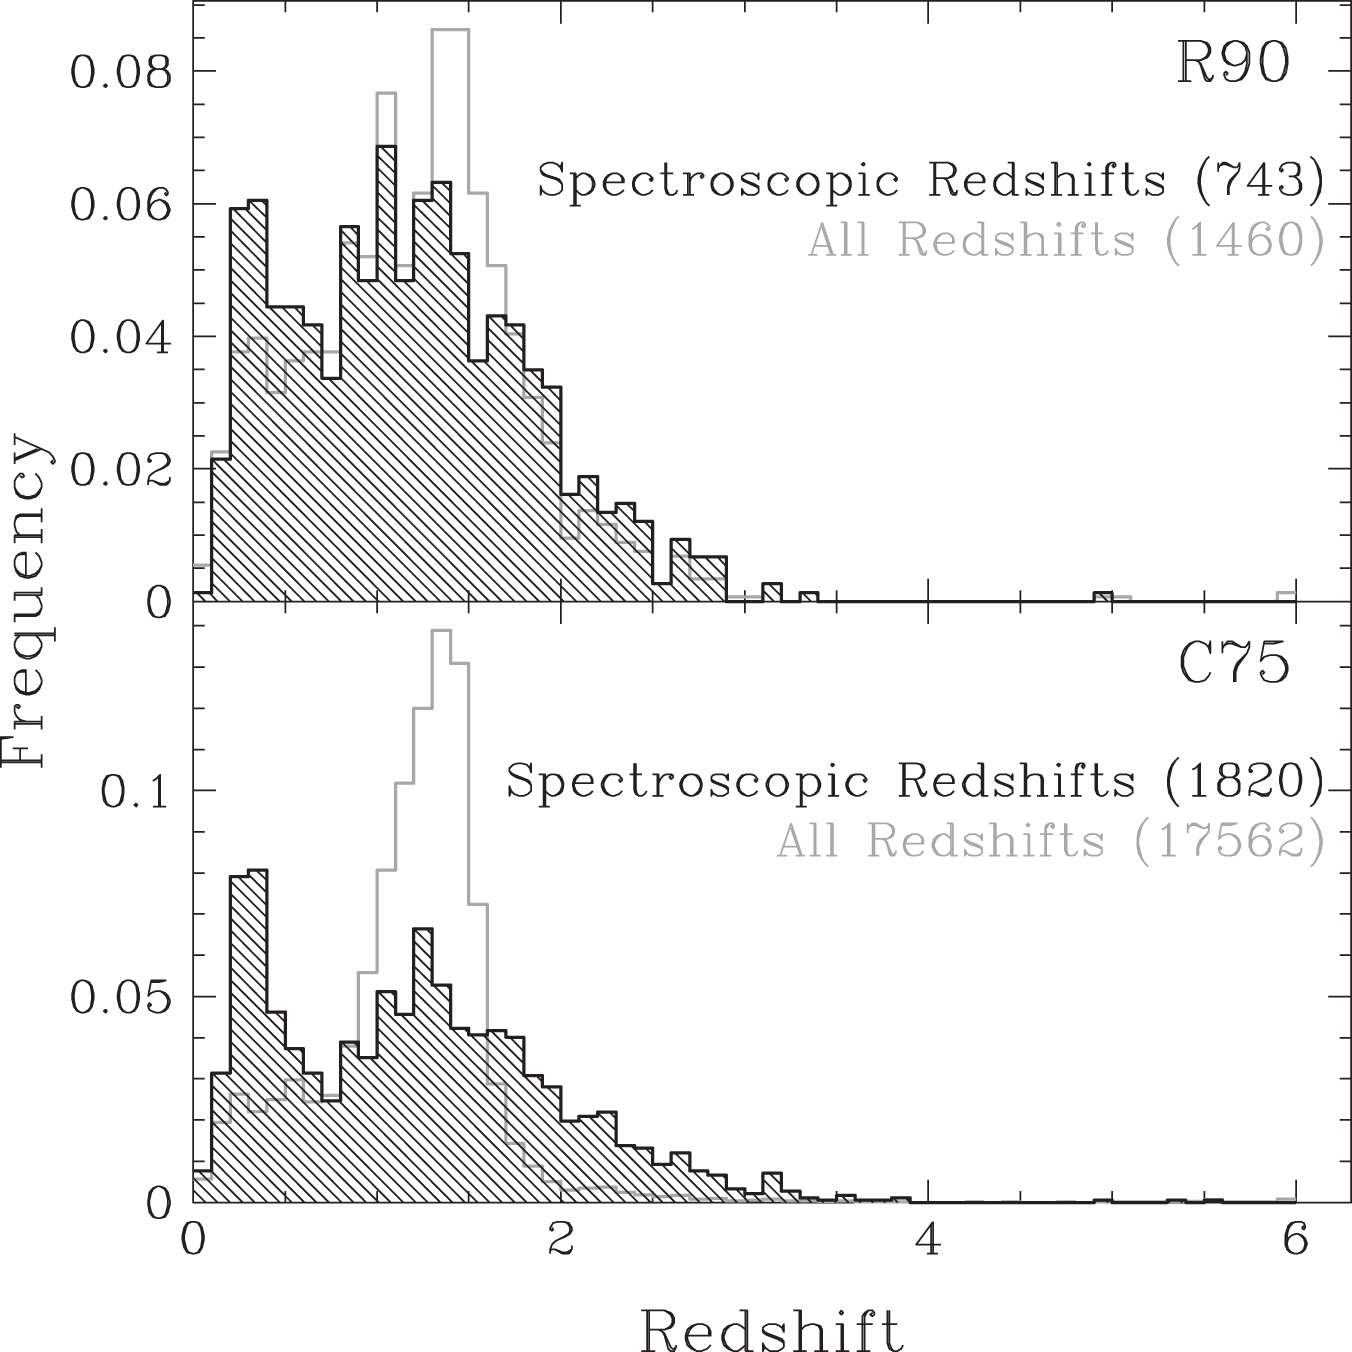
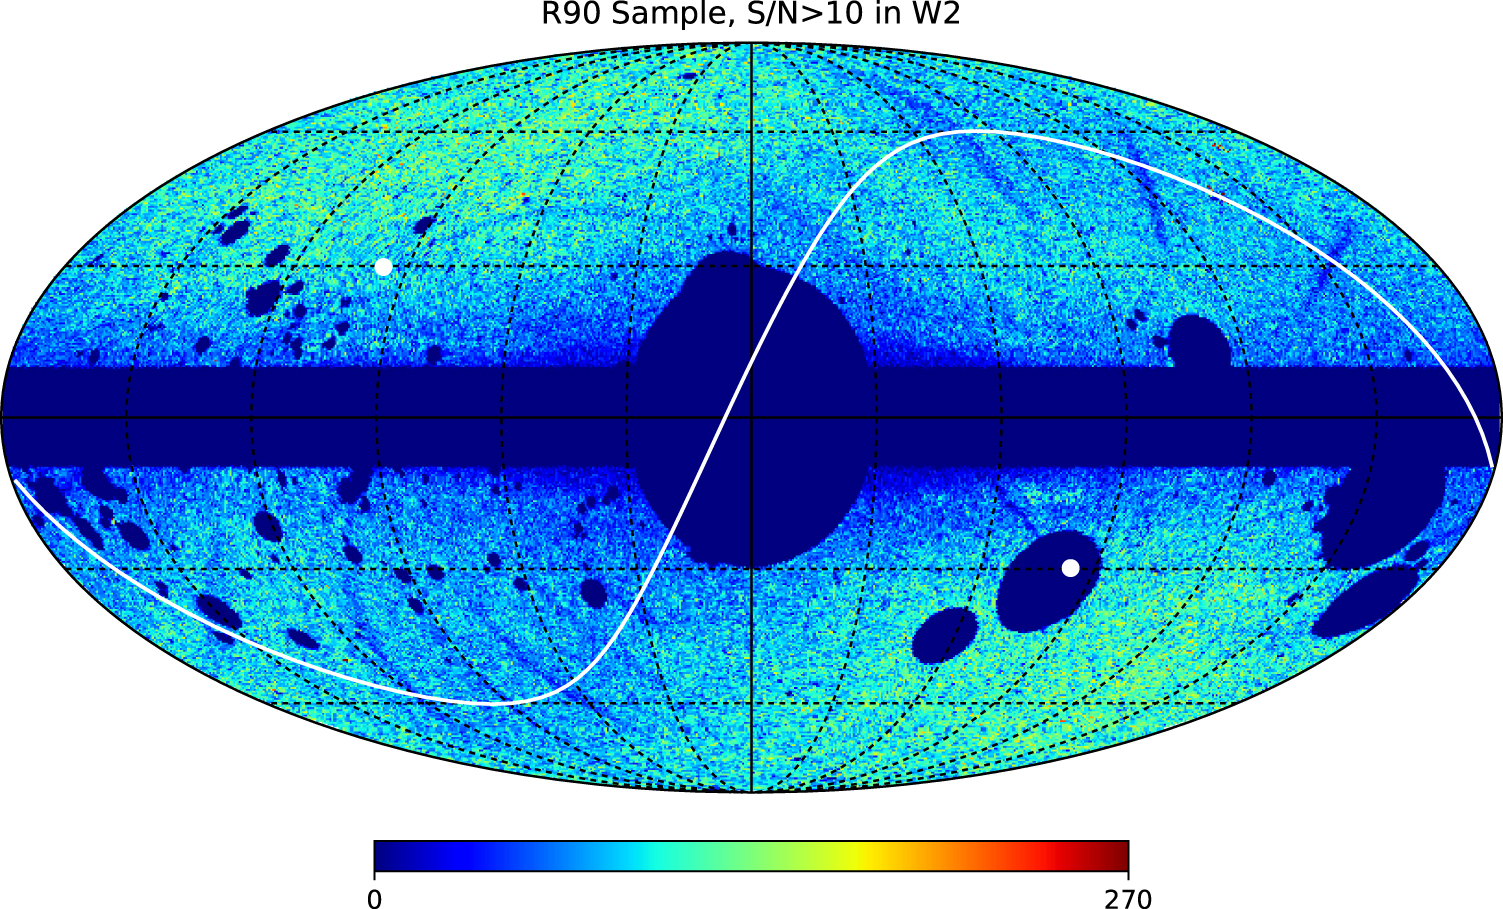
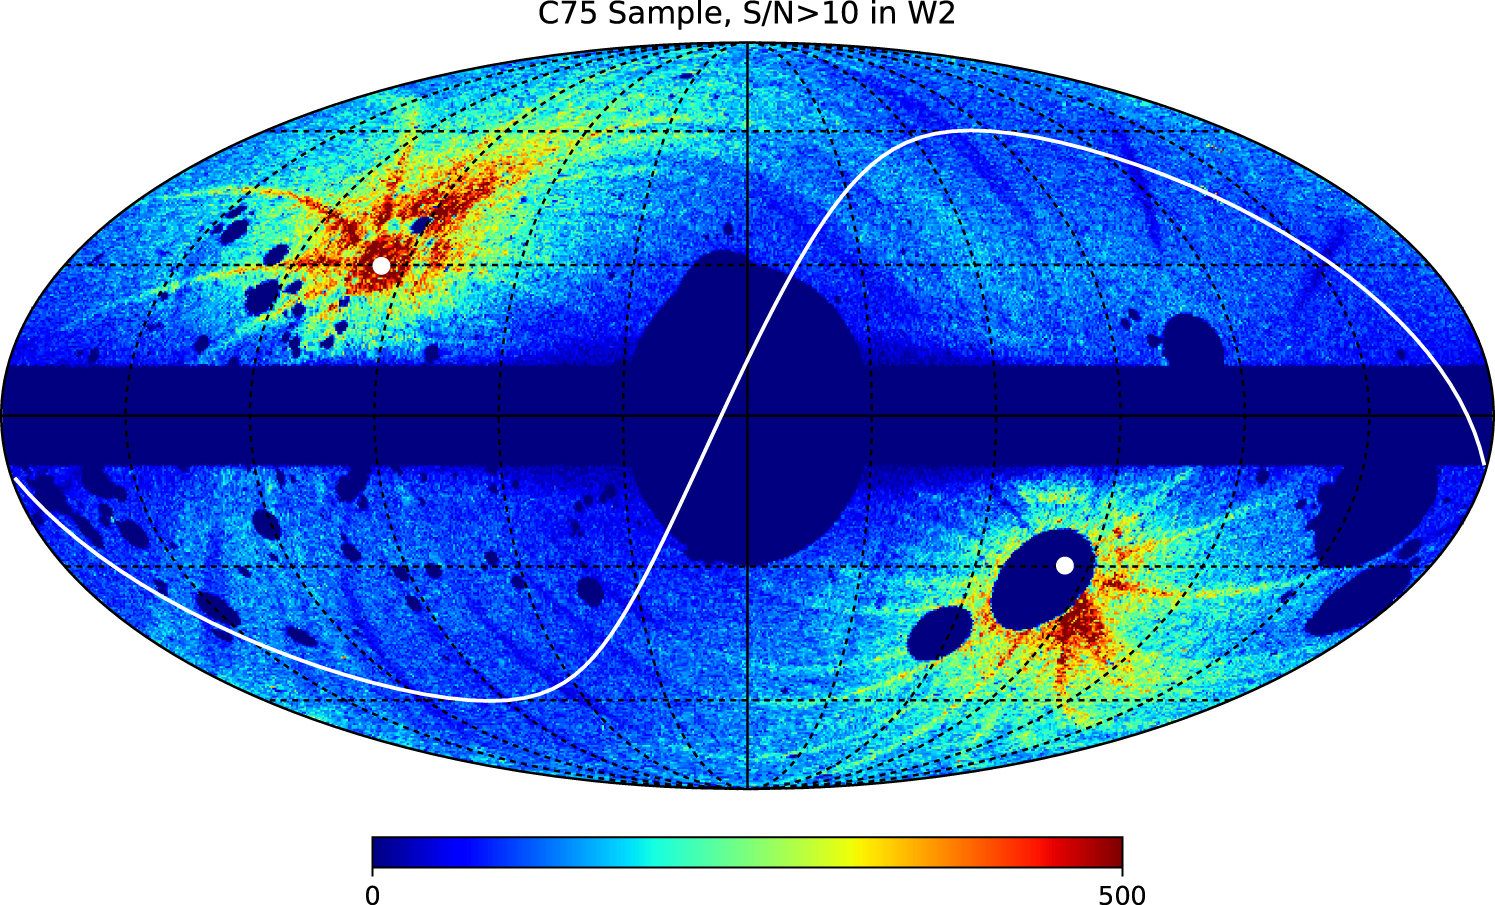
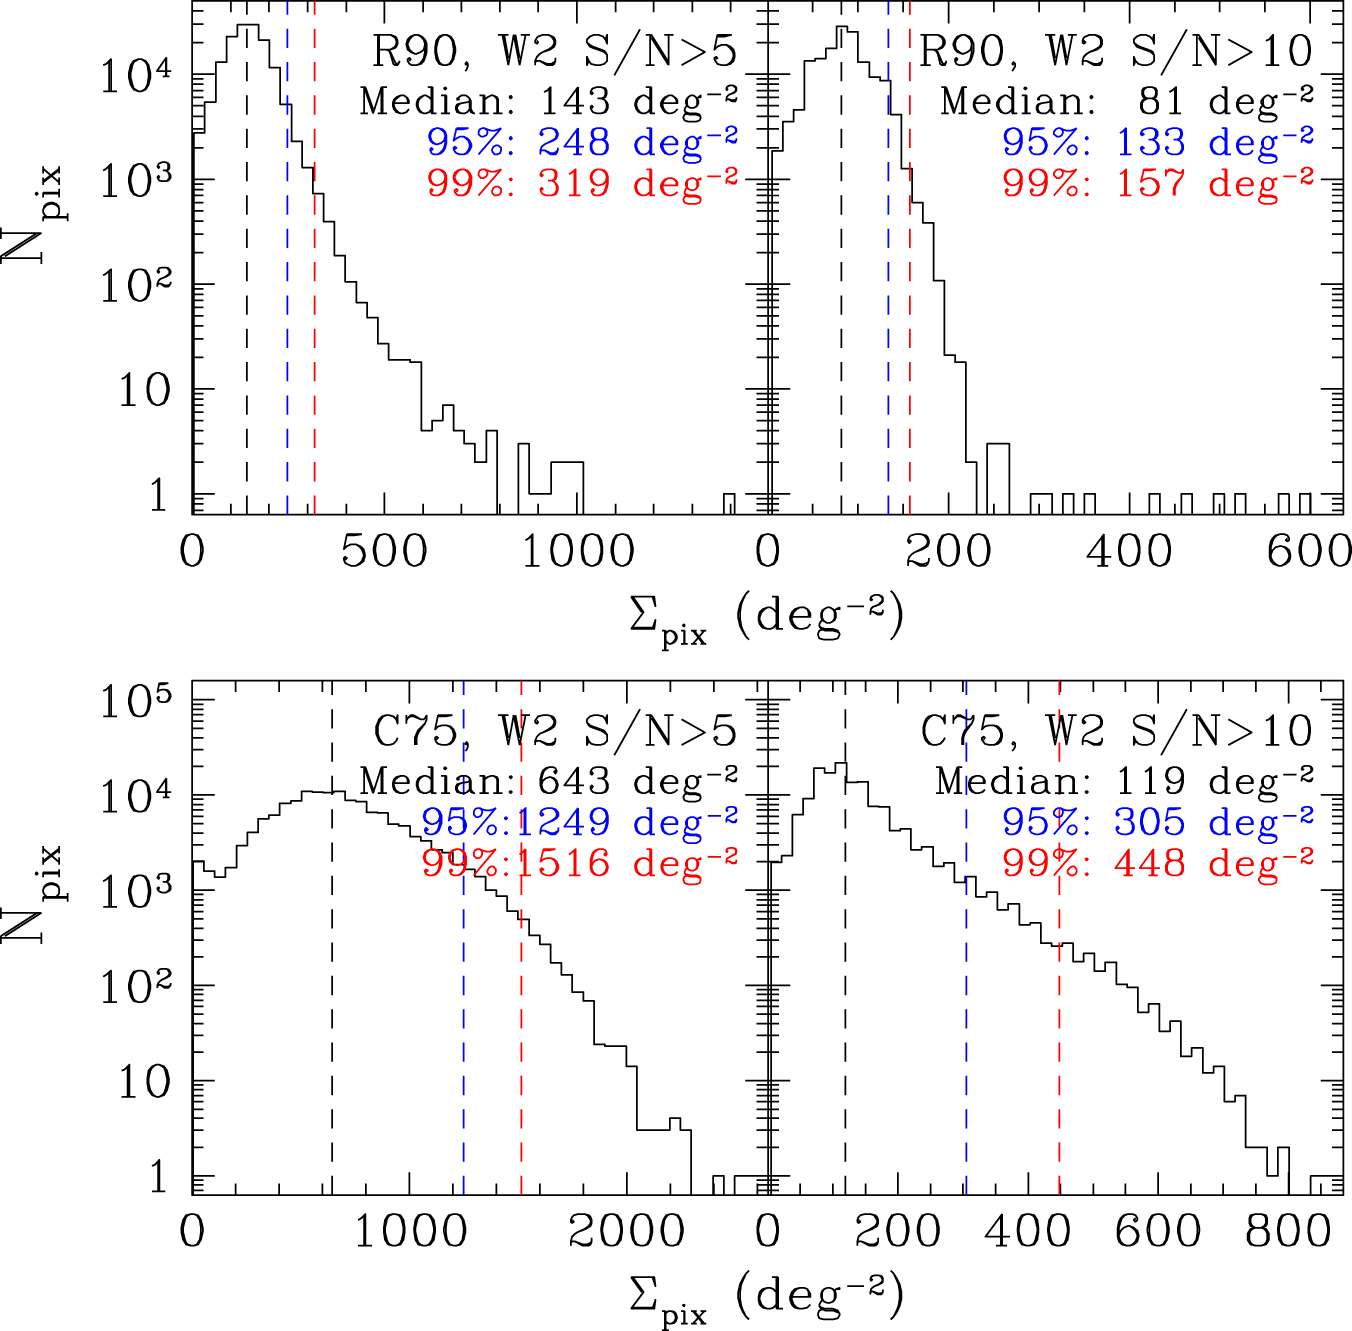
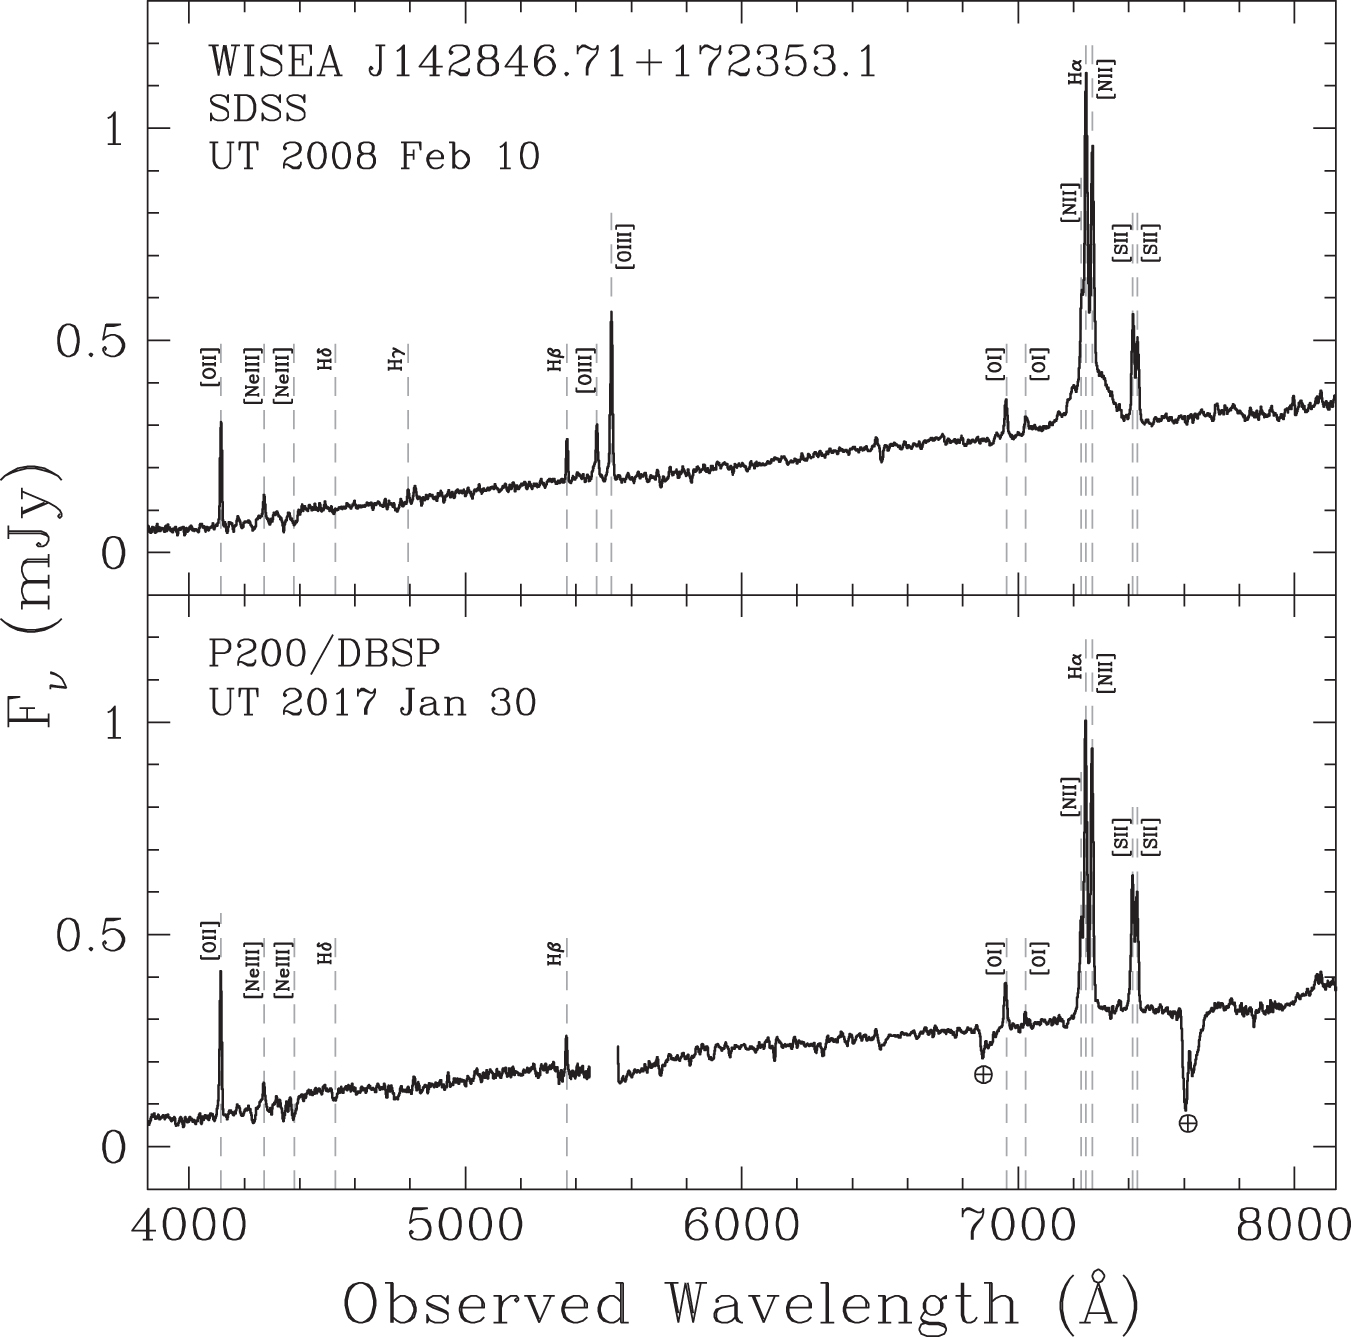
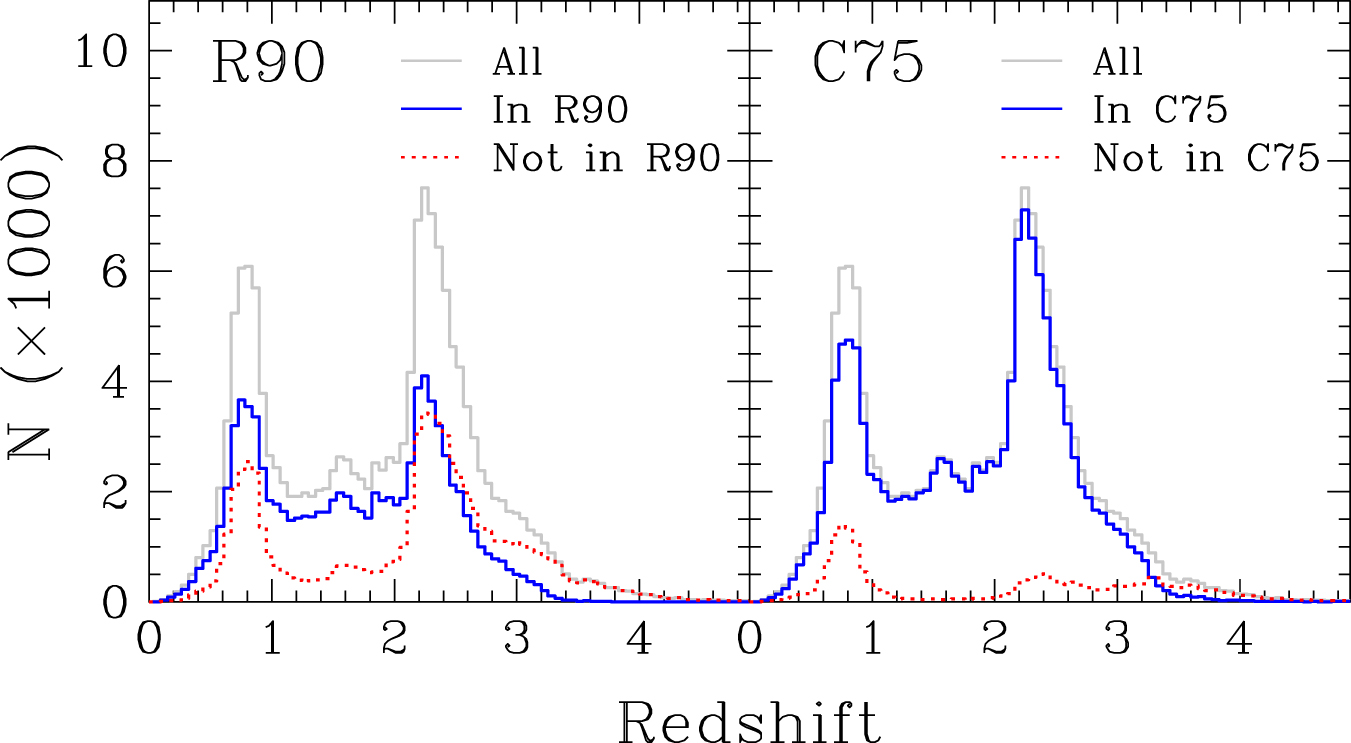
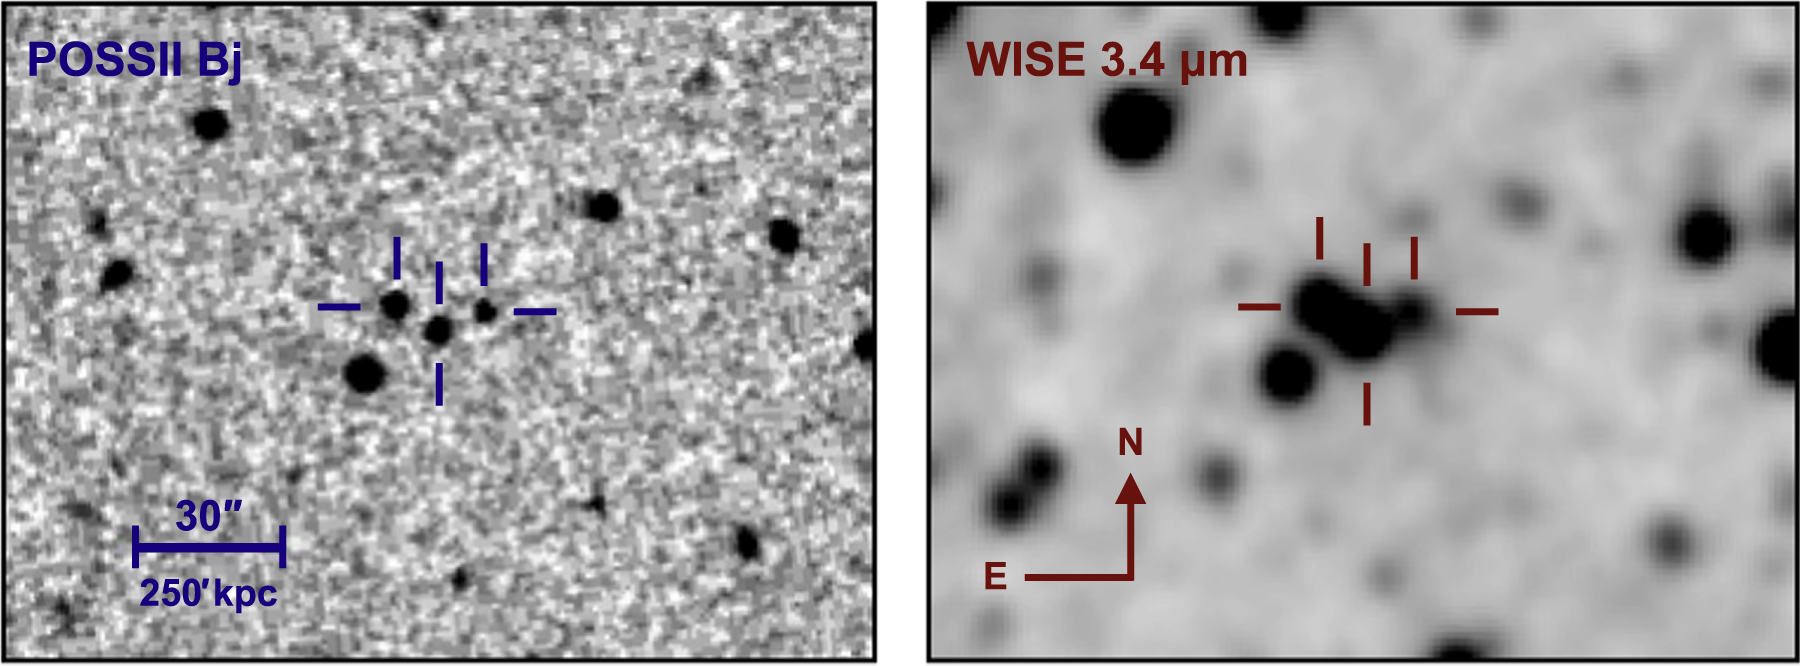
Figure 15. Optical spectra of the three WISE-selected AGN candidates associated with 2RXS J150158.6+691029 from Palomar Observatory. All three are broad-lined quasars at similar redshifts,  . Note that we have not corrected the spectra for telluric absorption.
Download figure:
Standard image High-resolution image
6. Summary and Conclusions
We have constructed large samples of robust AGN candidates across ∼75% of the sky selected solely from WISE observations. To select the AGN candidates, we followed the approach outlined by A13, using only the W1 and W2 bands to maximize the number of candidates. A13 proposed four selection criteria, two of which, referred to as R90 and R75, were optimized for reliability, producing AGN samples that were, respectively, 90% and 75% reliable. The other two, C90 and C75, were optimized for completeness, producing AGN samples that were, respectively, 90% and 75% complete. These criteria were calibrated for the data in the WISE All-Sky Data Release using a large sample of AGNs in the NDWFS Boötes field. In this work, we use the more recent AllWISE data release, which is not only deeper in W1 and W2 owing to the larger number of observations used, but also improved several issues related to the data reduction in the initial data release. Because of these differences, we recalibrated the selection criteria following the same approach as A13 and found significant differences for the optimal selection criteria. The reliability- and completeness-optimized criteria are presented in Equations (4) and (5), respectively. We also modified the functional form of the bright end of the reliability optimized selection criteria, as the criteria provided by A13 were only appropriate for the fainter end of the magnitude distribution.
We constructed two AGN catalogs, based on the R90 and C75 selection criteria, respectively. In order to avoid contamination by artifacts and by non-AGN sources in our Galaxy and in nearby galaxies, we eliminated from the final catalogs all sources that are (i) closer than 10° away from the GP and 30° from the GC, (ii) associated with known PNe, (iii) associated with known H ii and star-forming regions, and (iv) associated with nearby galaxies. The final R90 and C75 catalogs contain 4,543,530 and 20,907,127 AGN candidates over an area of 30,093 deg2, making them among the largest quasar catalogs available. Through visual inspection of the resulting catalog, we find that a small number of spurious sources are likely left due to artifacts related to the diffraction spikes of bright stars, residuals left by the solar system planets, and to regions near the SAA with high Moon contamination. We then present a few examples of scientific uses for these new AGN catalogs.
From the final R90 catalog, we identify 687 AGNs marked as highly variable sources in the AllWISE catalog. Focusing on the 207 of these sources that are within the FIRST survey footprint, we find that 162 (78%) are detected by FIRST, indicating that they are likely blazars. For the 45 remaining radio-undetected sources, we find that 32 have spectroscopic classifications in the literature and an additional one has a photometric redshift, and we present spectroscopic observations from the Palomar Observatory for two additional sources. Of these 35, 28 are classified as AGNs, four are classified as galaxies, and three are classified as stars. We find through visual inspection of the spectra of the four sources classified as galaxies that they likely host an AGN.
Additionally, for one of these sources with archival SDSS spectra, WISEA J142846.71+172353.1, we obtained a new epoch of spectroscopy. The source faded by ∼1 mag between the WISE and NEOWISE-R observations in both the W1 and W2 bands. The source is classified as a QSO by SDSS, with a clear broad component to the Hα emission line but only a narrow component to Hβ, implying an intermediate-type classification. The SDSS observations were obtained before the WISE data. In our new spectroscopic observations, obtained after the WISE observations, we find that the broad component of Hα has disappeared, and the object is now consistent with a type 2 classification.
We have carried out comparisons of our catalogs with other quasar catalogs in the literature. We first compare our R90 catalog with the also WISE-selected AGN catalog of Secrest et al. (2015), which was built using the Mateos et al. (2012) AGN selection criteria. Once we apply the same spatial filtering done for our catalogs (see Section 3.1) and the same requirements discussed in Section 3, we find that only 3.7% of the sources in their catalog are not in the R90 sample. Conversely, the R90 sample is approximately four times larger than the sample of Secrest et al. (2015). We also compare the R90 sample to the uXDQSOz catalog of DiPompeo et al. (2015) and find that we primarily recover sources with high  , consistent with the high reliability expected for the R90 sample. Additionally, we compare our AGN catalogs with the SDSS DR12 quasar catalog and find that the R90 sample recovers 30% of the sources in the SDSS quasar catalog and 57% of the sources with WISE counterparts that meet our quality criteria. The C75 sample, on the other hand, recovers 47% of the SDSS quasar sample and 87% of the sources with a WISE counterpart that meets our quality criteria.
Finally, we compare our R90 sample with the 2RXS catalog and find that the R90 sample is approximately 250 times larger and recovers the vast majority of the X-ray-detected AGNs in 2RXS. eROSITA, expected to launch in the next year on the Spectrum Röntgen Gamma satellite, will be approximately 10 times more sensitive than ROSAT in the 0.5–2 keV band and will provide the first sensitive, all-sky survey in the 2–10 keV band (Merloni et al. 2012). Stern et al. (2012) presents a detailed discussion of the expected comparison between eROSITA- and WISE-identified AGNs, where the latter is based on a simpler, less comprehensive selection than presented here. However, the general result is expected to be the same, with WISE and eROSITA both identifying most of the more luminous, less obscured quasars, while WISE will do better at identifying obscured AGNs and eROSITA will do better at identifying lower luminosity, unobscured AGNs (see Stern et al. 2012 for details). Returning to the ROSAT sample, we find that many of the 2RXS sources are matched to two or more sources in the R90 catalog, which could be a promising sample for identifying distant ( ) X-ray-emitting clusters. Applying a conservative filtering to eliminate the possibility of artifacts associated with the Moon contamination near the SAA latitudes (see Section 3.3.2) in these multiple matches, we find four 2RXS sources, each with three sources in the R90 sample within 30''. We present spectra of two of these triple systems. One of these, 2RXS J150158.6+691029, shows that all three sources are quasars at z ∼ 1.13, suggestive of a group or proto-cluster at moderately high redshifts.
We are currently conducting follow-up observations of a number of interesting sources within the catalog. For example, R. J. Assef et al. (2017, in preparation) expands upon the analysis of radio-undetected AGNs in the R90 sample identified as highly variable in the AllWISE catalog. By 2019, we anticipate that an all-sky WISE-selected catalog deeper than AllWISE will become available, based on images combining data from WISE and NEOWISE-R, from which larger AGN catalogs may be derived. We expect that the R90 and C75 WISE AGN catalogs will constitute a useful tool for the astronomical community and be of use in a broad range of applications.
We thank Mislav Baloković Felix Fürst, Brian Greffenstette, Nikita Kamraj, George Lansbury, Sean Pike, and Yanjun Xu for assisting with the Palomar and Keck observations. We also thank Murray Brightman, Matthew Graham, Christopher S. Kochanek, and George Djorgovski for helpful discussions that helped improve the paper. We also thank the anonymous referee for useful comments and suggestions. Some of the results in this paper have been derived using the HEALPix (Górski et al. 2005) package. R.J.A. was supported by FONDECYT grant number 1151408. H.J. is supported by the Basic Science Research Program through the National Research Foundation of Korea (NRF) funded by the Ministry of Education (NRF-2017R1A6A3A04005158). This research has made use of the NASA/IPAC Infrared Science Archive, which is operated by the Jet Propulsion Laboratory, California Institute of Technology, under contract with the National Aeronautics and Space Administration. This publication makes use of data products from the Wide-field Infrared Survey Explorer, which is a joint project of the University of California, Los Angeles, and the Jet Propulsion Laboratory/California Institute of Technology, and NEOWISE, which is a project of the Jet Propulsion Laboratory/California Institute of Technology. WISE and NEOWISE are funded by the National Aeronautics and Space Administration.
Appendix: AGN Catalog for Extended Sources
The AGN catalogs constructed in Section 3 only consider point sources from the AllWISE catalog. This is done because the profile-fit photometry is optimized for point sources and is affected by sets of systematics different from those for the aperture photometry. As profile-fit measurements are the most robust for the majority of the objects in AllWISE, it is reasonable for the construction of the main catalogs to disregard extended sources. However, AGNs in WISE extended sources are interesting on their own for a number of reasons. They are more likely to have higher host contamination and hence are more likely to span lower Eddington ratios. Furthermore, dual AGNs could potentially appear as extended WISE sources if the separation of the nuclei is comparable to the PSF size.
In this appendix, we provide catalogs of AGNs identified in extended sources using the same two selection criteria utilized for the point-source AGN catalogs, namely R90 and C75 (see Section 2). We construct these catalogs using almost the same requirements on the WISE data as detailed in Section 3, except that we exchange the point-source requirement for a requirement that sources are flagged as extended sources, and we do not filter out objects associated with 2MASS XSC sources to not remove real, extended AGNs from the sample. In other words, we only consider sources with  in W2, classified as extended sources, not flagged as either artifacts or affected by artifacts, and that pass all the spatial filters of Section 3.1 except for the excising of 2MASS XSC sources. The AllWISE Explanatory Supplement20
mentions that W1 images taken during the early part of the three-band Cryo survey phase show a number of hard saturated pixels caused by the rising temperatures. Although the flux measurements are usually accurate, the reduced
in W2, classified as extended sources, not flagged as either artifacts or affected by artifacts, and that pass all the spatial filters of Section 3.1 except for the excising of 2MASS XSC sources. The AllWISE Explanatory Supplement20
mentions that W1 images taken during the early part of the three-band Cryo survey phase show a number of hard saturated pixels caused by the rising temperatures. Although the flux measurements are usually accurate, the reduced  of the profile fit in the W1 band can be exceedingly large, leading to a spurious extended source identification. Following the suggestion in the AllWISE Explanatory Supplement, we eliminate all sources that have saturated pixels but a W1 profile-fitting magnitude fainter than the saturation limit (i.e., W1 > 8) as well as sources where the ph_qual flag for the W1 band is equal to Z.
Despite the fact that the sources are extended to WISE, we apply the R90 and C75 selection criteria using the profile-fitting magnitudes. While the aperture magnitudes would provide a more accurate measurement of the whole flux, the profile-fitting magnitudes provide the better discrimination for AGN selection. In sources where the W1 and W2 profiles are centrally concentrated, the profile-fitting magnitudes provide a better representation of the central flux. In sources where the extended regions are a more dominant fraction of the total flux in these bands, the profile-fitting magnitudes will provide a color more representative of the host galaxy, and hence these sources will not meet our selection criteria, lowering the completeness but without an effect on the reliability. However, we caution that the completeness and reliability estimates for our criteria were done for point sources only and hence may not be accurate for these extended catalogs. Furthermore, we have not done as careful a control for artifacts, which might be different for the extended samples.
We find that 20,645 and 26,331 extended sources are selected as AGNs by the R90 and C75 criteria, respectively. These sources are provided in Tables 7 and 8.
Table 7. R90 Catalog of Extended Sources
| WISE ID | R.A. | Decl. | W1 | σ(W1) | W2 | σ(W2) | W3 | σ(W3) | W4 | σ(W4) | Moon–SAA Flag |
|---|---|---|---|---|---|---|---|---|---|---|---|
| (WISEA) | (deg) | (deg) | (mag) | (mag) | (mag) | (mag) | (mag) | (mag) | (mag) | (mag) | |
| J000005.02+085706.6 | 0.0209340 | 8.9518348 | 14.745 | 0.032 | 13.894 | 0.040 | 11.406 | 0.193 | 8.506 | 0.370 | 0 |
| J000009.53–455127.8 | 0.0397123 | –45.8577390 | 14.312 | 0.027 | 13.338 | 0.030 | 10.573 | 0.095 | 7.968 | 0.217 | 0 |
| J000011.06+052307.7 | 0.0460950 | 5.3854886 | 14.443 | 0.029 | 13.743 | 0.038 | 10.588 | 0.097 | 7.254 | 0.125 | 0 |
| J000020.23+221358.5 | 0.0843316 | 22.2329366 | 18.524 | ⋯ | 15.972 | 0.190 | 12.154 | ⋯ | 8.732 | ⋯ | 0 |
| J000021.94+323159.5 | 0.0914206 | 32.5332050 | 16.325 | 0.066 | 14.996 | 0.074 | 11.879 | 0.237 | 9.035 | 0.534 | 0 |
| J000024.71–523254.8 | 0.1029903 | –52.5485593 | 15.092 | 0.101 | 14.357 | 0.095 | 11.591 | ⋯ | 8.573 | ⋯ | 0 |
| J000027.12+050511.5 | 0.1130353 | 5.0865358 | 15.410 | 0.123 | 14.245 | 0.108 | 11.339 | ⋯ | 8.714 | ⋯ | 0 |
| J000045.12–380735.3 | 0.1880166 | –38.1264753 | 15.568 | 0.040 | 14.272 | 0.044 | 10.703 | 0.087 | 8.725 | 0.305 | 0 |
| J000051.46–380145.8 | 0.2144444 | –38.0293889 | 14.986 | 0.034 | 13.734 | 0.032 | 10.158 | 0.054 | 7.644 | 0.138 | 0 |
| J000058.83–245451.2 | 0.2451389 | –24.9142450 | 14.923 | 0.035 | 14.217 | 0.047 | 11.754 | 0.222 | 8.811 | 0.442 | 0 |
Note. The magnitudes and errors shown correspond to the profile-fitting measurements in the AllWISE catalog. Undetected sources in a given band lack a magnitude uncertainty measurement, and the magnitude column shows a 95% confidence upper bound.
(This table is available in its entirety in FITS format.)Download table as: ASCIITypeset image
Table 8. C75 Catalog of Extended Sources
| WISE ID | R.A. | Decl. | W1 | σ(W1) | W2 | σ(W2) | W3 | σ(W3) | W4 | σ(W4) | Moon–SAA Flag |
|---|---|---|---|---|---|---|---|---|---|---|---|
| (WISEA) | (deg) | (deg) | (mag) | (mag) | (mag) | (mag) | (mag) | (mag) | (mag) | (mag) | |
| J000005.02+085706.6 | 0.0209340 | 8.9518348 | 14.745 | 0.032 | 13.894 | 0.040 | 11.406 | 0.193 | 8.506 | 0.370 | 0 |
| J000009.53–455127.8 | 0.0397123 | –45.8577390 | 14.312 | 0.027 | 13.338 | 0.030 | 10.573 | 0.095 | 7.968 | 0.217 | 0 |
| J000020.23+221358.5 | 0.0843316 | 22.2329366 | 18.524 | ⋯ | 15.972 | 0.190 | 12.154 | ⋯ | 8.732 | ⋯ | 0 |
| J000021.94+323159.5 | 0.0914206 | 32.5332050 | 16.325 | 0.066 | 14.996 | 0.074 | 11.879 | 0.237 | 9.035 | 0.534 | 0 |
| J000024.71–523254.8 | 0.1029903 | –52.5485593 | 15.092 | 0.101 | 14.357 | 0.095 | 11.591 | ⋯ | 8.573 | ⋯ | 0 |
| J000025.30–400339.3 | 0.1054477 | –40.0609388 | 16.724 | 0.089 | 15.766 | 0.136 | 9.776 | 0.067 | 6.116 | 0.063 | 0 |
| J000027.12+050511.5 | 0.1130353 | 5.0865358 | 15.410 | 0.123 | 14.245 | 0.108 | 11.339 | ⋯ | 8.714 | ⋯ | 0 |
| J000045.12–380735.3 | 0.1880166 | –38.1264753 | 15.568 | 0.040 | 14.272 | 0.044 | 10.703 | 0.087 | 8.725 | 0.305 | 0 |
| J000047.52+274212.5 | 0.1980083 | 27.7034994 | 16.254 | 0.056 | 15.498 | 0.114 | 12.521 | ⋯ | 8.671 | ⋯ | 0 |
| J000051.46–380145.8 | 0.2144444 | –38.0293889 | 14.986 | 0.034 | 13.734 | 0.032 | 10.158 | 0.054 | 7.644 | 0.138 | 0 |
Note. The magnitudes and errors shown correspond to the profile-fitting measurements in the AllWISE catalog. Undetected sources in a given band lack a magnitude uncertainty measurement, and the magnitude column shows a 95% confidence upper bound.
(This table is available in its entirety in FITS format.)Download table as: ASCIITypeset image
Footnotes
- 6
- 7
- 8
- 9
- 10
- 11
The catalog used was downloaded on 2015 December 28 from http://astro.phys.wvu.edu/wise/.
- 12
The LVG catalog was retrieved on 2015 December 29 from https://www.sao.ru/lv/lvgdb/.
- 13
http://healpix.sf.net. HEALPix functions were used through the healpy v1.9.1 package.
- 14
- 15
- 16
- 17
- 18
- 19
Available at http://www.star.bristol.ac.uk/~mbt/topcat/.
- 20