


Abstract
The International Celestial Reference Frame (ICRF) based on the VLBI-derived positions of 608 extragalactic radio sources was adopted by the International Astronomical Union (IAU) in 1998 as the first realization of the International Celestial Reference System (ICRS). Later, in 2009 and 2020, two extended ICRF versions, ICRF2 and ICRF3, respectively, were released. The latter is adopted by the IAU as the current implementation of the ICRF in the radio band. In the meantime, the Gaia mission delivered three versions of the optical ICRS realization in 2016, 2018, and 2022 with an accuracy similar to that achieved by VLBI-based ICRF. The Gaia-CRF catalogs were linked to the ICRF under no-rotation conditions and thus may suffer from ICRF systematic instability if the latter is substantial. In this work, a new analysis was performed to assess the long-term stability of radio and optical ICRS realizations. Based on the 16-parameter vector spherical harmonics expansion of the differences between the three ICRF catalogs, it can be concluded that the mutual orientation between them is at a level of a few tens of microarcseconds, while the components of the glide vector and E2,0 term are several times greater. A comparison of the three Gaia-CRF catalogs with the ICRF3-SX showed that for the latest Gaia-CRF catalog, Gaia-CRF3, all rotational and deformation components are below 20 μas except for the E2,0 term, which is several times greater. For both ICRF and Gaia-CRF catalogs, the evolution of the source position errors is also tracked.
Export citation and abstract BibTeX RIS

Original content from this work may be used under the terms of the Creative Commons Attribution 4.0 licence. Any further distribution of this work must maintain attribution to the author(s) and the title of the work, journal citation and DOI.
1. Introduction
In 1997, the International Astronomical Union (IAU) at its XXIIIrd General Assembly adopted Resolution B2, 1 which resolved that from 1998 January 1, the IAU celestial reference system shall be the International Celestial Reference System (ICRS; Arias et al. (1995), and that the corresponding fundamental reference frame shall be the International Celestial Reference Frame (ICRF). The first ICRF catalog (Ma et al. 1998) consisted of the positions of 608 radio sources obtained from VLBI observations.
In 2009, the IAU XXVIIth General Assembly adopted Resolution B3, 2 which resolved that from 2010 January 1 the ICRS realization shall be the Second Realization of the International Celestial Reference Frame (ICRF2). The ICRF2 catalog (Fey et al. 2015), contained the positions of 3414 sources, of which 138 sources were used to link ICRF2 to ICRF.
The latest third ICRF release, ICRF3 (Charlot et al. 2020), was adopted as a new ICRS realization from 2019 January 1 by Resolution B2 3 of the IAU XXXth General Assembly. ICRF3 consists of three catalogs for different wave bands: ICRF3-SX (4536 sources), ICRF3-K (824 sources), and ICRF3-XKa (678 sources) with positions related to the X, K, and Ka bands, respectively. In addition, the ICRF3 catalog is the first ICRS realization for which the effect of the Galactic aberration (GA) in source apparent motions was modeled, see Section 2.4 for details. The ICRF3-SX catalog is considered as the primary radio ICRF realization, and it has been linked to the previous ICRF catalog, ICRF2, using 295 sources. In turn, ICRF3-K and ICRF3-XKa catalogs were aligned to the ICRF3-SX catalog to provide the consistency between three ICRF3 frames constructed for the three radio wave bands.
From the above, it is clear that the ICRF—ICRF2—ICRF-SX link is not perfect because of several reasons: different sets of sources were used for link between them, the effect of the GA was not taken into account in the ICRF and ICRF2 analysis, and the impact of the higher-degree frame deformation may impact the results of the alignment.
In the meantime, three optical ICRS realizations were provided by the Gaia mission in 2016 (Gaia-CRF1; Mignard et al. 2016), 2018 (Gaia-CRF2; Gaia Collaboration et al. 2018), and 2022 (Gaia-CRF3; Gaia Collaboration et al. 2022) with the source position uncertainties similar to that of ICRF (for Gaia counterparts of ICRF sources, see Tables 2 and 3 below). The latter catalog was adopted as a new optical ICRS realization from 2022 January 1 by Resolution B3. 4 To provide the orientation of the Gaia-CRF catalogs with respect to the ICRS, they were aligned to the latest ICRF realizations available at the epoch of computation, namely ICRF2 for Gaia-CRF1 (2191 common sources), ICRF3-SX prototype for Gaia-CRF2 (2820 common sources), and final ICRF3-SX for Gaia-CRF3 (3142 common sources). One can see that in this case the alignment procedure for different ICRS realizations is not uniform either. Although the first two Gaia-CRF catalogs were not official IAU frames, they are also considered in this work for completeness of the analysis.
To summarize the above discussion, Figure 1 presents the history of the dissemination of the ICRS to its different implementations at radio and optical wave bands. The primary purpose of this study is to examine how well the ICRS is transferred and maintained over time in IAU-approved implementations.
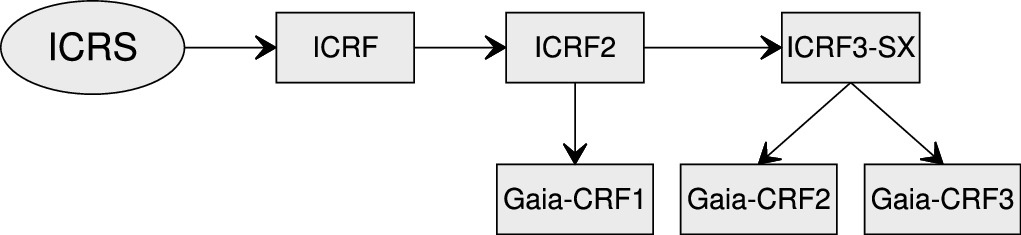
Figure 1. Transferring the ICRS to sequential radio (ICRF) and optical (Gaia-CRF) reference frames.
Download figure:
Standard image High-resolution imageThe paper is organized as follows. Section 2 describes the data and methods used, Section 3 is devoted to analysis of ICRF catalogs, Section 4 is devoted to the analysis of the Gaia-CRF catalogs, and the last Section sums up the results obtained in this work.
2. Data and Analysis Methods
2.1. Overview of the Analyzed Catalogs
Table 1 presents the statistics of the catalogs used in this study. It includes the number of sources Nsou and observation epochs. The ICRF catalogs include the mean observed epoch for each source. In the Table, Tfirst is the minimum of the mean epochs, Tlast is the maximum of the mean epochs, and Tmed is the median mean epoch for all sources in a given catalog. It can be seen that the observation epoch difference between ICRF catalogs is large enough, which makes it important to account for the GA effect for comparison of the catalogs. It should be noted that the source positions in the ICRF and ICRF2 catalogs are assumed to be referred to the mean observed epoch for each source, and the source positions in the ICRF3 catalog are referred to epoch 2015.0 by accounting for the GA.
Table 1. General Information on the Catalogs Used in This Work
| Catalog | Nsou | Tfirst | Tlast | Tmed |
|---|---|---|---|---|
| ICRF | 608 | 1982.35 | 1995.47 | 1992.66 |
| ICRF2 | 3414 | 1987.56 | 2008.96 | 2002.23 |
| ICRF3-SX | 4536 | 1988.08 | 2018.23 | 2014.01 |
| Gaia-CRF1 | 2982 | 2015.00 | 2015.00 | 2015.00 |
| Gaia-CRF2 | 3376 | 2015.50 | 2015.50 | 2015.50 |
| Gaia-CRF3 | 3485 | 2016.00 | 2016.00 | 2016.00 |
Note. See text for detail.
Download table as: ASCIITypeset image
For Gaia-CRF catalogs, observation epochs are supposed to be the same for all sources. The number of sources in these catalogs given in Table 1 is the number of sources in common between the Gaia-CRF catalogs and ICRF3-SX catalog. It should be emphasized that the number of sources given in the Table relates only to subsets of Gaia-CRF catalogs used for comparison with radio ICRF catalogs. These subsets includes sources in common with ICRF3-SX catalog. The full Gaia astrometric solutions include about 135,000 AGN-like sources in Gaia-CRF1 (Mignard et al. 2016), about 560,000 AGN-like sources in Gaia-CRF2 (Gaia Collaboration et al. 2018), and 1.6 million AGN-like sources in Gaia-CRF3 (Gaia Collaboration et al. 2022).
2.2. Representation of the Mutual Orientation
The vector spherical harmonics (VSH) technique has mostly been used in recent years for analysis of the systematic differences between catalogs of optical and radio source positions and stellar kinematics, see, e.g., Vityazev & Shuksto (2004), Makarov & Murphy (2007), Vityazev & Tsvetkov (2011), Mignard & Klioner (2012), and Makarov et al. (2019). In this paper, the 16-parameter VSH expansion (i.e., up to degree l=2) is accepted following the analysis method used for deriving ICRF3 (Charlot et al. 2020) as well as in many other recent papers, e.g., Liu et al. (2018), Karbon & Nothnagel (2019), Liu et al. (2020), and Mayer & Böhm (2023).
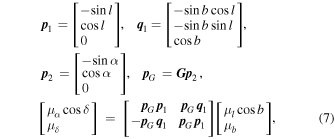
Orientation parameters between catalogs are derived from the VSH decomposition defined by the following expressions (Mignard & Klioner 2012):
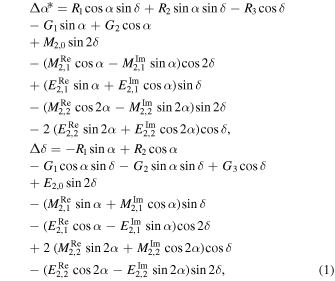
where Δα and Δδ are the coordinate differences between the source positions in two compared catalogs,  ,
R
(R1, R2, R3) is the rotation vector, and
G
(G1, G2, G3) is the glide vector.
,
R
(R1, R2, R3) is the rotation vector, and
G
(G1, G2, G3) is the glide vector.
It should be noted that the results of the computation of the coefficients of VSH expansion may substantially depend on the correlations between the source positions in the compared catalogs. It was first shown by Jacobs et al. (2010) that accounting for the full covariance matrices of compared catalogs substantially affects the results of determination of the parameters of their mutual orientation. This result was confirmed by Sokolova & Malkin (2016), however it was shown that this effect is manifested only in the case of using the full catalog covariance matrices including intersource position correlations. Unfortunately, both ICRF and Gaia-CRF catalogs are published without full covariance matrices, and only intrasource correlations between right accession and decl. for each source are included in published catalogs. Therefore, although the author's program for calculating VSH coefficients by least squares is designed to use the full covariance matrix of the input catalogs, the actual calculations used only a bidiagonal matrix including source position errors and intrasource covariances.
2.3. Handling Outliers
Different authors have applied different methods to detect and eliminate outliers. An overview and comparison of these methods can be found in Malkin (2021), Frouard (2023), and Lambert & Malkin (2023). The results of these works showed that different methods are practically equivalent and provide close results. For the sake of uniformity and to follow the methods used for derivation of the radio ICRF and Gaia-CRF catalogs, the traditional LS approach was used in this study with rejecting outliers using a tolerance on the angular separation of source positions in the compared catalogs together with an additional tolerance on the source position error.
The following quantities can be considered to detect outliers: the angular separation D between the source positions in two catalogs, the normalized separation X, and the error in the source position difference.
The angular separation and its uncertainty were computed as
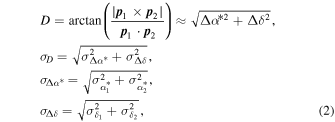
where α1, α2, δ1, δ2 are the source coordinates in two catalogs,  are the coordinate errors given in the catalogs, and
  , Δδ = δ1 − δ2,
  ,
,  ,
,  .
.
For accurate computation of D the vectorial algorithm implemented in the SOFA library 5 was used. The difference between D values obtained with accurate and approximate expressions is below 0.1 μas for all catalog comparisons performed in this study. Deriving a rigorous formula for σD is a not an evident task. The above expression is a simplified estimate, which does not have a strong statistical background and is intended just only to serve as an arbitrary criterion for detection of outliers (sources having large position errors).
Expressions for computation of the normalized separation of the source positions in two catalogs are given in Mignard et al. (2016; Equations (3)–(5)) and modified here to a generalized form. Let us define the normalized coordinate differences as

Then the normalized separation X between source positions in two catalogs is computed as
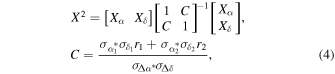
where r1 and r2 are correlation coefficients between α and δ in two catalogs.
Various tolerances for the position differences and their errors are used in different papers. Here, the so called "555" criterion (Lambert & Malkin 2023) inherited from the ICRF3 analysis (Charlot et al. 2020) was used, which implies that the source is considered an outlier if the normalized separation between the positions in two catalogs is larger than 5, the angular separation is larger than 5 mas, or the error in the position difference is larger than 5 mas.
2.4. Handling Galactic Aberration
Extragalactic source positions determined by means of both VLBI and Gaia observations are subject to systematic apparent motion caused by the centripetal acceleration due to Galactic rotation caused by the Galactic gravitational potential. The impact of this effect, hereafter called Galactic aberration (GA), on radio and optical ICRS realizations was theoretically and practically discussed by Titov (2010), Liu et al. (2012), Malkin (2014), MacMillan et al. (2019), Liu & Liu (2020), and Gaia Collaboration et al. (2021) The GA-induced proper motion of extragalactic sources is given by Kovalevsky (2003) and Kopeikin & Makarov (2006):

where l and b are Galactic longitude and latitude of the celestial body, respectively, and A is the GA constant, which depends on the Galactic rotation parameters as (Malkin 2014):

where V0 and Ω0 are the linear and angular speed, respectively, of the circular motion of the local standard of rest (LSR) due to the rotation of the Galaxy, R0 is the Galactocentric distance of the Sun, and c is the speed of light. Strictly speaking, these equations describe only the impact of the circular rotation around the center of the Galaxy. Actual orbit of the solar system in the Galaxy is not circular and therefore its actual acceleration differs slightly from the LSR acceleration. Several effects that cause the deviation of the actual motion of the solar system from the circular rotation, and therefore cause its additional acceleration were considered by Kopeikin & Makarov (2006) and Gaia Collaboration et al. (2021), and found to be at a level of the current statistical uncertainty of A.
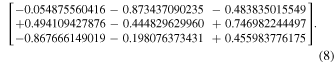
The GA-induced source motion can be further transformed to motion in equatorial system μα and μδ using the following formulas (Murray 1983; Malkin 2014):
where G is the rotation matrix between Galactic and equatorial coordinate systems. Currently an unofficial standard of the transformation between Galactic and ICRS (equatorial) systems is defined by three parameters defined in (ESA 1997) taken as exact values:
- R.A. of the North Galactic pole in ICRS: αG = 192
 85948,
 - decl. of the north Galactic pole in ICRS: δG = 2712825, and
- Galactic longitude of the ascending node of the Galactic plane on the equator of ICRS: lΩ = 3293192.
Corresponding rotation matrix G (computed with extended precision with respect to ESA 1997) is the following:
Discussion on the determination of the most reliable value of A can be found in Malkin (2014) and MacMillan et al. (2019). The authors of these papers showed that a significant difference exists between the value obtained from geodetic VLBI observations 5.8 ± 0.3 μas yr−1 and that derived from the Galactic rotation parameters provided by the stellar astronomy 5.0 ± 0.3 μas yr−1. The recently published A value based on analysis of Gaia DR3 data is equal to 5.05 ± 0.35 μas yr−1 (Gaia Collaboration et al. 2021), which agreed much better with the value estimated by methods of stellar astronomy than with the VLBI-based estimate.
The GA-induced source proper motion thus determined can be used to transform the catalog positions to an arbitrary epoch t0. There are several options for choice of t0. First one is that t0 is taken to be equal to the mean epoch of the observation of a given source. In such a case the position of sources in a catalog will be, generally speaking, given at different epochs equal to the mean epoch of observations of each source. Such a catalog will formally have the source positions the same as catalogs computed without GA modeling.
Traditional option for astrometry is the choice of the same conventional epoch t0 for all sources in the catalog. The epoch t0 = J2000.0 is mostly used for astrometric derivations nowadays, for example, as the fundamental epoch for theories of precession and nutation, and for ephemerides in astronomical almanacs.
For construction of ICRF3, another option was used. For this analysis, t0 = 2015.0 was chosen, which is close to both the mean epoch of the radio observations, from which the three ICRF3 catalog was derived, and to the epoch of the Gaia-CRF2 catalog, which was used for comparison with ICRF3. Since the Gaia-CRF solutions are computed without GA modeling, such a choice of t0 provided results of comparison of the radio and optical frames to a large extent free from the impact of the GA.
Considering these discussions, it was decided to test the effect of the uncertainty of the A value and the impact of a choice of t0 on the result of the comparison of ICRS realizations. Therefore, most computations in this work were made with two values of A: 5.0 and 5.8 μas yr−1. For this purpose all three ICRF catalogs were recomputed so that each catalog became available in four forms: computed with two values of the GA constant A = 5.0 μas yr−1 and A =5.8 μas yr−1, and with two reference epochs t0 = 2015.0 and t0 = 2000.0.
These computations were performed for the three ICRF catalogs only because there is no much sense to do this for the Gaia-CRF catalogs since they have very close observation epochs (see Table 1), and the impact of the GA effect on the systematic differences between these catalogs should be well below their accuracy.
As was shown in Liu et al. (2012) and Liu & Liu (2020), the impact of the GA on the mutual orientation of the ICRF and ICRF2 is at a level of 1 μas yr−1. A more detailed analysis of this problem is performed below.
3. ICRF Catalogs
This section is devoted to analysis and mutual comparison of the three versions of the ICRS implementation in radio wave bands, namely ICRF, ICRF2, and ICRF3-SX. The source positions in these three catalogs are related to the wavelength of the X band. The source sky distribution for the three radio ICRF catalogs and sources in common analyzed in this paper is shown in Figure 2. A well manifested "jump" in the density of the source distribution at about δ = −40° is explained by the fact that most ICRF sources were observed using the Very Long Baseline Array, which is not able to observe more southern objects.
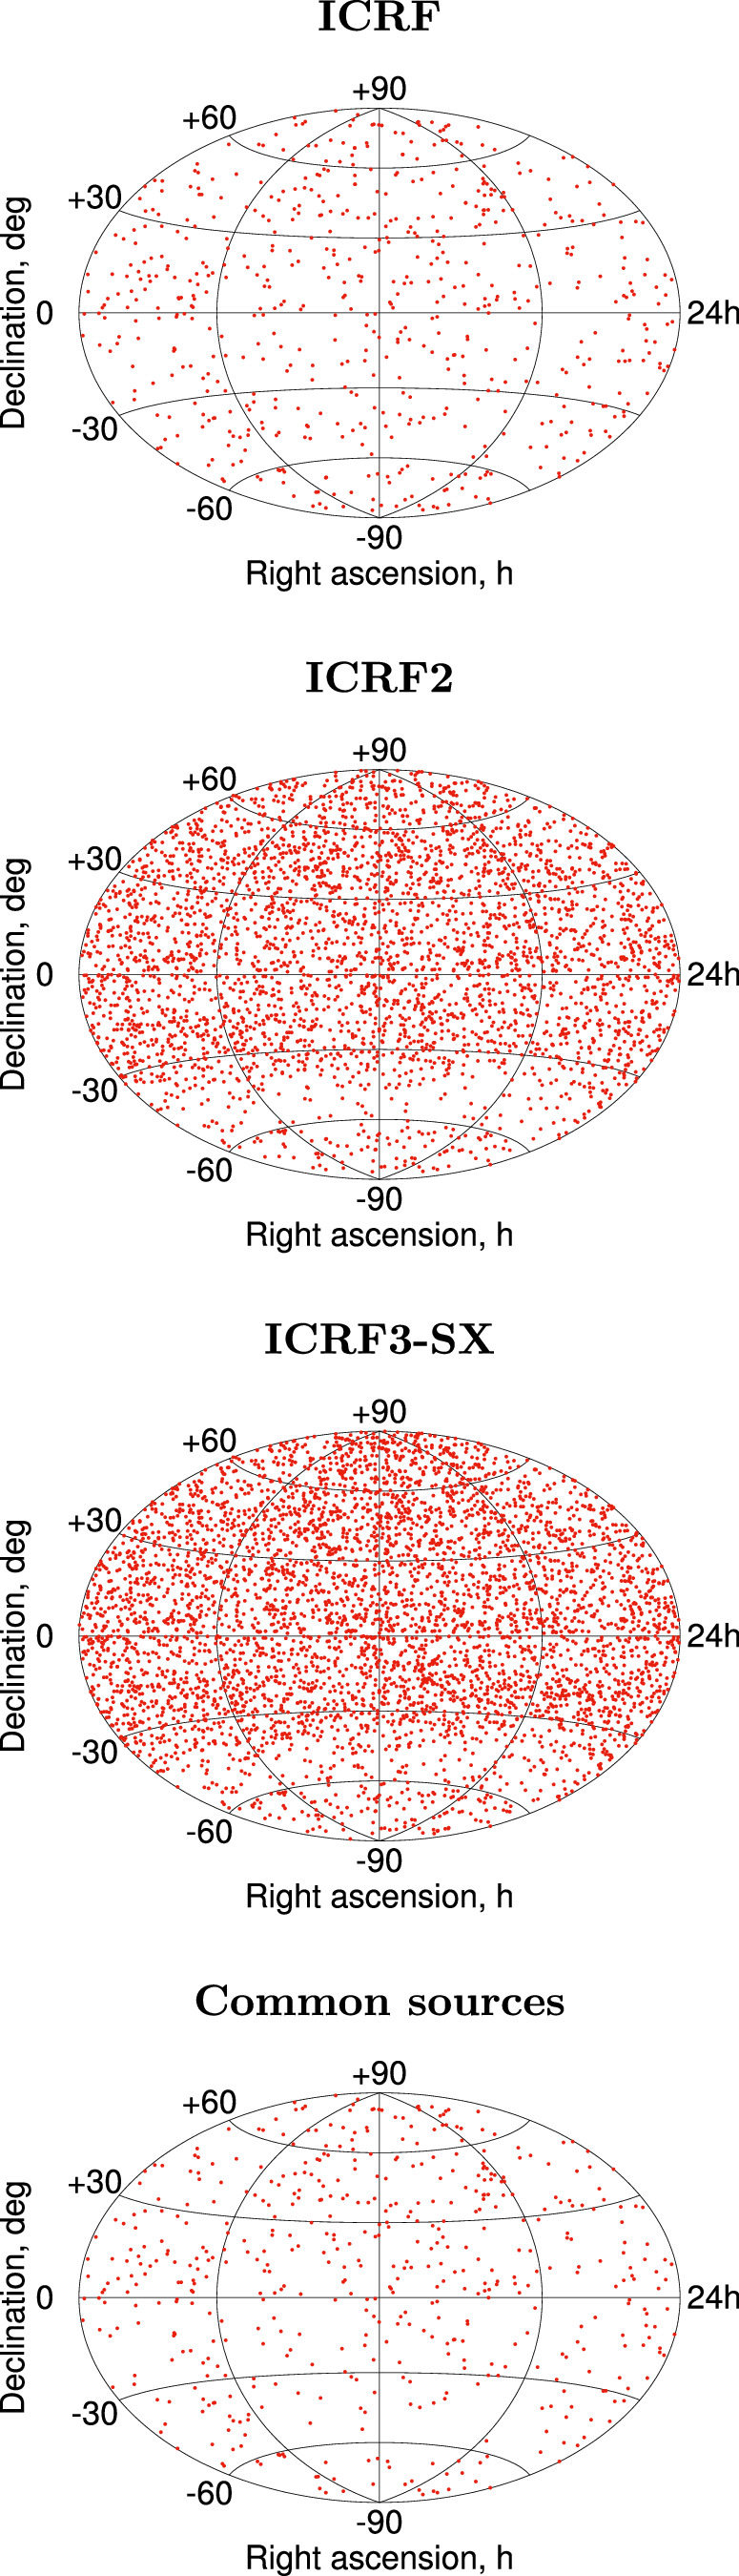
Figure 2. Sky distribution of the three radio ICRF catalogs and sources in common.
Download figure:
Standard image High-resolution imageTable 2 presents some statistics of the source position errors in ICRF catalogs, which shows an evolution in improving the precision of the ICRF. However, it can be seen that the position error in decl. still tends to be greater than the error in right accession, although the situation improves over time (look at the error statistics of sources in common).
Table 2. Median Errors in Source Positions in Three ICRF Versions in R.A. ( ) and decl. (σδ
)
) and decl. (σδ
)
| ICRF | ICRF2 | ICRF3-SX | |||
|---|---|---|---|---|---|
| σα* | σδ | σα* | σδ | σα* | σδ |
| 608 sources | 3414 sources | 4537 sources | |||
| 0.493 | 0.570 | 0.397 | 0.739 | 0.127 | 0.218 |
| 601 common sources for the three catalogs | |||||
| 0.482 | 0.560 | 0.065 | 0.087 | 0.040 | 0.046 |
Note. Units: mas.
Download table as: ASCIITypeset image
It is easy to suppose that the difference of source coordinates in two catalogs correlates with the position errors excluding several "exotic" cases of observations of sources with variable complicated structure when different source components were observed under the same name in different sessions and periods of time as discussed by Fomalont et al. (2011), Frey & Titov (2021), and Titov et al. (2022). Generally speaking, it would be more correct to introduce different ICRF source names in such a case, distinguishing them by a letter A/B/C as it was already made in the literature for many other sources. Then these components can be included in the ICRF catalogs separately with their corresponding history of observations. This would help to avoid further confusions.
One of the main factors that affects the source position uncertainty is the source observation statistics, which can be characterized by the number of observations of the source and the number of sessions in which the source was observed. These two quantities are generally closely correlated, but this correlation is less strong for sources with poor history of observations. As was found in Malkin (2016), the dependence of the source position uncertainty on observation statistics is better described by the number of observations than by the number of sessions. To check the suggestion that the outliers are mostly observed for sources having a few observations, a corresponding test was performed and its results are presented in Figure 3. The number of observations shown on the x axis is the minimum of the number of observations of given source in the two compared catalogs.

Figure 3. Dependence of differences between the source positions (left panel) and normalized separation (right panel) in ICRF catalogs on the number of observations for 601 common sources in all three catalogs. Red lines show the level of D = 5 mas for the left panel and X = 5 for the right panel.
Download figure:
Standard image High-resolution imageThe results of the 16-parameter VSH expansion of the differences between the three ICRF catalogs is presented in Figure 4. Of the total 601 common sources, 80 sources were rejected according to the "555" criterion (see Section 2.3), resulting in 521 sources contributing to the computation of the VSH coefficients. Of the rejected sources, 17 sources showed large normalized separation, 33 sources showed large angular separation, and 67 sources showed large error in the position difference, 29 sources were rejected based on two criteria, and four sources were rejected based on all three criteria. As mentioned above, the comparison of the three catalogs was made in four variants for two values of the GA constant and two reference epochs for the GA contribution. After correction for the GA effect the G2 component became near to zero, while the G3 component only became approximately 40% smaller. Note that the magenta (most right) plot corresponding to the originally published catalogs in the bottom panel is very close to Figure 15 in Charlot et al. (2020; with the opposite sign).
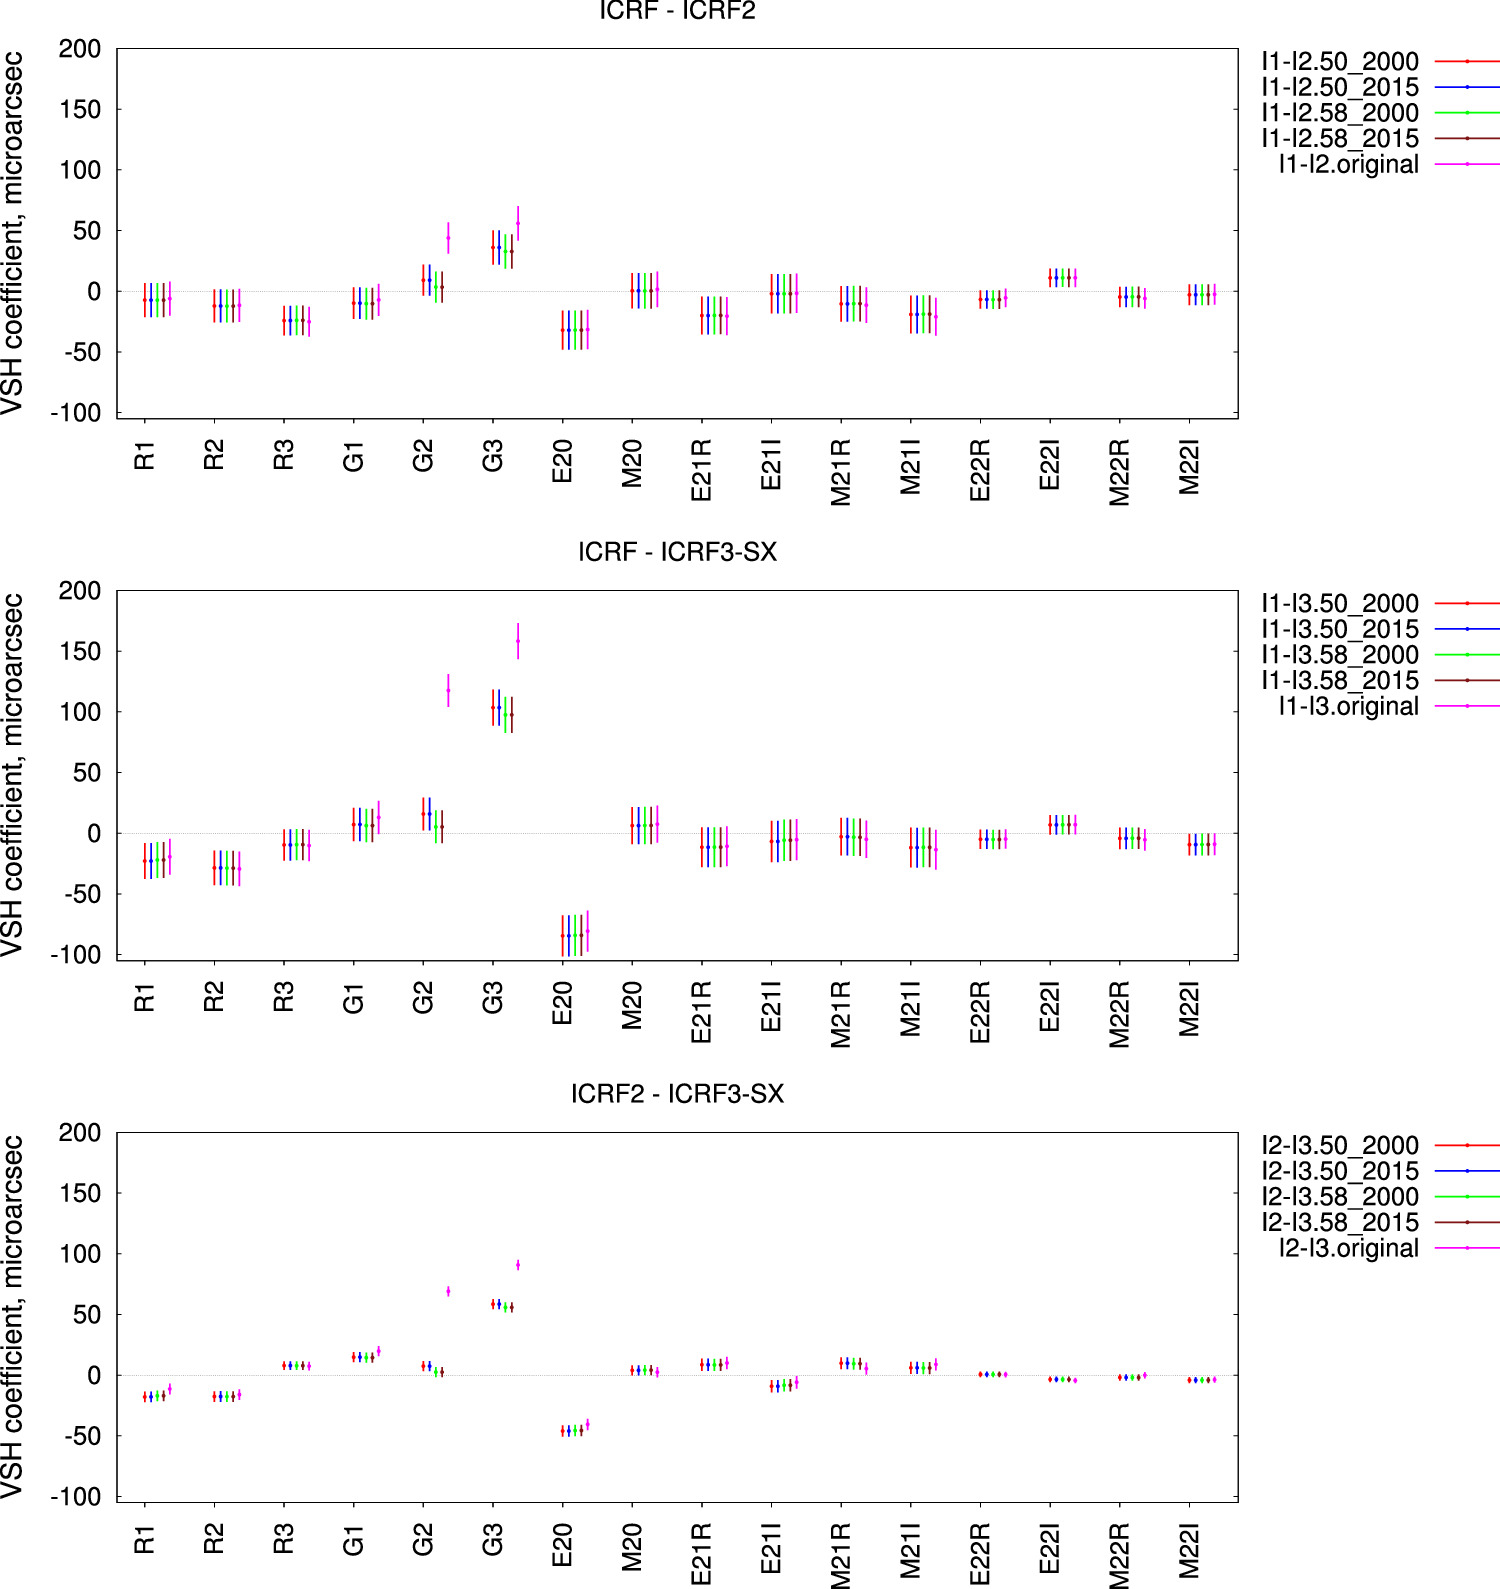
Figure 4. Systematic differences between ICRF (I1), ICRF2 (I2), and ICRF3-SX (I3) represented by a 16-parameter VSH expansion. Plots labeled with "50" and "58" correspond to the catalogs recomputed with A = 5.0 and A = 5.8, respectively; labels "2000" and "2015" correspond to the catalogs recomputed with t0 = 2000 and t0 = 2015, respectively; plots labeled with "original" correspond to originally published catalogs. The vertical error bars show 1σ uncertainty of the VSH coefficients.
Download figure:
Standard image High-resolution imageAs to the errors in the VSH coefficients, they clearly reflect the source position uncertainties in the compared catalogs (see Table 2). They are substantially larger for the differences with the ICRF, and several times smaller for the differences ICRF3-SX minus ICRF2.
4. Gaia-CRF Catalogs
The systematic stability of the Gaia-CRF catalogs was tested through the comparison with the latest radio ICRF release ICRF3-SX. The source sky distribution for the three Gaia-CRF catalogs analyzed in this paper and sources in common with the ICRF3-SX catalog is shown in Figure 5. Two regions with a relatively low source density can be seen on the plots. The deficit in the south evidently comes from the ICRF3-SX catalog, see Figure 2, and the deficit along the Galactic equator is explained by absence of extragalactic Gaia sources around the Galactic plane.
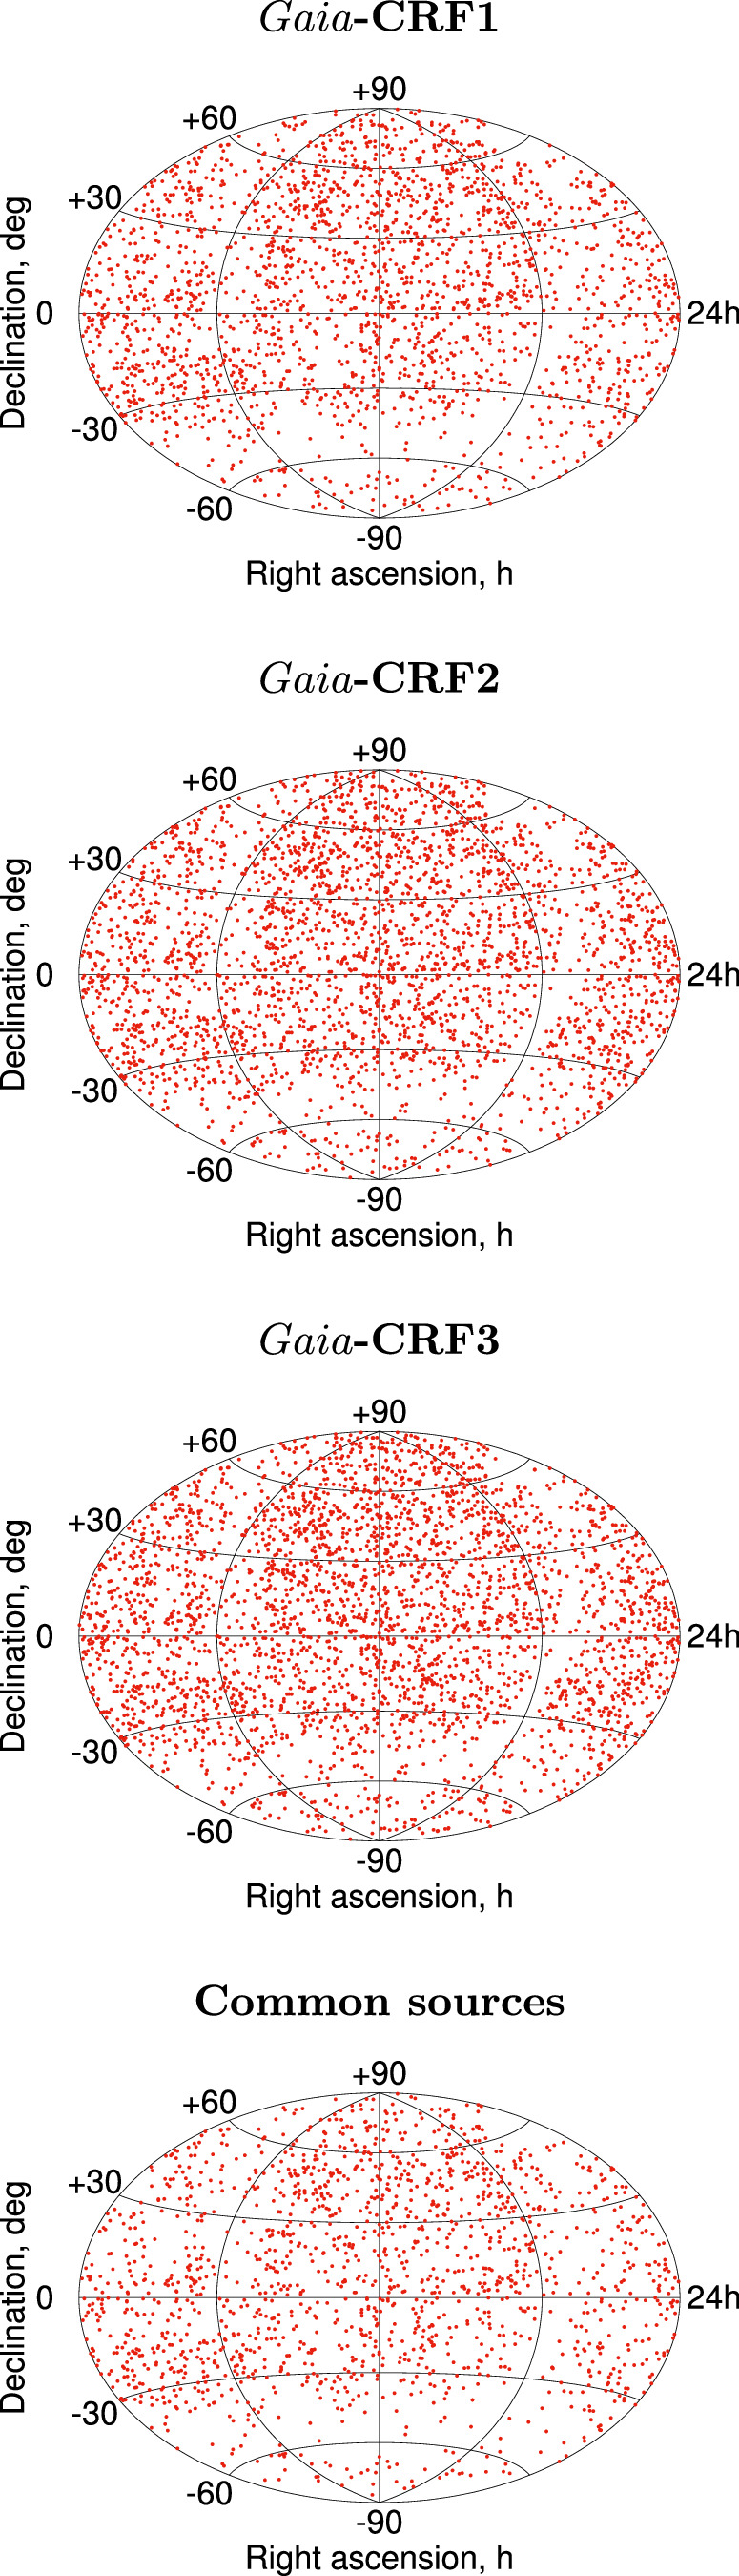
Figure 5. Sky distribution of the three Gaia-CRF catalogs and sources in common for Gaia-CRF catalogs and ICRF3-SX.
Download figure:
Standard image High-resolution imageThe evolution of the precision of the Gaia-CRF solutions is shown in Table 3. Unlike ICRF catalogs, the decl. errors in Gaia-CRF catalogs are better than the errors in right accession. Additionally, the data presented in Table 3 shows how the Gaia-CRF position errors improve with release version.
Table 3. Median Errors in Source Positions in Three Gaia-CRF Versions in R.A. ( ) and decl. (σδ
)
) and decl. (σδ
)
| Gaia-CRF1 | Gaia-CRF2 | Gaia-CRF3 | |||
|---|---|---|---|---|---|
| σα* | σδ | σα* | σδ | σα* | σδ |
| 2982 sources | 3376 sources | 3485 sources | |||
| 1.468 | 1.086 | 0.263 | 0.240 | 0.195 | 0.181 |
| 2975 common sources for the three catalogs | |||||
| 1.458 | 1.078 | 0.232 | 0.210 | 0.168 | 0.152 |
Note. The number of sources is related to the sources in common between the corresponding Gaia-CRF catalog and ICRF3-SX catalog used for further computation. Units: mas.
Download table as: ASCIITypeset image
Of the total 2975 common sources, 1429 sources were rejected according to the "555" criterion (see Section 2.3), resulting in 1546 sources contributing to the computation of the VSH coefficients. Of the rejected sources, 490 sources showed large normalized separation, 584 sources showed large angular separation, and 1054 sources showed large error in the position difference, 457 sources were rejected based on two criteria, and 121 sources were rejected based on all three criteria. The number and the percentage of detected outliers is significantly higher than in the case of comparing the three ICRF catalogs. There may be several reasons for this. The 601 common sources in the ICRF catalogs tend to have a long observational history and therefore reliable positions, while the set of 2975 common sources in the three Gaia-CRF and ICRF3-SX catalogs includes a large number of sources with worse ICRF position accuracy. On the other hand, the source position errors in the Gaia-CRF1 catalog are several times larger than in the second and third Gaia-CRF releases (Table 3). As a result, 77.4% of the outliers were observed in the differences between the Gaia-CRF1 and the other three catalogs.
Taking into account that, in fact, Gaia-CRF1 is now only of historical interest, computations were repeated without this catalog. In this case, of the total 3374 common sources, 715 sources were rejected according to the "555" criterion, resulting in 2659 sources contributing to the computation of the VSH coefficients. Of the rejected sources, 510 sources showed large normalized separation, 296 sources showed large angular separation, 191 sources showed large error of the position difference, 234 sources were rejected based on two criteria, and 24 sources were rejected based on all three criteria.
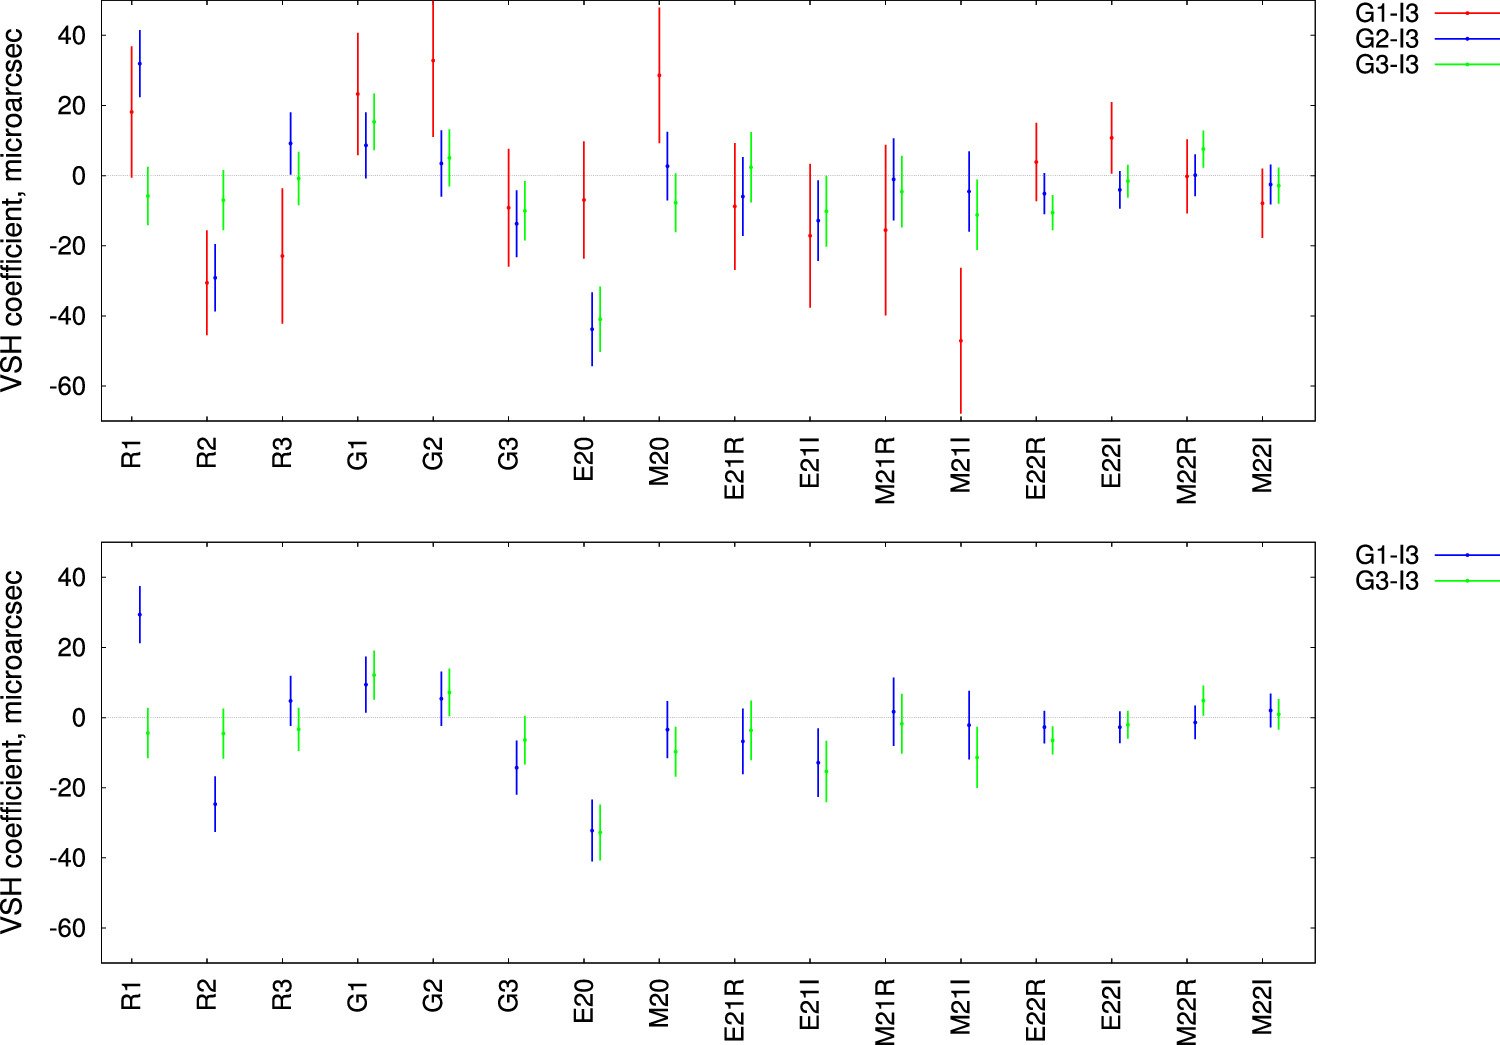
The results of the 16-parameter VSH expansion of the differences between the Gaia-CRF catalogs and ICRF3-SX in two variants are presented in Figure 6.
Figure 6. Systematic differences of the three Gaia astrometric solutions Gaia-CRF1 (G1), Gaia-CRF2 (G2), and Gaia-CRF3 (G3) with ICRF3-SX (I3; upper panel), and of the two latter Gaia solutions with ICRF3-SX (bottom panel) represented by a 16-parameter VSH expansion. The vertical error bars show 1-sigma uncertainty of the VSH coefficients.
Download figure:
Standard image High-resolution image
As mentioned above, the comparison of the Gaia-CRF and ICRF3-SX catalogs was made without correction for the GA because its impact is insignificant in this case due to small differences in the mean observation epochs in the compared catalogs: 2015.0 for the ICRF3-SX catalog and 2015.0–2016.0 for Gaia-CRF catalogs.
The differences between the Gaia-CRF2 and Gaia-CRF3 with ICRF3-SX are close except for two rotation angles R1 and R2, while the differences between the Gaia-CRF1 and ICRF3-SX are much larger. This can be explained by the fact that different versions of Gaia astrometric solutions were aligned to different ICRF versions. This result does not differ significantly for the two variants of computations described above and presented in the upper and bottom panels of Figure 6. The differences between the VSH coefficients for these two variants are within their uncertainties. It can also be noted that the uncertainties of the VSH coefficients are a bit smaller in the case of excluding Gaia-CRF1 from comparison.
Gaia − CRF1 was linked to the ICRF2, which shows large systematics with respect to the ICRF3-SX, (see Figure 4), particularly because of the GA effect, which was not modeled for ICRF2. The Gaia-CRF2 and Gaia-CRF3 catalogs were linked to the ICRF3-SX, however the Gaia-CRF2 was linked to the ICRF3-SX prototype, which was not a final version of the ICRF3-SX and may have some rotation with respect to the final ICRF3-SX version.
Generally speaking, similarly to the ICRF catalogs, the errors in the VSH coefficients correspond to the source position errors in the compared catalogs (see Table 3).
Unlike systematic differences between VLBI-based catalogs, there may be additional specific origins of the ICRF minus Gaia-CRF position differences. Different locations of optical and radio centroids can be caused, for example, by AGN jet physics, complicated optical structure of ICRF sources (Petrov & Kovalev 2017a, 2017b; Plavin et al. 2019), or by possible problems with processing of Gaia observations of extended galaxies (de Souza et al. 2014; Makarov et al. 2023).
5. Conclusions
In this paper, the differences between three ICRF catalogs were investigated with the goal of assessment of the long-term ICRF stability. Based on the 16-parameter VSH expansion of the differences, a conclusion can be made that the components of the mutual rotation vector are at a level of a few tens of microarcseconds, while the components of the glide vector are several times greater. Also, the deformation term E2,0 was found to be several times greater than the rotational and other deformation terms. A comparison of the three Gaia-CRF catalogs with the ICRF3-SX catalog showed that for the latest catalog, Gaia-CRF3, the amplitude of all rotational and deformation components are below 20 microarcseconds except for the E2,0 term, which is several times greater.
The VSH coefficient E2,0 has the argument  , i.e., it is a zonal harmonic with decl. components only. A relatively large value of this term found in most comparisons performed in this paper correlates well with the systematics of the ICRF2 and ICRF3-SX catalogs at the mid southern decl. zone. The latter was investigated in detail in Charlot et al. (2020). This allows us to suppose that this part of the systematics between the Gaia-CRF3 and ICRF3-SX may be attributed to the ICRF3-SX. Notice that this term did not manifest itself in the differences Gaia-CRF1 and ICRF2. This can be explained by the fact that the first Gaia astrometric solution was linked to ICRF2 and thus these two catalogs may have common systematics.
Analysis of the ICRF catalogs showed that the GA does not significantly impact the rotation vector, which supports a conclusion derived in Liu et al. (2012). However, the account for the GA is crucial for the components of the glide vector. Other coefficients of the VSH expansion do not depend much on the GA, as expected.
This work confirms that the GA effect should be taken into account in analysis of highly accurate ICRS implementations. On the other hand, the accuracy of modern catalogs is still not good enough to make the results of the analysis of their mutual orientation sensitive to such details of GA modeling as the ambiguity in the value of the GA constant and the choice of the reference epoch between 2000.0 and 2015.0. The differences of the orientation and deformation parameters between the catalogs obtained with the several variants of modeling GA are within the parameter uncertainties. Of course, these details become crucial in the analysis of separate source motions, but this problem is beyond the scope of this paper.
Acknowledgments
I am grateful to Sergey Klioner for his help in better understanding of the Gaia astrometric solutions and in working with the Gaia data archive.
I thank the anonymous reviewer for careful reading of the manuscript and useful comments and suggestions.
All the VLBI observations and results used in this study were obtained through years of hard and highly skilled work by many people and organizations who contributed to the IVS activity: stations and correlators, technology development, operation, data, and analysis centers, as well as IVS coordinating bodies. Their contribution to the development of the ICRF is highly appreciated.
This work has made use of data from the European Space Agency (ESA) mission Gaia, 6 processed by the Gaia Data Processing and Analysis Consortium 7 (DPAC). Funding for the DPAC has been provided by national institutions, in particular the institutions participating in the Gaia Multilateral Agreement.
This research has made use of SAO/NASA Astrophysics Data System 8 (ADS).
Figures were prepared using gnuplot. 9
Footnotes
- 1
- 2
- 3
- 4
- 5
- 6
- 7
- 8
- 9