


Abstract
The active asteroid 311P/PanSTARRS is one of the two targets of the planned Chinese asteroid exploration mission Tianwen-2. During 2013, 311P experienced several mass-loss events and exhibited multiple comet-like tails. Here we analyze the morphology and surface brightness of the tails to investigate the dust environment around the nucleus and the mechanism of activities. We enhance the features of the tails using image processing techniques to obtain information about the morphologies of the tails, and fit the processed images with syndyne–synchrone diagrams. The fitting results give estimations of the upper limits of the durations (2–8 days) of eruptions and the dust size ranges (0.006 –38.9 mm) in the tails. The results of surface photometry performed for each dust tail show that the brightness distribution index of each tail ranged from approximately −1.81 to 0 and the dust size distribution indices of 311P's tails ranged from −2.29 to −1.45. The quantity of particles in each tail ranged from 0.5 to 8 × 10⁶ kg, which leads to a total dust-loss quantity of 3.0 × 10⁷ kg and a mass-loss rate of 1.59 kg s−1. Sublimation, continuous impacts, or tidal forces of planets are excluded as explanations for 311P's activities, and rotational instability remains a possible activation cause without strong evidence against it.
Export citation and abstract BibTeX RIS

Original content from this work may be used under the terms of the Creative Commons Attribution 4.0 licence. Any further distribution of this work must maintain attribution to the author(s) and the title of the work, journal citation and DOI.
1. Introduction
It was conventionally considered that comets and asteroids are different types of small solar system bodies (Jewitt & Hsieh 2022). In recent years, however, the discoveries of active asteroids have blurred the boundary line between asteroids and comets. Active asteroids usually exhibit detectable mass loss in confined segments of their orbits. More than 40 known active asteroids have been discovered at the time of this writing. There are several different physical mechanisms to explain such mass-loss activity, including water sublimation (e.g., 1 Ceres; Küppers et al. 2014; and 288P; Agarwal et al. 2017), impact ejecta (e.g., 354P/LINEAR; Kleyna et al. 2013; Kim et al. 2017), P/2016 G1 (Moreno et al. 2016), rotational instability (e.g., 331P/Gibbs; Drahus et al. 2015; and P/2013 R3 Jewitt et al. 2014), and thermal effects (e.g., 3200 Phaethon' Jewitt et al. 2013c). Activated asteroids display comet-like tails which consist of a large number of dust grains emitted from the nucleus. The information about mass-loss mechanisms and the physical properties of dust particles could be inferred by analyzing the dust tails of active asteroids.
In this paper, we focus on the active asteroid 311P (also known as P/2013 P5), which is an interesting target for space exploration. The orbital parameters of 311P (collected from the JPL Small-Body Database) are as follows: semimajor axis a = 2.189 au, eccentricity e = 0.116, and inclination i = 4 968, yielding a Jupiter Tisserand parameter TJ = 3.66. 311P was discovered on 2013 August 18 by the Pan-STARRS1 telescope (Bolin et al. 2013). In follow-up observations using the Hubble Space Telescope (HST), it was found that 311P generated multiple comet-like tails, suggesting multiple outbursts occurred in early 2013 (Jewitt et al. 2013a, 2015). Rotational disruption (Jewitt et al. 2015) or rubbing of binary components (Hainaut et al. 2014) is the most likely driving mechanism for 311P's activities. The observations by Jewitt et al. (2018) strongly suggest that 311P is a binary system, which implies that the activities of 311P may be caused by rubbing of the binary components.
The absolute magnitude of the active asteroid 311P measured by Jewitt et al. (2018) with the HST is H V = 19.14 ± 0.02, and the photometry of its nucleus implies that the radius of 311P is re = (0.19 ± 0.03) km. The lower limit of the rotation period of 311P is about 5.4 hr, which is derived from the light curve of 311P observed by the HST (Jewitt et al. 2018). Hainaut et al. (2014) estimated the peak times of the activities and total mass production around the activity peaks by analyzing images from the Canada–France–Hawaii Telescope (CFHT), the Perkins Telescope, the New Technology Telescope (NTT), and the TRAnsiting Planets and PlanetesImals Small Telescope (TRAPPIST)-South. Moreno et al. (2014) analyzed the observation images obtained by the HST as well as the Gran Telescopio CANARIAS (GTC), modeled a three month activity resulting from spin instability, and estimated the total dust mass, which is of the order of 107 kg. Furthermore, Moreno et al. (2014) indicated that an isotropic ejection model does not fit 311P's activities based on the HST data. After estimating the initial time of each ejection, Jewitt et al. (2015) measured the total dust quantity around the nucleus, and obtained the upper and lower limits of grain sizes and the surface brightness profiles of the tails by analyzing data from the HST. Moreover, the activity mechanism of 311P was also discussed in Jewitt et al. (2015).
In this paper, we perform data reduction and reanalysis of the observational data from the HST program 13609 (PI: David Jewitt), which was previously analyzed by Jewitt et al. (2015). Our work provides new aspects on the activities and tails of 311P, which are shown as follows. The length of each tail at each observation epoch is obtained (Table 2). The upper limit of the duration of each emission activity (Table 3) is estimated by analyzing the widths of the tails. The number of dust particles of different grain radii (Figure 5) and the dust mass integrated along the radial distance of the tail from the nucleus (Figure 7) in each tail are determined by applying the Finson–Probstein theory to the surface photometry result. For most of the tails of 311P, we observed that (Figure 6) the dust size distributions are steeper for the tails with a larger average grain size, and their indices are close to that of the power-law distribution of self-organized critical sandpiles. We also discuss the effect of the tidal forces of planets (Figure 8(b)), which is ruled out as the origin of activity.
We also revisit some aspects that were previously addressed by Jewitt et al. (2015). We use the same method of fitting synchrones to the tails' position angles to derive the start times of ejections (Table 3), the results of which differ a bit from Jewitt et al. (2015) because we use the boundaries of the tails for fitting instead of the brightest lines. We estimate the minimum grain size in each tail by fitting the tails' boundaries with syndynes, the method of which is different from Jewitt et al. (2015) where the minimum grain size was determined from the tail's length, but leads to consistent results. We adopt the same method to obtain the tail's surface brightness profile (Figure 4) for each tail in all observed epochs, and our results are generally consistent with Jewitt et al. (2015) where the surface brightness profiles of certain selected tails were shown. Besides, we discuss and rule out the possibilities of sublimation (Figure 8(a)) and continuous impacts as activity mechanisms, and show that rotational instability remains a possible activation cause of 311P, which is consistent with Jewitt et al. (2015).
The forthcoming Chinese deep space mission Tianwen-2 (previously known as the ZhengHe mission) will explore 311P (Zhang et al. 2021), which is planned to be launched around 2025. On board the Tianwen-2 spacecraft there will be a dust analyzer, which is capable physically analyzing dust particles (Zhao et al. 2022). Research on the dust environment of 311P is helpful and important for science and mission planning of Tianwen-2.
The paper is organized as follows. Archival images and data reduction are described in Section 2. An analysis of the dust tail morphology using a syndyne–synchrone diagram is presented in Section 3. We analyze the surface brightness of the dust tails in Section 4. In Section 5, we estimate the total amount and the size distribution of dust contained in each tail. The possible activity mechanisms of 311P are discussed in Section 6. Finally, the conclusions of this paper are summarized in Section 7.
2. Observational Data
The observational data of 311P shown in this section cover a two year period, starting from 2013 August to 2015 July. We review the previous observational data of 311P from seven ground and space telescopes, including CFHT, TRAPPIST-South, NTT, the 1.23 m Calar Alto (CA1.23m) Telescope, GTC, HST, and Perkins. Table 1 summarizes the observing geometries of these observational data. It should be noted that only the data from the HST (Section 2.7) are used for the analysis in this manuscript.
Table 1. Observational Geometry of 311P/PanSTARRS
| Date | DOY a | Rb | Δ c | αd | PsAng e | PsAMV f | νg | δh | Telescope |
|---|---|---|---|---|---|---|---|---|---|
| 2013 August 30 | 242 | 2.13 | 1.13 | 5.5 | 202.1 | 245.2 | 277.4 | −3.7 | CFHT |
| 2013 September 1 | 244 | 2.12 | 1.12 | 4.8 | 191.8 | 245.1 | 278.1 | −3.8 | NTT |
| 2013 September 3 | 246 | 2.12 | 1.12 | 4.3 | 178.3 | 245.1 | 278.1 | −3.9 | NTT |
| 2013 September 5 | 248 | 2.12 | 1.12 | 4.1 | 162.4 | 245.0 | 279.3 | −4.0 | CFHT |
| 2013 September 6 | 249 | 2.12 | 1.12 | 4.0 | 153.0 | 245.0 | 279.7 | −4.0 | NTT |
| 2013 September 10 | 253 | 2.11 | 1.11 | 4.8 | 125.0 | 244.9 | 281.0 | −4.2 | CFHT |
| 2013 September 10 | 253 | 2.11 | 1.11 | 4.8 | 125.0 | 244.9 | 281.0 | −4.2 | HST |
| 2013 September 11 | 254 | 2.11 | 1.11 | 5.2 | 119.5 | 244.8 | 281.3 | −4.2 | CA1.23m |
| 2013 September 23 | 266 | 2.10 | 1.14 | 10.7 | 89.2 | 244.5 | 285.2 | −4.3 | HST |
| 2013 September 25 | 268 | 2.09 | 1.14 | 11.7 | 87.1 | 244.4 | 285.9 | −4.3 | CA1.23m |
| 2013 September 28 | 271 | 2.09 | 1.15 | 13.2 | 84.5 | 244.4 | 286.9 | −4.3 | CFHT |
| 2013 September 29 | 272 | 2.09 | 1.16 | 13.7 | 83.8 | 244.3 | 287.2 | −4.3 | CFHT |
| 2013 September 30 | 273 | 2.09 | 1.16 | 14.2 | 83.1 | 244.3 | 287.5 | −4.3 | CFHT |
| 2013 October 4 | 277 | 2.08 | 1.18 | 16.0 | 80.7 | 244.2 | 288.9 | −4.2 | Perkins |
| 2013 October 5 | 278 | 2.08 | 1.18 | 16.4 | 80.2 | 244.2 | 289.2 | −4.2 | TRAPPIST-South |
| 2013 October 7 | 280 | 2.08 | 1.20 | 17.3 | 79.3 | 244.2 | 289.9 | −4.1 | GTC |
| 2013 October 18 | 291 | 2.06 | 1.27 | 21.5 | 75.6 | 244.1 | 293.6 | −3.8 | HST |
| 2013 November 8 | 312 | 2.04 | 1.45 | 26.8 | 71.2 | 244.1 | 300.8 | −2.7 | GTC |
| 2013 November 13 | 317 | 2.03 | 1.50 | 27.6 | 70.4 | 244.2 | 302.5 | −2.5 | HST |
| 2013 December 8 | 342 | 2.01 | 1.75 | 29.4 | 67.3 | 244.6 | 311.4 | −1.1 | HST |
| 2013 December 31 | 365 | 1.98 | 2.00 | 28.6 | 65.4 | 245.4 | 319.8 | 0 | HST |
| 2014 February 11 | 407 | 1.95 | 2.38 | 23.9 | 64.5 | 248.8 | 335.4 | 1.4 | HST |
| 2014 November 13 | 686 | 2.11 | 2.29 | 25.6 | 291.5 | 295.7 | 78.2 | −1.5 | HST |
| 2015 March 3 | 792 | 2.25 | 1.30 | 9.9 | 313.9 | 293.3 | 110.6 | 3.3 | HST |
| 2015 March 19 | 808 | 2.27 | 1.28 | 3.8 | 15.7 | 294.1 | 115.1 | 3.8 | HST |
| 2015 April 7 | 827 | 2.29 | 1.34 | 10.2 | 93.8 | 294.9 | 120.4 | 3.7 | HST |
| 2015 May 4 | 854 | 2.32 | 1.57 | 20.0 | 107.4 | 295.4 | 127.8 | 2.6 | HST |
| 2015 June 29 | 910 | 2.38 | 2.26 | 25.2 | 114.1 | 294.3 | 142.5 | 0.1 | HST |
| 2015 July 27 | 938 | 2.40 | 2.60 | 23.0 | 115.1 | 293.0 | 149.6 | −0.8 | HST |
Notes.
a Day of year, 2013/01/01 = 1. b Heliocentric distance, in astronomical units. c Geocentric distance, in astronomical units. d Phase angle, Sun–311P–Earth, in degrees. e Position angle of the projected Sun–311P radial direction, in degrees. f Position angle of the projected negative 311P's heliocentric velocity vector, in degrees. g True anomaly, in degrees. h Orbital plane angle (the angle between the observer and the orbital plane of 311P), in degrees.Download table as: ASCIITypeset image
2.1. CFHT
Images of 311P were obtained with the 3.6 m CFHT at the top of Maunakea, Hawaii, with the MegaCam wide-field imager on 2013 August 30 and September 5, 10, 28, 29, and 30 (Hainaut et al. 2014). The MegaCam wide-field imager consists of 40 CCDs with 2048 × 4612 pixels, with a resolution of 0 187 per pixel (Boulade et al. 2003). CFHT observations of 311P were made over six days in 2013 August and September, all with the Sloan
  ,
,  , and
, and  filters. Exposure times ranged from 540 to 1800 s.
The phase angle of 311P ranged from 41 to 142 during the multiple epochs, while the heliocentric and geocentric distances ranged from 2.13 to 2.09 au, and 1.13 to 1.16 au, respectively. As shown in Figures 2(a), (c), (e), and (h) and 3(c) of Hainaut et al. (2014), the composite images of the active asteroid 311P displayed a compact coma and three narrow and bright dust tails. However, the surface brightnesses of the tails steeply decreased over time, and the position angles of the tails evolved rapidly within one month.
2.2. The Perkins Telescope
Observations were taken on UT 2013 October 4 at Lowell Observatory with the Perkins 1.8 m diameter telescope, located in Arizona. The 2048 × 2048 pixel CCD camera, PRISM, has a pixel scale of 039 pixel−1 (Janes et al. 2004). 311P was observed for one night with the Bessel R band filter at a phase angle of 164, at a heliocentric distance of 2.08 au, and a geocentric distance of 1.08 au. A composite image of 311P, obtained by shifting images of exposure time 3600 s, is shown in Figure 2(i) of Hainaut et al. (2014). The tails of 311P became more dispersible on 2013 October 4 than those on 2013 September 30, and the tails in the images gradually weakened over time.
2.3. TRAPPIST-South
On 2013 October 5, 311P was observed with the TRAPPISTCAM FLI ProLine PL-3041-BB of the 0.6 m telescope at the La Silla European Southern Observatory, Chile. The receiver is the TRAPPISTCAM with a matrix of 2048 × 2048 pixels, a field of view of 22° × 22°, a pixel scale of 064 per pixel, and a pixel size of 15 μm (Jehin et al. 2011). The active asteroid 311P was observed with the Cousin R filter. The images of 311P were taken with a total exposure time of 20,880 s.
2.4. NTT
On 2013 September 1, 3, and 6, observations of P/2013 P5 were made at the European Southern Observatory, Chile, with the 2048 × 2048 ESO #40 CCD detector of the 3.56 m NTT. Binning of 2 × 2 was used, resulting in an pixel scale of 024 pixel−1 and a field of view of 41 (Dekker et al. 1986). Images were taken in the Bessel V and R bands, and the exposure times of the three nights of observations are 4500 s, 13,500 s, and 10,200 s, respectively.
2.5. Calar Alto Telescope
On 2013 October 5, 311P was tracked by Hainaut et al. (2014) using the CA1.23m telescope, located on Calar Alto, Almería province in Spain, with the DLR-KMIII camera. The DLR-KMIII camera is equipped with a 4000 × 4000 pixels e2v CCD231-84-NIMO-BI-DD, giving an image scale of 0628 pixel−1, and a field view of approximately 214 (Leinert et al. 1995). The Johnsons R filter was used twice with exposure times of 3300 s and 2100 s, respectively.
2.6. GTC
To observe 311P, Moreno et al. (2014) used the 10.4 m diameter GTC, located on the island of La Palma, and the Optical System for Image and Low Resolution Integrated Spectroscopy camera (OSIRIS). OSIRIS is equipped with a 2048 × 4096 pixel CCD, giving an image scale of 0127 pixel−1, and a field of view of about  . Sloan r and g filters were used (Larkin et al. 2006). Two composite images from different dates are shown in Figure 3 of Moreno et al. (2014).
2.7. HST
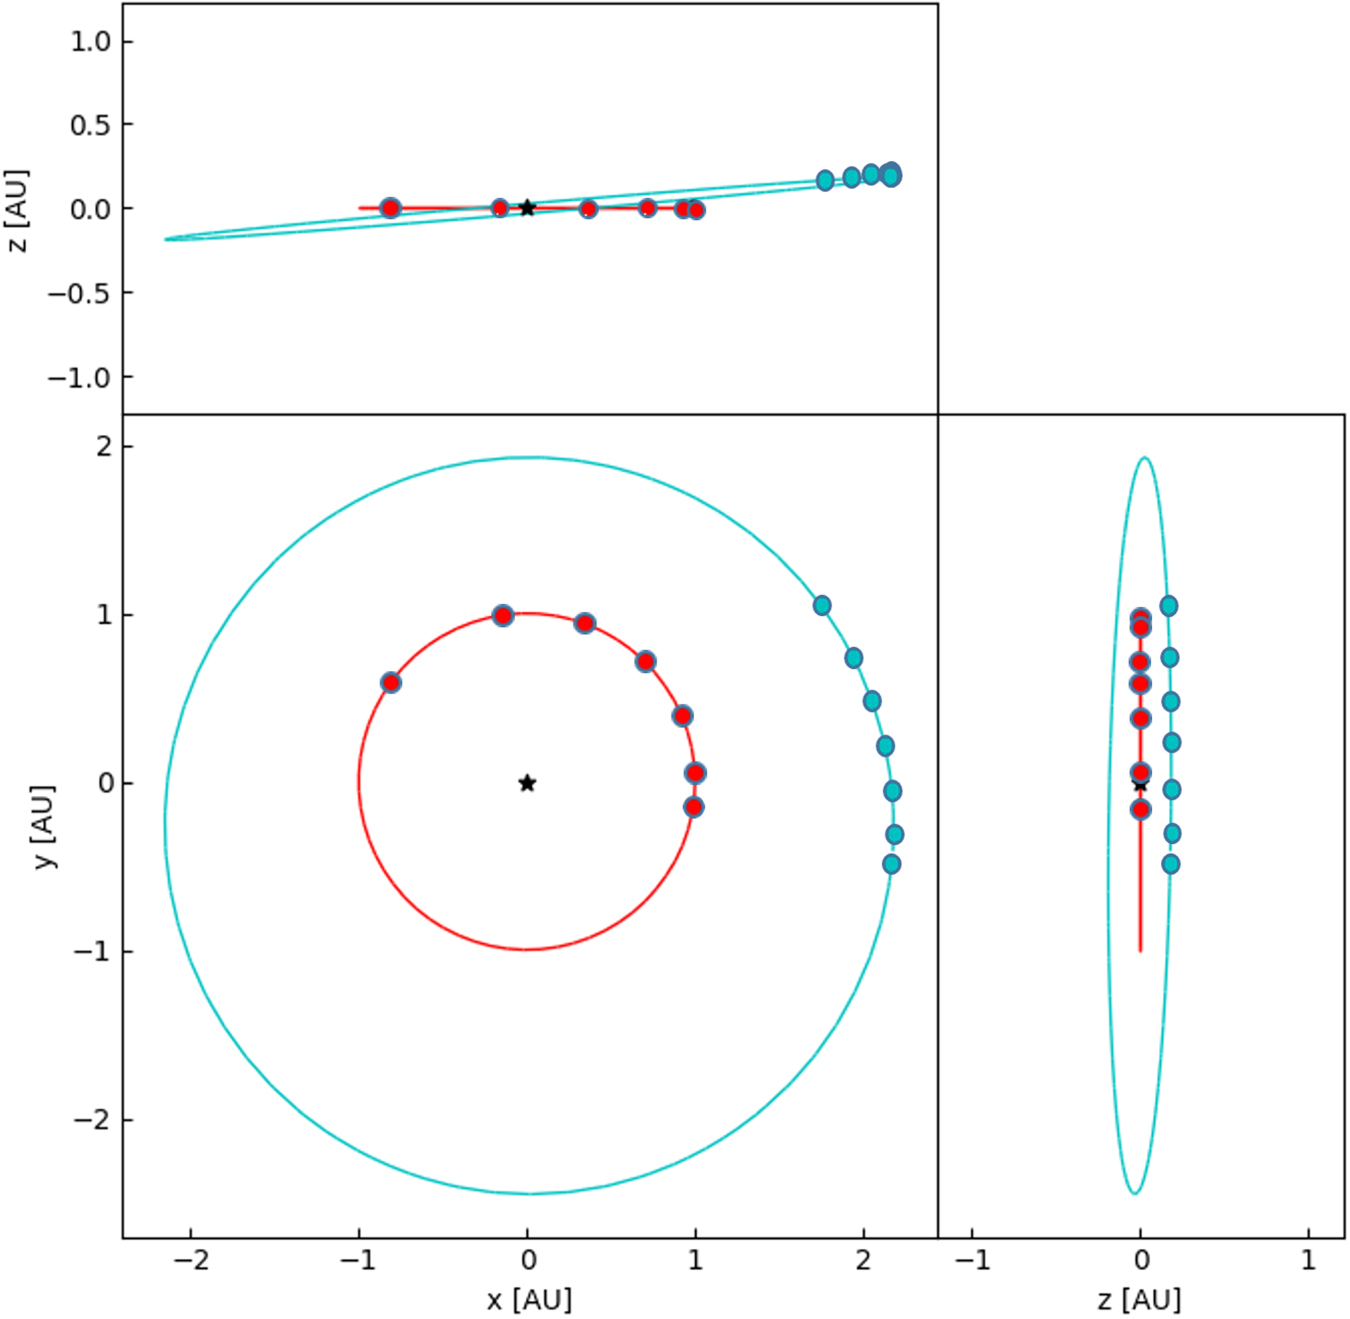
HST was used to observe 311P with Target-of-Opportunity time on 2013 September 10 and 23 (program number 13475, PI: David Jewitt; Jewitt et al. 2013a), 2013 October 18, 2013 November 13, 2013 December 8, 2013 December 31, and 2014 February 11 (program number 13609, PI: David Jewitt; Jewitt et al. 2015). During all observing epochs, a total exposure time of 1973 s was obtained with the 2K subarray of the WFC3 camera, which has a pixel scale of 004 pixel−1 (Bouwens et al. 2010). Figure 1 shows the position of the Earth–Sun–311P in the ecliptic coordinate system ECLIPJ2000. 311P passed perihelion at a distance of 1.93 au on 2014 April 16, and all of the HST observations were made before perihelion.

Figure 1. Projection of the orbit of 311P/PanSTARRS on the x–y plane, x–z plane, and y–z plane of the ecliptic coordinate system ECLIPJ2000. The outer cyan line corresponds to the orbit of 311P, and the inner one corresponds to the orbit of the Earth. The symbol ⋆ in the center represents the Sun. Cyan and red dots on different orbits represent the positions of 311P and the Earth at different observation epochs (2013 September 10, 2013 September 23, 2013 October 18, 2013 November 13, 2013 December 8, 2013 December 31, and 2014 February 11). The orbital simulation of 311P is performed with the N-body integrator REBOUND (Rein & Liu 2011).
Download figure:
Standard image High-resolution imageThe publicly accessible observations of 311P are acquired from the Mikulski Archive for Space Telescopes (MAST; see details of MAST in Padovani 1998). Data reduction and frame adding are completed with the Astroart software (Nicolini et al. 2003).
3. Dust Tail Morphology and Finson–Probstein Analysis
It is known that 311P manifests unique cometary characteristics, i.e., a compact coma and several extended tails. In order to make a morphological analysis of 311P and estimate the quantity of the dust in the tails, the set of raw HST data (available on the MAST website https://archive.stsci.edu) is used in this paper. For each image, cosmic ray removal is done within the full raw image (Joye & Mandel 2003). Cleaned images are obtained by interpolating regions of each image affected by cosmic rays using the average pixel count from regions surrounding each cosmic ray (Bertin & Arnouts 1996). We stack the images from the seven epochs separately to increase the signal-to-noise ratio (S/N) of the dust tails, and also apply a median subtraction algorithm to highlight the features of the structures of the outer tail (Piccardi 2004). Meanwhile, we apply brightness contour fitting to improve the clarity of the tails, with the aim of determining the accurate position angles of the tails (Bertin & Arnouts 1996).
We identify the morphology of 311P's tails from the observational data. First, the boundary of each tail in the image whose features have been enhanced is roughly determined manually. After that, we evaluate the local S/N to get the details of general tail structure, with the local resolution set to 4 × 4 pixels. Combining the tails' contours in each image, we obtain three streamers representing the boundaries and the brightest line of each tail, as shown in Figure 2. Note that the dust tail looks very faint from the image observed on 2014 February 11, but we still identify a line whose S/N reaches a value of 5 over a length of 214 at a position angle of 66°. Finally, the position angles and the lengths of the tails are obtained by fitting the morphologies of the tails using contours. The measurements of the tails' features are listed in Table 2.

Figure 2. Composite images of 311P/PanSTARRS. These images were taken during 2013 and 2014, and the specific date is marked in the upper left corner of each panel. The arrow marked with N denotes the direction of north, and the arrow marked with E denotes the direction of east. The arrows labeled with v and the solar symbol show the directions of 311P's motion and the solar orientation, respectively. A black dashed line denotes the brightest streamer of each tail, which limits the morphology of the tail together with the two adjacent red dashed borderlines. Due to the fading of the dust tail on 2014 February 11, only streamers with an S/N greater than 5 is displayed in the bottom-left panel.
Download figure:
Standard image High-resolution imageTable 2. Measurements of the Streamers in the Tails
| 2013 September 10 | 2013 September 23 | 2013 October 18 | ||||||||||
|---|---|---|---|---|---|---|---|---|---|---|---|---|
| Tail | Position Angle of the Streamer (°) | Length ('') | Position Angle of the Streamer | Length | Position Angle of the Streamer | Length | ||||||
| Upper | Brightest | Lower | Brightest | Upper | Brightest | Lower | Brightest | Upper | Brightest | Lower | Brightest | |
| A | 238 ± 1 | 235 ± 1 | 233 ± 0.5 | 21.5 | 236 ± 1 | 235 ± 0.5 | 234 ± 2 | 22.7 | 234 ± 0.5 | 233 ± 0.1 | 233 ± 1 | 24.7 |
| B | 220 ± 1 | 218 ± 0.5 | 217 ± 0.5 | 30.1 | 205 ± 3 | 201 ± 4 | 195 ± 3 | 35.3 | / | / | / | / |
| C | 215 ± 0.1 | 213 ± 0.5 | 210 ± 1 | 31.5 | / | / | / | / | / | / | / | / |
| D | 203 ± 0.1 | 202 ± 0.5 | 199 ± 2 | 26.3 | 155 ± 2 | 153 ± 1 | 151 ± 0.5 | 37.4 | / | / | / | / |
| E | 162 ± 1 | 161 ± 1 | 159 ± 0.5 | 25.6 | 115 ± 0.5 | 112 ± 0.5 | 108 ± 1 | 38.9 | 85 ± 1 | 84 ± 1 | 83 ± 0.5 | 37.2 |
| F | 143 ± 2 | 141 ± 0.1 | 140 ± 1 | 18.2 | / | / | / | / | / | / | / | / |
| G | / | / | / | / | 98 ± 1 | 96 ± 1 | 95 ± 1 | 19.7 | 83 ± 0.5 | 80 ± 1 | 78 ± 0.1 | 39.8 |
| H | / | / | / | / | / | / | / | / | / | / | / | / |
| I | / | / | / | / | / | / | / | / | / | / | / | / |
| 2013 November 13 | 2013 December 8 | 2013 December 31 | 2014 February 11 | ||||||||||||
|---|---|---|---|---|---|---|---|---|---|---|---|---|---|---|---|
| Position angle of the streamer | Length | Position angle of the streamer | Length | Position angle of the streamer | Length | Position angle of the streamer | Length | ||||||||
| Upper | Brightest | Lower | Brightest | Upper | Brightest | Lower | Brightest | Upper | Brightest | Lower | Brightest | Upper | Brightest | Lower | Brightest |
| 234 ± 0.1 | 233 ± 1 | 233 ± 0.5 | 22.7 | 247 ± 2 | 246 ± 3 | 245 ± 3 | 25.3 | 246 ± 3 | 245 ± 2 | 245 ± 1 | 30.1 | / | / | / | / |
| / | / | / | / | / | / | / | / | / | / | / | / | / | / | / | / |
| / | / | / | / | / | / | / | / | / | / | / | / | / | / | / | / |
| / | / | / | / | / | / | / | / | / | / | / | / | / | / | / | / |
| / | / | / | / | / | / | / | / | / | / | / | / | / | / | / | / |
| / | / | / | / | / | / | / | / | / | / | / | / | / | / | / | / |
| / | / | / | / | / | / | / | / | / | / | / | / | / | / | / | / |
| 73 ± 0.1 | 72 ± 0.5 | 70 ± 0.1 | 25.4 | 69 ± 0.3 | 68 ± 0.8 | 67 ± 0.2 | 34.2 | 67 ± 0.2 | 65 ± 0.3 | 64 ± 0.2 | 41.4 | / | / | / | / |
| / | / | / | / | / | / | / | / | / | / | / | / | / | 66 ± 2 | 21.4 | / |
Download table as: ASCIITypeset image
The physical properties of the dust can be derived by analyzing the morphology of 311P. The epochs of ejections can be derived from the position angles of the tails, the size range of dust particles can be deduced from the length of a tail, and an upper limit of the duration of the activity can be estimated from the measurement of the widths of the tails. After leaving the nucleus, the particles are mainly subjected to solar radiation pressure and solar gravity. The forces acting on particles are parameterized with the dimensionless constant β

which is further expressed as a parameter related to dust properties (Burns et al. 1979)

Here, Qpr is the scattering efficiency for solar radiation, and is assumed as 1. The variable ρd is the bulk density of dust in units of g cm−3, a is the particle radius in centimeters, and the constant Cpr = 5.76 × 10³ g cm−2. The variable β is inversely proportional to a, so for smaller grains the effect of solar radiation pressure on the motion of particles is stronger.
No dust trail was detected within 40'' of the nucleus on 2015 March 19, which is different from the active asteroid 354P (P/2010 A2), whose trail dominated by centimeter-sized particles was still visible more than four years after a mass-loss event. The absence of a dust trail (Jewitt et al. 2013b, 2018) may imply that the activity mechanism of 311P is different from that of 354P.
The upper limit of the grain size can be roughly estimated by analyzing the equilibrium between solar radiation pressure and 311P's gravitational force. Particles larger than the upper limit of the grain size will drop back to 311P's surface (Hui & Li 2017). Assuming that 311P is a prolate spheroid, with a long-axis radius of b, and two equal short-axis radii of a, where the ratio of these axes is b/a = 1.3 (Jewitt et al. 2018), according to Equation (6) of Hui & Li (2017), the minimum value of β that corresponds to the largest dust particle is estimated as

Here, c is the speed of light, G is the gravitational constant, re is the radius of the nucleus, ρd is the bulk density of the dust that is assumed to be 3.3 g cm−3, R is the heliocentric distance when 311P is active, A is the geometric albedo that is assumed to be 0.29 (Jewitt et al. 2015), f is the ratio of the axes, and S☉ is the solar constant (1361 W m−2). We derive that the minimum value of β of ejected particles is about 0.0002, which corresponds to an upper limit of the grain size of 5 mm approximately.
We adopt the Finson–Probstein theory to analyze the dust tails (Finson & Probstein 1968). The Finson–Probstein theory proposes the concept of the syndyne–synchrone diagram. A syndyne represents the loci of particles with the same value of β, while a synchrone represents the loci of particles released at the same time. In this paper, the ejection speed is assumed to be zero. We first verify the validity of the assumption of the zero ejection speed by using Equation (6) of Agarwal et al. (2016)

where the left side of the equation is the energy term of the particle, E is the particle's energy, and m is the particle's mass. The first item of the right side of the equation represents the energy per unit mass of 311P, En is 311P's energy, and mn is the mass of 311P. The variable vn is the speed of the nucleus, vej is the particle's relative velocity to 311P, G is the gravitational constant, M⊙ is the mass of the Sun, and R is the heliocentric distance of 311P. The assumption of a zero ejection velocity is valid if the term vn
vej is negligible compared to the solar radiation pressure term  by using Equation (7) of Agarwal et al. (2016), i.e.,

For 311P, vn ∼ 1.9 × 10⁴ m s−1 and R ∼ 2 au. For a minimum β of 0.0002 estimated by Equation (3), we obtain the minimum value of the right side of Equation (5) as 4.8 m s−1. Thus, for dust particles with a radius less than 5 mm, if vej ≪ 4.8 m s−1, the effect of the initial velocity on the evolution of particles is much smaller than that of solar radiation pressure, i.e., the zero ejection velocity assumption is valid. Later in this section, we will demonstrate that the majority of dust particles satisfy vej ≪ 4.8 m s−1.
We estimate the point-spread function (PSF) of each image by measuring the FWHM of the field star trails, and find that PSF of each image is narrower than one-third of the FWHM of each tail of 311P. Thus, the straight-band morphology of 311P's tails from the observational data can be analyzed by using a syndyne–synchrone diagram (Finson & Probstein 1968; Vincent 2014). We also estimate the projected width caused by the initial speed, and find that this value is much smaller than the width of each tail at the observation epoch, which indicates that the effect of the initial speed on the projected width of the tail is negligible. Here we take Tail F for instance, which contains the smallest particles with the largest initial speeds among all tails (as shown later in Table 3 and Equation (6)). Assuming that the component of the initial velocity perpendicular to the orbital plane is equal to the one in the orbital plane, the distance traveled by the smallest particle of Tail F in the direction perpendicular to the orbital plane due to the initial speed estimated by Equation (6) during the time interval between emission and observation (2013 September 10) is about 58 km, which is much smaller than the FWHM (∼480 km) at its maximum length. Therefore, the upper limit of the duration of each activity can be estimated from the width of the tail by using the synchrone analysis.
Table 3. Tail-fitting Analysis Results for 311P
| Tail | Starting Date | Upper Limit | Maximum Size | Minimum Size |
|---|---|---|---|---|
| of Emission | of Duration (days) | of Grains (mm) | of Grains (mm) | |
| A | March 23 | 8 | 38.90 | 1.95 |
| B | July 19 | 6 | 3.97 | 0.16 |
| C | July 26 | 3 | 3.13 | 0.11 |
| D | August 7 | 3 | 1.57 | 0.07 |
| E | August 26 | 5 | 0.35 | 0.03 |
| F | September 1 | 2 | 0.11 | 0.006 |
| G | September 12 | 5 | 0.16 | 0.007 |
| H | October 23 | 5 | 0.6 | 0.025 |
Download table as: ASCIITypeset image
The position of a dust grain relative to the nucleus depends on both the value of β and the difference between the observation epoch and release time (denoted as τ). To analyze the appearance of the dust tails, we plot a diagram of syndynes (loci of particles with constant β) and synchrones (loci of particles with constant τ) at various epochs in various dates of observations based on the Finson–Probstein model. In this diagram, the syndynes are calculated for β = 0.05, 0.02, 0.01, 0.005, 0.002, 0.001, 0.0005, 0.0002, 0.0001, 0.00005, 0.00002, and 0.00001, and each synchrone corresponds the trajectories of particles that were emitted simultaneously before each observation date with a step of 1 day. For better visualization, the more sparsely distributed syndynes and synchrones than what we use are shown in Figure 3.

Figure 3. Synchrones and syndynes of 311P/PanSTARRS. The blue dot at the origin denotes the position of 311P. The synchrones are shown as red dashed lines, with the dust release time prior to the date of the observation labeled as red texts, and the labeled dates increase anticlockwise with intervals of 3 days. The syndynes are drawn as blue solid lines, with the values of the grain radius (corresponding to different values of β) labeled as blue text. Celestial north is up, and east is to the left. The units of R.A. and decl. are arcseconds ('').
Download figure:
Standard image High-resolution imageTo determine the start epochs and end epochs of dust release and the value of β that can describe the dust tails, we fit syndyne–synchrone diagrams to the composite images, and select the syncurves which can best simulate the morphology of the tail. The epochs of dust emission and the size range of dust can be inferred by fitting the synchrones and the syndynes to the boundaries of the tails, respectively. For each tail, we fit all the observations at the different epochs with the syndyne–synchrone model. It is found that for the same tail the fitting results by using observations at different epochs are basically consistent with each other.
Inserting values of ρd = 3.3 × 10³ kg m−3 (Jewitt et al. 2015) to Equation (2), the particle radius a in microns is calculated by the formula by a = 1/β. The start and end times of the mass-loss events, and the size range of dust particles in each tail derived by the syncurve fitting process are summarized in Table 3. In the oldest Tail A, the size range of dust particles is roughly 2–40 mm, while the radius of the dust particles in the youngest Tail H is significantly smaller, ranging from about 0.025 to 0.6 mm. Note that the values of starting dates of emission are a bit different from the previous results of Jewitt et al. (2015). Possible reasons could be that the value of the S/N threshold used by us to define the boundaries of the dust tails is lower and the boundaries of the tails instead of the brightest line are used to fit the synchrones.
The ejection speed is estimated by the size-dependent velocity fitting formula from Moreno et al. (2014)

According to Table 3, the smallest grains are 0.006 mm (in Tail F), which gives a value of  as 0.016. Substituting
  into Equation (6) yields an upper limit of the ejection speed of 0.09 m s−1, the value of which satisfies Equation (5), which suggests that zero-velocity assumption is valid. Our estimation of the upper limit of the ejection speed (0.09 m s−1) is generally consistent with that of Jewitt et al. (2015) (0.03 m s−1).
4. Tail Surface Brightness
We adopt the photometric method by Hsieh et al. (2004) to analyze the surface brightness profiles of all tails that appear in the images. For this purpose, composite images of different dates are rotated to align the tails with the horizontal direction, and then the radial profile of each tail is extracted. We use two different sizes of rectangular apertures to measure the brightness of the tails and the sky background. For the tails, the size of each aperture used to determine the brightness is set to 12 pixels along the tail axis and 24 pixels in the direction perpendicular to the tail axis. The sky background is measured with two apertures of size of 12 × 12 pixels located above and below the measured aperture of the tails, and then is subtracted from the tail images. An illustration of this scheme can be found in Figure 7 in Hsieh et al. (2004).
For each tail, we measure the tail surface brightness along the tail axis within 18'' (15,000–30,000 km) away from the nucleus. The tails' surface brightness profiles are measured in counts per aperture width along the length of the tails, integrated across the perpendicular direction, normalized to the geocentric distance of 1 au, and then further normalized to the ratio of the average count rate from the tail to that from 311P's nucleus, which is measured with a 5 × 5 pixel box. This procedure facilitates the comparison of the brightness profile of the same tail between different observation dates. The value of displayed uncertainty is originated from the rms variation measured in the sky background. The readers are referred to Section 4.1 of Hsieh et al. (2004) for details of this photometric method.
The radial brightness profiles of different tails for seven dates of observations are shown in Figure 4. It is seen that the change in intensity is not exactly proportional to the distance from the nucleus. We describe the characteristics of eight tails' brightness profiles shown in Figure 4 as follows.

Figure 4. Surface brightness profiles of dust tails that are normalized to the brightness of the nucleus from 2013 September to December. The dust tail (Tail I) observed on 2014 February 11 is not considered due to its low S/N. The upper and lower horizontal axes show the radial distance from the nucleus in units of the radiation pressure parameter β and arcseconds, respectively.
Download figure:
Standard image High-resolution imageTail A: the brightness distribution ∑(l) of the tail is described by a power-law function as ∑(l) ∝ ls , where l is the angular distance along the tail from the nucleus in arcseconds as seen by the observer. On 2013 September 10 and 23, the brightness distribution of Tail A can be characterized by a shallow power-law function with index s = −0.25 ± 0.05. The exponent gradually reduced to 0 in the follow-up observations although the integrated brightness increased significantly on 2013 December 31. The peak of the curve at the radial distance of 9'' (12,000 km) on December 8 is produced by the incomplete removal of cosmic rays.
Tail B: detected on 2013 September 10 and 23. On 2013 September 10, the index s = −0.35 ± 0.07. The brightness profile of the dust tail became flatter and the integrated brightness decreased slightly on 2013 September 23.
Tail C: on 2013 September 10, the brightness profile of Tail C is similar to that of Tail B. On 2013 September 23, Tail C is difficult to distinguish from Tail B.
Tail D: at the first epoch of observation on 2013 September 10, the brightness followed a power-law distribution with a slope of about −0.5 within the measurable distance. On 2013 September 23, the brightness of the dust tail remained at a high level without obvious fluctuations.
Tail E: on September 10, the surface brightness followed a broken power-law distribution, i.e., the slope of the brightness profile was close to −1.58 ± 0.09 for the inner tail (1''–10''), while the slope was flatter (∼−0.4) for the outer tail. The bulge at 16'' (13,000 km) is attributed to a field star hidden under the tail. In the latter observation on September 23, it was found that the exponent s decreased to −1.81 ± 0.11 within a distance of 7'' (6000 km) from the nucleus.
Tail F: appeared only in the image observed on 2013 September 10.
Tail G: for Tail G, the slope of the brightness profile decreased with increasing distance from the nucleus, and the integrated brightness increased unusually from 2013 September 10 to 23. On 2013 November 13, Tail G was almost merged with Tail H.
Tail H: streamers with above-average S/Ns were detected in the direction of Tail G on 2013 November 13 and December 8 and 31. On November 13, the brightness profile satisfied a power-law distribution with index s = −0.81 ± 0.06 within a distance of 18'' (21,000 km) from the nucleus, and the slope reduced to −0.62 ± 0.04 on December 8 and −0.21 ± 0.02 on December 31. The integrated brightness of the dust tail showed a trend of gradual decrease with an increase of the observation epoch.
Usually, the brightness profile of a dust tail at a greater distances from the nucleus is flatter than that of the coma at a nearer distance to the nucleus (Rosenbush et al. 2017). Similarly, for all observing epochs of 311P, the brightness distribution of the outer tail was flatter than that of the inner tail. It is also found that our results are generally consistent with Figure 10 of Jewitt et al. (2015) where the surface brightness profiles of Tails D, E, G, and H at certain selected epochs were shown.
5. Total Mass of Dust in the Tails
In this paper, the total dust mass of each tail is approximated as the dust mass within the region of 18'' (15,000–30,000 km) from the nucleus, where most dust particles of each tail are located. The dust quantity in the first observation of each tail could give the best approximation of the total dust mass compared to the later observations, because over time some dust particles are pushed away from the region (18'' relative to the nucleus) within which we calculate the dust mass. Besides, the S/N of the first observation is the highest (the error introduced by the sky background is the lowest). Thus, we choose the earliest observation for each tail to analyze. We have found that the value of the size distribution indices calculated by using the later observations are consistent with the one found by using the first observation.
In order to estimate the total mass of dust in each tail, we use a sequence of linear apertures perpendicular to the tail with a size of 1 × 24 pixels to evaluate the flux along the tail axis. By employing Equation (2) of Jewitt & Luu (2019), the effective scattering cross-section per pixel, Ce [km2], is related to the absolute magnitude of each pixel, by

where Hpix is the absolute magnitude of each pixel, which is derived from the heliocentric and geocentric distances, the phase angle, the photometric zero-point, and the flux in CCD ADUs per pixel.
We adopt the photometric method by Hainaut et al. (2012), which is summarized as follows. The total cross-sectional area of a single aperture is obtained by adding the contribution of each pixel in this aperture. The tails' brightness distribution as a function of the distance to the nucleus constitutes a "grain radius spectrum" of the dust, and the total cross-sectional area in each single aperture is converted to the number of dust grains at the given distance from the nucleus. Two assumptions (Hainaut et al. 2012) are made regarding the physical properties of the dust particles:
- 1.Based on the Finson–Probstein model used in Section 3, the tails of 311P are considered as several collections of synchrones.
- 2.All particles contained within a single aperture in the dust tails are assumed to be of the same grain size.
Following the above method, the number of particles for different grain radii in the eight tails are determined and shown in Figure 5. A power-law relation n(a)da ∝ aq da is fitted to the distribution of the grain sizes of tails in Figure 5, leading to exponents of q = −2.29, −1.97, −1.88, −1.78, −1.57, −2.11, −1.45, and −1.67 for Tails A to H, respectively. We find that for all tails except Tail H, the dust size distributions are steeper for tails with a larger average grain size (Figure 6). Besides, the dust distribution profiles of 311P's tails are similar to those of the two tails of (6478) Gault, of which the dust size distribution indices are ∼−1.64 and ∼−1.70 in 2018, respectively (Kleyna et al. 2019).

Figure 5. The number of particles vs. grain radius (black lines). The number of grains is integrated across the whole tail in the direction perpendicular to the tail in the photometry aperture. The red lines are linear fit to the dust size distributions, and the power indices of the distribution functions are, for Tails A to H, −2.29, −1.97, −1.88, −1.78, −1.57, −2.11, −1.45, and −1.67, respectively.
Download figure:
Standard image High-resolution image
Figure 6. Size distribution index as a function of the average radius of the particles. The eight tails are indicated by red pentagons. The irregularity of the circled point (Tail H) may be attributed to obstruction by the coma.
Download figure:
Standard image High-resolution imageThe mass of particles in the tails, which are obtained by integrating dust grains of each single aperture starting from the nucleus, are shown in Figure 7. It is seen that compared to the oldest Tail A, the total mass of the youngest Tail H is an order of magnitude smaller. From Figure 7 we estimate that 311P ejected at least 3 × 10⁷ kg of dust between 2013 March and October, and the total mass of ejecta is equivalent to a sphere with a radius of 13 m. Our estimation of the total mass is an order of magnitude larger than that of Jewitt et al. (2015). The main reason for this difference is that Jewitt et al. (2015) estimated the quantities of dust particles within a radius of 59 around the nucleus, while we estimate the total mass of dust grains populating all tails within 18'' around the nucleus. In other words, our estimation includes small- and medium-sized particles at further distances from the nucleus. It was estimated by Hainaut et al. (2014) that the total mass of dust for particles smaller than 1.5 mm is about 2.9 × 10⁷ kg, which agrees well with our results.

Figure 7. The average grain size, the integrated mass of each tail, and the radius of an equal-mass sphere. Each graph contains the following information: (1) the average grain size along the radial distance of the tail from the nucleus (black line); (2) the total mass of dust obtained by integrating the mass of particles along the radial distance of the tail from the nucleus (green line); and (3) the radius of an equal-mass sphere, where the mass is obtained by integrating the mass of particles along the radial distance of the tail from the nucleus (blue line).
Download figure:
Standard image High-resolution imageMass-loss rates are estimated by combining with the upper limit of the duration of each eruption in Section 3, which are 11.7 kg s−1 for Tail A, 13.6 kg s−1 for Tail B, 30.3 kg s−1 for Tail C, 5.8 kg s−1 for Tail D, 1.56 kg s−1 for Tail E, 4.6 kg s−1 for Tail F, 1.08 kg s−1 for Tail G, and 6.6 kg s−1 for Tail H, respectively.
6. Discussion
In this section the possible activity mechanisms of 311P are discussed. We first examine the possibility of ice sublimation as the driving mechanism of 311P's activities. The surface temperature of a main-belt comet is associated with its orbital location (Snodgrass et al. 2017). Assuming the Sun as a blackbody, the equilibrium surface temperature of an asteroid is derived as

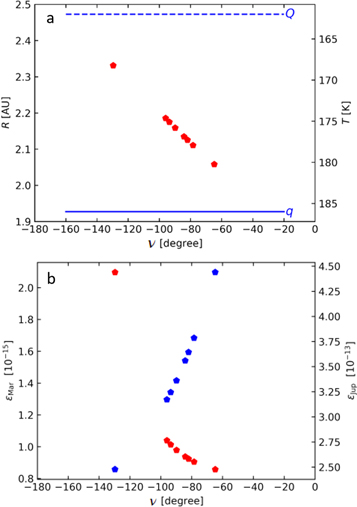
where rSun = 6.957 × 10⁸ m is the solar radius and TSun = 5777 K is the effective temperature of the Sun. From Equation (8) it is estimated that 311P experiences temperatures ranging from ∼162 K at aphelion to ∼186 K at perihelion. Consequently, the active asteroid 311P, located within 5 au from the Sun, is subjected to temperatures that are not low enough for water ice to form (Snodgrass et al. 2017; Chandler et al. 2019). Besides, Figure 8(a) shows the variations of the heliocentric distance and the surface temperature as functions of the true anomaly of 311P at the start time of emission, and it is found that the sequence of activity began near aphelion and ceased before perihelion, which is different from what is expected for sublimation-driven activity.
Figure 8. (a) The heliocentric distance and the surface temperature as functions of the true anomaly of 311P at the start time of emission (see Table 3). The emission activities are indicated by red pentagons. Heliocentric distance and surface temperature of 311P when it passed through perihelion q (blue solid line) and aphelion Q (blue dashed line) are shown. (b) Dimensionless strengths of the tidal effects caused by Mars (red pentagon) and Jupiter (blue pentagon) at the surface of 311P as functions of the true anomaly of 311P at the start time of emission. Here, the dimensionless strength of the tidal effect is the ratio of the tidal force caused by the planet relative to the internal gravity of 311P at the surface of 311P (Equation (9)).
Download figure:
Standard image High-resolution image
We also examine the effects of the tidal force caused by Mars and Jupiter. A rough estimate of the tidal effect is obtained by the dimensionless parameter ε

where FT and FG are the tidal force of the planet and the internal gravity of 311P at the surface of 311P, respectively. Figure 8(b) shows that at the start time of emission the strength of the tidal effect caused by Mars is only of the order of 10−2 of that caused by Jupiter, and the effect of Jupiter's tidal force on 311P is only of the order of about 10−13 of the internal gravity of 311P. Thus, it is unlikely that 311P's activities are correlated with tidal forces caused by Jupiter and Mars.
Another possible driving mechanism is impacts. 311P had experienced multiple eruptions, and the likelihood of 311P being hit repeatedly within eight months is low. However, we cannot exclude the possibility that an initial impact-driven event on 311P destabilized the structure of the nucleus and triggered the subsequent activities.
It has been suggested by Jewitt et al. (2013a, 2015) that disruption due to rotational instability of the nucleus is a possible origin for the emission activities of 311P. There is no strong evidence against this activation process. Besides, the indices of the dust size distributions of the tails (Figure 6) are close to that of the power-law distributions of self-organized critical sandpiles (Laurson et al. 2005). We speculate that 311P may have been initially activated by rotational instability or impacts in 2013 March, and several avalanches of the dust distributed on the surface were triggered and part of the avalanched dust debris was eventually detached from the nucleus.
7. Conclusions
311P/PanSTARRS experienced several mass-loss events during 2013. To derive the dust environment around the nucleus, we analyze observational images of the dust tails of 311P obtained from MAST. The main conclusions of this paper are listed as follows:
- 1.The position angles of 311P's tails ranged from 64° to 238°. The longest dust tail is Tail H observed on 2013 December 31, with a length of 414 (∼71,000 km). The shortest dust tail is Tail F observed on 2013 September 10, with a length of 182 (∼15,000 km).
- 2.A syndyne–synchrone diagram analysis shows that the estimated upper limits of the durations of the mass-loss events ranged from 2 days (Tail F) to 8 days (Tail A). The upper limit of the grain radius that dominates the dust in tails is 38.9 mm and the corresponding lower limit is 6 μm.
- 3.For all tails, the brightness profiles followed a power-law distribution with an index that ranged from approximately −1.81 to 0, and the size distribution indices ranged from −2.29 to −1.45. The masses of particles in the different tails ranged from 0.5 to 8 × 10⁶ kg, and the total mass of dust is m ∼ 3 × 10⁷ kg. The average mass-loss rate is approximately 1.59 kg s−1.
- 4.Analysis of the activities of 311P shows that the possibilities of sublimation, continuous impacts, or tidal forces of planets as the origin of the activities can be ruled out. Activation by rotational instability remains a possibility without strong evidence against it.
Acknowledgments
This work was supported by the National Natural Science Foundation of China (No. 12002397 and 12311530055), the National Key R&D Program of China (No. 2020YFC2201202 and 2020YFC2201101), grants from The Science and Technology Development Fund, Macau SAR (File No. 0051/2021/A1), and by the Shenzhen Science and Technology Program (grant No. ZDSYS20210623091808026). We thank Man-To Hui for helpful discussions and suggestions. We thank Yijun Zou for her productive suggestions. The data used in this work can be found in the Mikulski Archive for Space Telescopes (MAST) at the Space Telescope Science Institute via doi:10.17909/59gh-3310.
Data Availability
The data used in this work are generated as detailed in the text and will be shared on reasonable request to the corresponding author.