


Abstract
The cool hypergiant star RW Cephei is currently in a deep photometric minimum that began several years ago. This event bears a strong similarity to the Great Dimming of the red supergiant Betelgeuse that occurred in 2019–2020. We present the first resolved images of RW Cephei that we obtained with the CHARA Array interferometer. The angular diameter and Gaia distance estimates indicate a stellar radius of 900–1760 R⊙, which makes RW Cephei one of the largest stars known in the Milky Way. The reconstructed, near-infrared images show a striking asymmetry in the disk illumination with a bright patch offset from the center and a darker zone to the west. The imaging results depend on assumptions made about the extended flux, and we present two cases with and without allowing extended emission. We also present a recent near-infrared spectrum of RW Cep that demonstrates that the fading is much larger at visual wavelengths compared to that at near-infrared wavelengths as expected for extinction by dust. We suggest that the star's dimming is the result of a recent surface mass ejection event that created a dust cloud that now partially blocks the stellar photosphere.
Export citation and abstract BibTeX RIS

Original content from this work may be used under the terms of the Creative Commons Attribution 4.0 licence. Any further distribution of this work must maintain attribution to the author(s) and the title of the work, journal citation and DOI.
1. Introduction
The recent Great Dimming of Betelgeuse provided an opportunity to study the dynamics of mass loss in a relatively nearby red supergiant (summarized by Dupree et al. 2022). During the months before the fading (2019 January–November), the spectrum of Betelgeuse indicated an outflow from the photosphere that was possibly related to a large convective upwelling (Kravchenko et al. 2021; Jadlovský et al. 2023). This probably led to a surface mass ejection of a large gas cloud that cooled and formed dust and increased the visible-band extinction (Taniguchi et al. 2022). Montargès et al. (2021) obtained angularly resolved images of Betelgeuse with the Very Large Telescope (VLT) SPHERE-ZIMPOL around the deep minimum when the star had faded by 1.2 mag in the V band (2019 December–2020 March). Their images showed that the southern hemisphere was much darker than in pre-minimum images, suggesting that the fading was the result of partial extinction by a foreground dust cloud seen against a slightly cooler photospheric disk. The mass lost during this ejection was comparable to that for a full year of steady outflow (Montargès et al. 2021), indicating that episodic mass ejections in supergiants constitute a significant fraction of their total mass loss (Humphreys & Jones 2022; Massey et al. 2023).
The cool hypergiant RW Cephei (HD 212466) is now presenting us with a second opportunity to explore episodic mass loss at high angular resolution. Its spectrum indicates a very high luminosity (classified as K2 0-Ia by Keenan & McNeil 1989), and the spectral line shapes suggest complex photospheric motions and outflow (Merrill & Wilson 1956; Josselin & Plez 2007). The star is a yellow semiregular variable, and it displays modest photometric variations on a timescale of about a year (Percy & Kolin 2000). However, recent photometric measurements by Vollmann & Sigismondi (2022), AAVSO observers (https://www.aavso.org/LCGv2/static.htm?DateFormat=Julian&RequestedBands=V&Grid=true&view=api.delim&ident=rwcep&fromjd=2457300&obscode=VOL&delimiter=@@@), 11 and the Kamogata/Kiso/Kyoto Wide-field Survey 12 (KWS; Maehara 2014) show that RW Cep is now undergoing its own great dimming episode (Figure 1). By the end of 2022, RW Cep had faded by 1.1 mag in V band to become fainter than at any time in the last century. Furthermore, the star became redder (larger V − Ic ) as it faded. At the time of writing (2023 June), it appears to have passed its point of minimum light and is slowly brightening again.

Figure 1. The V-band light curve (lower panel) and V − Ic color index (upper panel) of RW Cep over the past seven years. The lower panel shows the V-band light curve from the AAVSO archive (plus signs; mainly from observations made by W. Vollman) and the KWS (diamond symbols). The KWS includes estimates of the Johnson-Cousins Ic -band magnitude, and the top panel shows the time evolution of the V − Ic color index. The top axis gives the calendar date (BY) of the observation. The vertical dashed line indicates the date of the CHARA Array observation. For comparison purposes, the dotted line in the lower panel shows the Great Dimming of Betelgeuse from Taniguchi et al. (2022) for their 0.51 μm band photometry (seven point averages, offset by +1040 days in time and by +5.2 in magnitude).
Download figure:
Standard image High-resolution imageVisible-band spectra made in 2022 December by Leadbeater (2023) show a good match to that of a K4 I spectral template with an interstellar reddening of E(B − V) = 0.65 mag. High-resolution spectra 13 made by R. Leadbeater 14 and by J. Guarro Fló 15 show evidence of a narrow Hα emission line that was absent in ELODIE spectra of the star that were made between 1999 and 2005. This emission may be associated with excess mass loss during the current episode. The star has a strong infrared flux excess that forms in a dust envelope (Gehrz & Woolf 1971; Rowan-Robinson & Harris 1982; Jones et al. 2023). It appears slightly extended (diameter ≈ 1'') in high-resolution, mid-infrared images (see Figure A.3 in Shenoy 2016 and Figure 1 in Jones et al. 2023) indicating a long history of mass loss.
Here we present the first interferometric images of RW Cep that we made recently with the Center for High Angular Resolution Astronomy (CHARA) Array, and these show striking similarities to the asymmetries seen in the VLT images of Betelgeuse. We describe the interferometric observations and derived images in Section 2, and we present a recently obtained near-infrared (NIR) flux spectrum in Section 3. A comparison is made of the spectral energy distribution (SED) before and during the fading event in Section 4. We discuss the implications of these observations for models of dimming and mass ejection in Section 5.
2. Interferometric Images
We obtained a single observation of RW Cep with the CHARA Array (ten Brummelaar et al. 2005; Schaefer et al. 2020) on 2022 December 23 UT. We used only five of the six Array telescopes because the S1 telescope had insufficient available delay length for the star's position in the northwestern sky at the time of the observations. We used the dual beam combiners MIRC-X (Anugu et al. 2020) for the NIR H band (1.50–1.74 μm) and MYSTIC for the K band (2.00–2.37 μm; Monnier et al. 2018; Setterholm et al. 2022). The observations were made with a spectral resolving power of R = 190 and 100 for MIRC-X and MYSTIC, respectively. The nominal angular resolution is approximately 0.5 and 0.6 mas, respectively. These beam combiners use the telescopes of the Array to collect interferometric fringe measurements for a large range in baseline over much of the (u, v) spatial frequency plane (Figure 2).

Figure 2. The spatial frequency coverage in the (u, v) plane for the H-band (left) and K-band (right) observations. The lower color legends show the corresponding wavelength channels.
Download figure:
Standard image High-resolution imageThe measurements were reduced using the standard MIRC-X/MYSTIC pipeline (version 1.4.0; Anugu et al. 2020). Calibrator observations were made of HD 219080 (before the science target) and were used to correct for atmospheric and instrumental effects to obtain absolute-calibrated visibilities V2, closure phases (CPs), and triple amplitudes (T3A). The calibrator diameter (0.69 mas for a uniform disk) was adopted from the JMMC Stellar Diameters Catalog (JSDC; Bourgés et al. 2017). The derived visibilities and CPs are shown in Figures 3 and 4 for the H and K bands, respectively. The star is clearly resolved in both bands (visibility declining with larger spatial frequency), and the data show evidence of an asymmetric flux distribution (nonzero and non-π CP).

Figure 3. The H-band visibilities (left) and CPs (right) for the telescope pair and triplet MIRC-X observations of RW Cep. The black symbols with vertical error bars are the measurements and the red dots represent the corresponding fits from the SQUEEZE reconstructed images. The lower panels show the residuals from the SQUEEZE fits. The fits from the OITOOLS and SURFING reconstructions yield residuals that are qualitatively similar in appearance.
Download figure:
Standard image High-resolution image
Figure 4. The K-band visibilities (left) and CPs (right) in the same format as Figure 3.
Download figure:
Standard image High-resolution imageWe first fit the interferometric visibilities V2 using an analytical model of a uniformly bright circular disk for the star with an incoherent background flux on larger spatial scales overresolved in the CHARA Array observations. The fits were made over different wavelength ranges using the code PMOIRED
16
(Mérand 2022). Table 1 lists the derived values of the background flux fraction, uniform disk angular diameter θ = θUD, and reduced chi-squared  of the fit of the visibilities. The first row gives the H-band fits of the MIRC-X measurements, and the second and third rows give the K-band results from MYSTIC in the K-band pseudocontinuum and in the CO bands, respectively (see Figure 8 below). The angular diameter is found to increase in size with wavelength and appears to be significantly larger in the CO bands (row 3). This is evidence of an extended atmospheric extension in the CO bands that is also observed in other cool, luminous stars (Perrin et al. 2005; Tsuji 2006; Le Bouquin et al. 2009; Ohnaka et al. 2011; Montargès et al. 2014). There is an extended background flux that generally forms a larger fraction of the total flux at longer wavelength. We suspect that this flux originates in extended dust emission that reaches an angular size of order 1'' at 10 μm (Shenoy 2016; Jones et al. 2023).
Table 1. Angular Diameter Estimates
| Method | Wavelength | Background | θ |

|

|

|
|---|---|---|---|---|---|---|
| (μm) | Fraction | (mas) | (V2) | (CP) | (T3A) | |
| PMOIRED UD | 1.50–1.72 | 0.09 ± 0.02 | 2.44 ± 0.02 | 3.8 | ⋯ | ⋯ |
| PMOIRED UD | 1.98–2.29 | 0.17 ± 0.01 | 2.63 ± 0.02 | 4.2 | ⋯ | ⋯ |
| PMOIRED UD | 2.31–2.37 | 0.15 ± 0.01 | 3.21 ± 0.02 | 2.6 | ⋯ | ⋯ |
| SQUEEZE | 1.50–1.72 | 0.19 | 2.26–2.69 | 1.37 | 1.24 | 1.35 |
| SQUEEZE | 1.98–2.29 | 0.17 | 2.08–2.66 | 1.12 | 1.73 | 1.01 |
| OITOOLS | 1.50–1.72 | 0.09 | 2.41 | 1.29 | 1.10 | 0.54 |
| OITOOLS | 1.98–2.29 | 0.08 | 2.35 | 1.26 | 2.28 | 0.59 |
| SURFING | 1.50–1.72 | 0.08 | 2.45 | 2.77 | 2.92 | 1.13 |
| SURFING | 2.11–2.28 | 0.06 | 2.44 | 1.32 | 7.91 | 0.88 |
| SED fit | 0.35–2.20 | 0 | 2.58 ± 0.16 | ⋯ | ⋯ | ⋯ |
Download table as: ASCIITypeset image
The relatively high quality of the visibility and CP measurements encouraged us to derive aperture synthesis images that make good fits to the observations. We caution at the outset that this data set is not ideal for image reconstruction. The observations were made only over a duration of one hour when the star was already at a large hour angle, and only five of the six telescopes were available. Consequently, the (u, v) spatial frequency coverage is underrepresented in some sky orientations, and the effective angular resolution is better in the north–south directions compared to the east–west directions (Figure 2). Consequently, the spatial resolution in the reconstructed images varies with position angle and is poor at position angles near +60° and −40° (both ±180°). Furthermore, the star has a relatively small angular size, and any small-scale structured flux in the extended emission will complicate the image reconstruction of the star itself.
We first used the SQUEEZE image reconstruction software 17 (Baron et al. 2010, 2012) to make the images. Positivity was enforced, and we used the edge-preserving ℓ2 − ℓ1 regularization (Le Besnerais et al. 2008) with the hyperparameter weight determined by the classical L-curve method. To avoid getting trapped in local minima in the solution space, 50 initial reconstructions were started from random images. The solutions converged into images with similar appearance, and these trials were then coregistered and averaged to obtain representative images. The reduced χ2 values were 1.37 for the MIRC-X data fits and 3.7 for the MYSTIC data fits, suggesting much stronger chromaticity (wavelength dependence) for the latter. For the MYSTIC data, we removed the spectral channels containing the CO bands to perform an image reconstruction in the K-band pseudocontinuum. We obtained a lower reduced χ2 ∼ 1.12 by omitting those long wavelength bins that record the CO bands.
The SQUEEZE reconstructed images are shown in the top panels of Figure 5 for each of the H-band and wavelength-restricted K-band observations. These are 6.4 × 6.4 mas images (64 × 64 pixels) with an orientation of north to the top and east to the left. There is a clear asymmetry evident in the images with a brighter zone toward the northeast limb and a darker (and possibly extended) zone toward the western side. We experimented with several other choices of regularizer for the image reconstruction, and the same large-scale asymmetry appears in those images. The mean background and diameter estimates from the SQUEEZE images are given in Table 1.

Figure 5. The H-band (top left) and K-band (top right) images of RW Cep made using the SQUEEZE algorithm. The color bar at right shows the correspondence between broadband specific intensity (normalized to the brightest pixel) and image color. The lower panels show the corresponding images reconstructed from the same (u, v) sampling of a model image of a limb-darkened star.
Download figure:
Standard image High-resolution imageThe aspherical shape and possible limb extensions that characterize the SQUEEZE images may have a physical rather than instrumental origin. Models of mass loss in red supergiant stars by Höfner & Freytag (2019) indicate that such stars may have extended clumpy regions that create shell-like features, and observations of the hypergiant VY CMa by Humphreys et al. (2021) show the presence of clumps and knot structures close to the star. López Ariste et al. (2023) obtained spectropolarimetry of the hypergiant star μ Cep that they interpret in terms of rising convective plumes that reach a radius of 1.1 R⋆. Thus, the irregular shape of RW Cep in the SQUEEZE image reconstructions may be due to the combined effects of extended plume emission and localized dust emission and absorption (together creating only a modest change in the overall flux; see Table 2 in Section 4).
We were concerned that the boxy image structure might be due to the limited (u, v) coverage of the observations (see Figure 2), so we performed a numerical test to check if the aspherical appearance is due to the star itself. We created a model of a spherical, limb-darkened disk (power law) using the angular diameter θ determined from the OITOOLS reconstructions described below (see Table 1). Then we used these model images to generate the OIFITS data sets that would have been observed for these simple disks. We performed SQUEEZE reconstructions from the model data using the same (u, v) coverage and noise levels associated with the observations. The resulting SQUEEZE images are shown in the bottom row of Figure 5, and these appear more or less circular as expected. These tests indicate that the unusual shape of RW Cep in the SQUEEZE images reconstructed from the observations probably does not have an instrumental explanation, but that the stellar shape is sculpted by dynamical processes in its outer layers.
It is worthwhile considering how the star would appear if the image reconstruction instead is confined to within the stellar radius, and the star is surrounded by diffuse, overresolved background light. We did this by making sets of images that constrain the structured flux to fall within a circle defined by the stellar photosphere. We adjusted the uncertainties in the measurements in these cases by adding a 10% relative error and a 0.0002 additive correction for ΔV2 and adding a minimum error of 1° for the CP errors. These revisions account for possible systematic uncertainties. A set of OITOOLS images were obtained using the OITOOLS.jl software suite. 18 The initial starting images consisted of the best-fitting uniform disks derived for the MIRC-X and MYSTIC data sets. The regularization was set up to use a combination of image centering, compactness, and ℓ1 − ℓ2 edge-preserving smoothness (Thiébaut & Young 2017), where the compactness prior was set as the starting image. The H- and K-band images from the OITOOLS reconstructions (for 128 × 128 pixels) are shown in the top panels of Figure 6, and the associated background and angular diameter estimates are given in Table 1. The star appears to be larger and more circular using this method, but some of the same flux asymmetries found in the SQUEEZE images are also recovered here but with lower contrast.
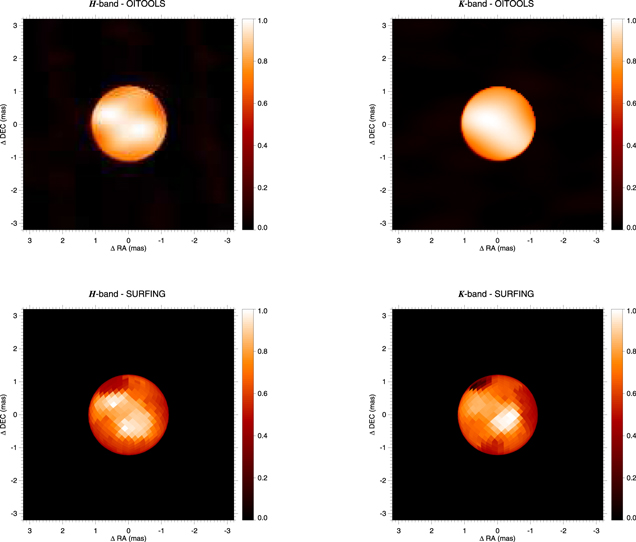
Figure 6. The H-band (left) and K-band (right) images of RW Cep made using the OITOOLS (top), and SURFING (bottom) algorithms based upon fitting the specific intensity within the stellar disk only. The color bar at right shows the correspondence between broadband specific intensity (normalized to the brightest pixel) and image color.
Download figure:
Standard image High-resolution imageOne more set of image reconstructions were made using the SURFING algorithm (Roettenbacher et al. 2016; Martinez et al. 2021) that assigns a specific intensity to each element on the three-dimensional surface of the star. The first step was to find a best-fit limb-darkened angular diameter that acts as the outer boundary on the assigned flux. The best-fit diameters θ = θLD are listed in Table 1, and these were derived assuming a power-law limb-darkening relation, I(μ)/I(μ = 1) = μα , where μ is the cosine of the angle between the surface normal and line of sight and α = 0.26. The SURFING algorithm was then applied iteratively to solve for the surface element brightness (in this case only for elements on the visible hemisphere). We show in the lower panels of Figure 6 one pair of images among the final set of walker solutions (1024 × 1024 pixels of size 0.005 mas, inset into a uniform background zone). The H- and K-band images appear similar to each other and show a bright patch offset from the center and a darkening to the western limb. We also created a set of images using the ROTIR code (Martinez et al. 2021) that likewise assigns flux to surface patches on a rotating star, and these images are qualitatively similar to those derived using SURFING.
The SQUEEZE, OITOOLS, and SURFING images show some similarities but also some significant differences in appearance. The SQUEEZE images (Figure 5) were made with the fewest assumptions about the expected appearance. The star in the SQUEEZE images is noncircular and boxy in appearance with sides tilted by about 20° relative to north. The star appears darker on its western limb, and the brightest zone is positioned northeast of the center. The K-band image shows greater contrast across the disk and the limb is spread over a larger span in radius. We show in Section 3 below that dust emission begins to become a flux contributor in the K band, and the dust opacity can create both emission (off of the stellar disk) and absorption (projected against the disk).
The OITOOLS and SURFING images (Figure 6) restrain the reconstructed flux to the star. They show darker limbs (especially the western limb) coincident with the boxy sides seen in the SQUEEZE images. There is also a bright off-center patch that appears toward the northeast (southwest) in the OITOOLS (SURFING) K-band images, while two offset patches appear in the H-band images. The differences in bright-zone position may result from the neglect of structured off-disk light in these two algorithms. Note that the total amount of off-disk flux is about two times larger in the SQUEEZE reconstructed images compared to the OITOOLS and SURFING images (see the background fraction given in Table 1).
The surface intensity distribution of red supergiants is probably dominated by hot, rising convection cells (Chiavassa et al. 2009; Norris et al. 2021), but in the case of hypergiants, mass loss becomes the dominant process that shapes the intensity distribution (Höfner & Freytag 2019; Humphreys & Jones 2022). We expect that the local mass-loss rate may vary with position on the star due to the kinematics and radiation of hot convective cells, and the observational consequences may be especially important at the stellar limb where hotter gas can create spatially extended emission. The SQUEEZE images were made without any geometric assumptions about spherical symmetry, and the irregular stellar shape in these images may reflect the spatial variation in mass-loss rate.
3. NIR Spectroscopy
We obtained complementary NIR spectroscopy of RW Cep using the TripleSpec instrument at the 3.5 m telescope of the Apache Point Observatory (Wilson et al. 2004). TripleSpec records the NIR spectrum over the wavelength range of 0.9–2.5 μm with a spectral resolving power of R = 3500. The observations were obtained on 2023 January 9 and 12 in good sky conditions. We made sets of the standard ABBA exposure nodding pattern for slit offset positions A and B for subtraction of the sky background. In order to avoid saturation of the detector for the bright flux of RW Cep, the telescope was defocused to create a broad (and double-peaked) spatial profile across the spectrograph slit. We made multiple observations of RW Cep and a nearby flux calibrator star α Lac (HD 213558; A1 V) with single exposure times of 1–2 s and 8–12 s, respectively.
The spectra were reduced, extracted, and combined using a version of the IDL Spextool software (Cushing et al. 2004) modified for TripleSpec. 19 The pipeline includes flat field division, wavelength calibration based upon the atmospheric airglow emission lines in the stellar spectra, and spectrum extraction. The atmospheric telluric lines were removed and a flux calibration applied using the IDL code Xtelluric (Vacca et al. 2003). This procedure uses a high spectral resolving power model spectrum of the A0 V star Vega that is fit to the spectrum of the flux calibrator α Lac to remove the stellar lines, and then the normalized result is used to extract the atmospheric telluric lines. The final step is to set the absolute flux calibration by transforming the model Vega spectrum into a representation of calibrator star spectrum by scaling and reddening according to the calibrator star's B and V magnitudes. However, small differences between the α Lac (A1 V) and Vega (A0 Va) spectra can amount to large uncertainties in the estimated flux in the NIR part of the spectrum. We checked the NIR flux estimates by comparing the transformed Vega spectrum with observed fluxes for the calibrator star α Lac from published photometry collected in the VizieR Photometry Tool 20 by Anne-Camille Simon and Thomas Boch. We found that the transformed Vega spectrum used by Xtelluric to model the spectrum of α Lac actually overestimated the observed flux by about 12% in the JHK bands, so we applied a wavelength-dependent correction to the RW Cep fluxes to account for the discrepancy between the applied and actual fluxes of the calibrator star α Lac. The final spectrum of RW Cep is shown in Figure 7. We estimate that the absolute flux calibration has an uncertainty of approximately 10% based upon the scatter between sets of observations and the errors introduced in setting fluxes from the calibrator star α Lac.

Figure 7. The NIR spectrum of RW Cep made during the dimming event (from APO; shown in black) compared to an archival spectrum associated with normal brightness (from the IRTF Spectral Library; shown in dark gray). A model BT-Dusty spectrum is shown (light gray) with an offset of −0.5 × 10⁻¹¹ erg s−1 cm−2 Å−1 (see Section 4). All the spectra are rebinned to a resolving power of R = 1000 for ease of comparison.
Download figure:
Standard image High-resolution imageA NIR spectrum of RW Cep in the predimming state (from 2005 August 26) is available from the IRTF Spectral Library 21 (Rayner et al. 2009), and a corrected version of this spectrum is plotted for comparison in Figure 7. The original IRTF spectrum was flux calibrated based upon Two Micron All Sky Survey (2MASS) magnitudes that unfortunately have large uncertainties (±0.2 mag) for such a bright target. In the next section, we consider fluxes in the bright state from published photometry (see Table 2 in Section 4). A comparison of the average fluxes over the JHK bands in the IRTF spectrum with the bright state photometric values indicates that the IRTF spectrum is approximately 15% fainter than expected. Consequently, we applied a wavelength-dependent flux correction to bring the IRTF spectrum into consistency with the photometry, and it is the corrected version that is plotted in Figure 7. This spectrum has associated flux uncertainties of about 10% (0.1 mag).
The recent spectrum made during the dimming event is somewhat fainter than the archival spectrum by an amount that is larger at shorter wavelengths. The magnitude change from a comparison of the spectra (Table 2) is ΔJ = +0.10 ± 0.19 mag, ΔH = +0.08 ± 0.19 mag, and ΔK = + 0.11 ± 0.25 mag. Together with the visual magnitude estimates (see Figure 1), it appears that RW Cep has faded by approximately 1.1, 0.7, and 0.1 mag in the V, Ic , and JHK bands, respectively (see Figure 9 below).
The predimming and dimming event spectra appear similar, but there are several significant differences. We see that the continuum slope in the K band is less steep in the dimming event spectrum, and this suggests that there is an additional flux component now present that increases in strength with wavelength, as expected for dust emission. Several of the absorption lines appear somewhat deeper, implying a slightly cooler photospheric temperature. In particular, the CO 2.29 μm absorption is now much deeper than in the archival spectrum (Figure 8). Messineo et al. (2021) discuss a number of absorption features in the spectra of late-type giants and supergiants (including RW Cep) that are sensitive to stellar effective temperature, and they find that the CO feature grows quickly in strength with declining temperature (see their Figure 11, top left panel). Based upon their fit of the temperature dependence of the CO line strength, we estimate that the photospheric spectrum indicates a drop from 4200 K (for the archival spectrum) to 3900 K during the current faint state (or somewhat less if the absorption strength is reduced by dust emission in the K band).

Figure 8. The NIR spectrum of RW Cep near the CO bandhead made during the dimming event (from APO; shown in black) compared to an archival spectrum associated with normal brightness (from the IRTF Spectral Library; shown in dark gray). Both spectra are rebinned to a resolving power of R = 1000 for ease of comparison. The dotted line in the lower panel shows the difference (new minus archival).
Download figure:
Standard image High-resolution imageWe can use the absolute fluxes from Figure 7 to make approximate estimates of the temperature distributions associated with the interferometric images. The observed flux is related to the angular integral of the image specific intensity:

where Ii
is the specific intensity of pixel i and Δω is the angular area of each pixel in the image (Δω = 2.35 × 10⁻¹⁹ sr for 0.1 × 0.1 mas pixels in the SQUEEZE images). The observed fluxes Fλ
averaged over the MIRC-X H-band and MYSTIC K-band wavelength ranges are Fλ
= (1.36 ± 0.17) × 10−11 and (6.25 ± 1.23) × 10−12 erg s−1 cm−2 Å−1, respectively. We need to deredden these fluxes to account for interstellar extinction. Below we derive a faint state reddening of E(B − V) = 0.64 ± 0.08 mag (Table 2), and this corresponds to NIR extinctions of AH
= 0.34 ± 0.04 mag and AK
= 0.23 ± 0.03 mag (Fitzpatrick 1999). Then the extinction-corrected (unreddened) fluxes are  = (1.86 ± 0.24) × 10−11 and (7.71 ± 1.51) × 10−12 erg s−1 cm−2 Å−1 for the H and K bands, respectively. We make the simplifying approximation that the specific intensities are set by the gas temperature through the Planck function. We can then use the above equation for the flux to relate the image pixel intensity Pi
(normalized so that the flux summed over the image is one) to the gas temperature T:
= (1.86 ± 0.24) × 10−11 and (7.71 ± 1.51) × 10−12 erg s−1 cm−2 Å−1 for the H and K bands, respectively. We make the simplifying approximation that the specific intensities are set by the gas temperature through the Planck function. We can then use the above equation for the flux to relate the image pixel intensity Pi
(normalized so that the flux summed over the image is one) to the gas temperature T:

The constants are  and 0.0070 ± 0.0014 and
  K and 6540 K for the adopted central wavelengths of 1.615 and 2.200 μm, respectively. Note the temperatures derived this way may be slight overestimates because part of the observed flux may arise in the circumstellar environment and not in the photosphere. This method applied to the SQUEEZE images in Figure 5 leads to peak temperatures of around 4490 K (H band) and 4860 K (K band) averaged over pixels with intensities greater than 70% of the maximum intensity. Similarly, the full disk temperatures are approximately 3520 K for both the H and K bands averaged over pixels with intensities greater than 10% of the maximum intensity. These temperature estimates are similar to that estimated above from the CO line (3900 K).
4. SED
We can obtain another estimate of the angular diameter of RW Cep from a comparison of the observed and model flux distributions, but keeping in mind that the observed fluxes are actually the sum of the stellar and circumstellar light. The shape of the SED is a function of the stellar flux, dust emission, and extinction, so an examination of the SED in both the bright and faint states offers a means to check on extinction changes resulting from additional circumstellar dust. Here we first present the bright state SED based upon archival photometry and then compare it to the faint state case based upon current flux estimates.
The fluxes for the bright state were collected from published photometry collected with the VizieR Photometry Tool. We added to this set the fluxes derived from the photometry catalog of Ducati (2002) using the flux calibrations from Bessell et al. (1998). We removed the 2MASS JHK fluxes that are suspect for this very bright star. The observed SED is shown in Figure 9 in the  plane. The measurements indicated by plus signs for wavelengths <3 μm were used in the subsequent fit while the long wavelength points shown as triangles were omitted because a large fraction of the IR excess originates in circumstellar dust (Jones et al. 2023). We list in column 3 of Table 2 the averages of the flux measurements in the primary photometric bands.

Figure 9. The SED of RW Cep. The bright state fluxes are indicated by plus signs and triangles, and only the former were used for the fit of the model photospheric spectrum (solid line). The diamonds depict the estimated fluxes during the current faint state (see Table 2), and the dotted line shows the model photospheric fit for the faint state. See Figure 1 from Jones et al. (2023) for the longer wavelength part of the SED.
Download figure:
Standard image High-resolution image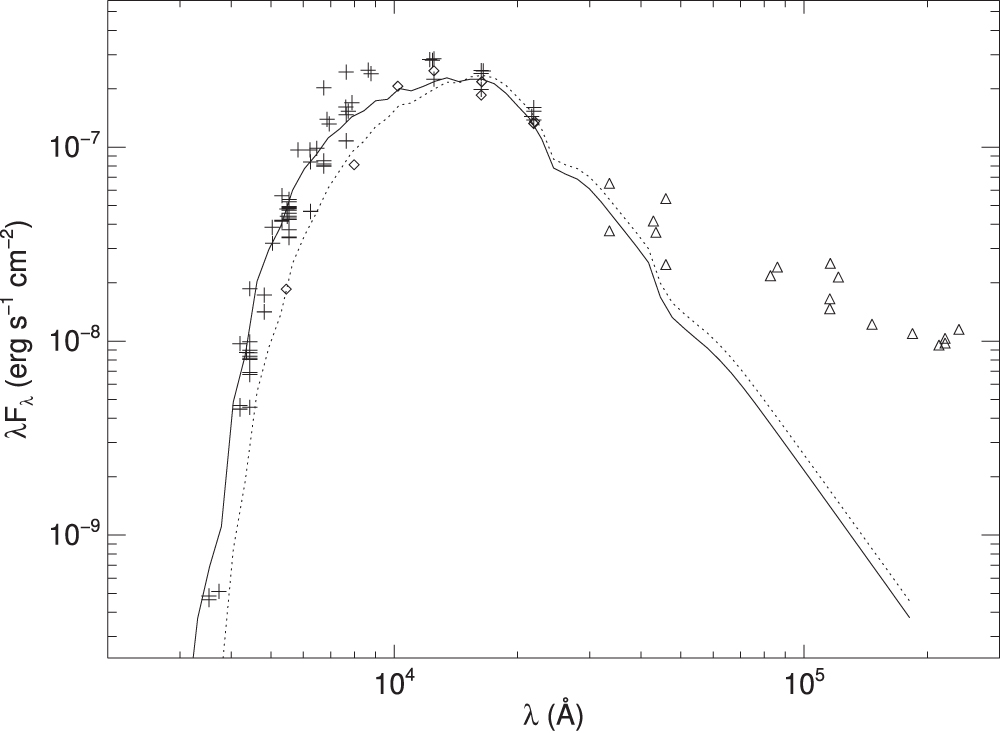
Table 2. SED
| Filter | Wavelength | Bright State | Faint State | Faint State |
|---|---|---|---|---|
| Band | (Å) | (erg cm−2 s−1 Å−1) | (erg cm−2 s−1 Å−1) | Source |
| V | 5450 | (8.16 ± 0.10) × 10−12 | (3.40 ± 0.34) × 10−12 | AAVSO |
| Ic | 7980 | (2.07 ± 0.20) × 10−11 | (1.02 ± 0.10) × 10−11 | KWS |
| Y | 10200 | ⋯ | (2.02 ± 0.25) × 10−11 | APO |
| J | 12500 | (2.17 ± 0.25) × 10−11 | (1.98 ± 0.21) × 10−11 | APO |
| H | 16300 | (1.43 ± 0.14) × 10−11 | (1.36 ± 0.17) × 10−11 | APO |
| H | 16300 | ⋯ | (1.14 ± 0.16) × 10−11 | MIRC-X |
| K | 22000 | (6.82 ± 0.43) × 10−12 | (6.25 ± 1.21) × 10−12 | APO |
| K | 22000 | ⋯ | (6.05 ± 0.96) × 10−12 | MYSTIC |
| Teff (K) | ⋯ | 4200 | 3900 | ⋯ |
| E(B − V) (mag) | ⋯ | 0.46 ± 0.06 | 0.64 ± 0.08 | ⋯ |
| θ (mas) | ⋯ | 2.25 ± 0.18 | 2.58 ± 0.16 | ⋯ |
Download table as: ASCIITypeset image
A model of the spectral flux for RW Cep was selected from the grid of BT-Dusty/Phoenix stellar atmosphere models from Allard et al. (2012) that are available from the Spanish Virtual Observatory Theoretical Spectra Web Server.
22
These flux distributions are derived from spherical geometry atmospheres that use solar abundances from Asplund et al. (2009) and that account for mixing processes to create condensates. We chose a model with Teff = 4200 K (close to the value of 4185 K derived by Messineo et al. 2021 from spectral indices) and  (cgs units). This gravity value is the lowest in the grid, but it is probably still too large by as much as 1 dex for this hypergiant. However, the characteristics of the model spectrum are primarily determined by the temperature, so this approximation is reasonable. The model spectrum was rebinned to a low resolving power of R = 8 in order to compare the model fluxes with those derived from the broadband photometry.
The model spectrum was fit to the observed fluxes using two parameters, the reddening E(B − V) and the limb-darkened angular diameter θLD. We used the reddening law from Fitzpatrick (1999) for a ratio of total-to-selective extinction of 3.1. The fitted model spectrum is shown in Figure 9 as a solid line for E(B − V) = 0.46 ± 0.06 mag and θ = 2.25 ± 0.18 mas. Messineo et al. (2021) derive a K-band extinction of A(K) = 0.26 ± 0.17 mag that corresponds to a reddening of E(B − V) = 0.72 ± 0.47 mag for the reddening law from Fitzpatrick (1999), which agrees within the uncertainties with our result. The angular diameter from the fit is similar to that from the JSDC of θLD = 2.14 ± 0.17 mas.
Estimates of the flux of RW Cep in the faint state are listed in column 4 of Table 2. The entries for the V and Ic bands are from recent AAVSO and KWS magnitudes, respectively, that were converted to fluxes using the calibrations from Bessell et al. (1998). There are four rows that give the average fluxes over the standard filter band ranges that were obtained from the APO TripleSpec spectrum shown in Figure 7. In addition, there are estimates for the H and K bands that we derived from the raw counts in the CHARA Array observations of RW Cep and the calibrator star HD 219080 (7 And). A comparison of the detector counts from the MIRC-X and MYSTIC observations led to magnitude differences of RW Cep relative to 7 And of ΔH = −1.31 ± 0.14 mag and ΔK = −1.73 ± 0.16 mag. We adopted magnitudes for 7 And of H = 3.81 and K = 3.77 from Ducati (2002), 23 so the estimated magnitudes of RW Cep on 2022 December 23 are H = 2.50 ± 0.14 mag and K = 2.04 ± 0.16 mag. The corresponding fluxes from the calibrations of Bessell et al. (1998) are listed in rows 6 and 8 of Table 2.
The faint state fluxes are shown as diamond symbols in the SED in Figure 9. The flux decrease in the NIR bands is modest compared to the large drop observed in the visual V band. We made a separate fit of the faint state fluxes this time using a BT-Dusty model for a photospheric temperature of Teff = 3900 K that was indicated by the strength of the CO-band features in the TripleSpec observation (Section 3). This fit is shown as the dotted line in Figure 9, and the fitting parameters are E(B − V) = 0.64 ± 0.08 mag and θ = 2.58 ± 0.16 mas. Note that these last two parameters are relatively independent of the value adopted for the temperature. For example, if we adopt instead a flux model for Teff = 4200 K, then the fit of the faint state fluxes yields E(B − V) = 0.88 ± 0.07 mag and θ = 2.54 ± 0.15 mas. The angular size of RW Cep for the faint state flux fits is marginally larger than that for the bright state (by 1.4σ), but we caution that the fits do not account for the flux component from circumstellar dust. The difference in reddening and extinction between the bright and faint states is more significant, and it suggests that the current Great Dimming of RW Cep is mainly the result of increased circumstellar dust obscuration that is particularly important at shorter wavelengths.
5. Discussion
The CHARA Array interferometric observations and the derived images resolve the photosphere of RW Cep for the first time. The angular diameter estimates from the uniform disk fits are listed in Table 1. The MYSTIC visibilities indicate that the star is about 27% larger in the longest wavelength channels with λ > 2.3 μm. This spectral range corresponds to that where the CO transitions are particularly strong (Figure 8), and we suggest that this flux originates at higher levels in the extended atmosphere, making the star appear larger at these wavelengths. The star appears somewhat box-like in shape in both the H- and K-band SQUEEZE images of Figure 5. The range in diameter estimates from the SQUEEZE images is given in rows 4 and 5 of Table 2. The uniform disk diameters from the OITOOLS images are given in rows 6 and 7, and the limb-darkened diameters associated with the SURFING images are listed in rows 8 and 9. The diameters from the OITOOLS and SURFING images occupy the midrange of the estimates found by other methods.
The distance to RW Cep is not well established. It is often assumed to be a member of the Cep OB1 association (Melnik & Dambis 2020) at a distance of 3.4 kpc (Rate et al. 2020). It may be a part of the Berkeley 94 star cluster at a distance of 3.9 kpc (Delgado et al. 2013). These estimates agree with the distance from Gaia DR2 of  kpc (Bailer-Jones et al. 2018), but are significantly lower than the most recent estimate from Gaia EDR3 of
  kpc (Bailer-Jones et al. 2021). The latter distance would place RW Cep in the Norma/Outer Arm of the the Milky Way. The discrepancy between the Gaia estimates may be related to photocenter jitter related to stellar convection and outflows (Chiavassa et al. 2022). We will assume that the actual distance falls in the Gaia range of 3.4 to 6.7 kpc. If we adopt the angular diameter from the SURFING images of θLD = 2.45 mas, then the stellar radius is 900–1760 R⊙ or 4.2–8.2 au. This places RW Cep among the largest stars known in the Milky Way (Levesque et al. 2005).
The most striking features in the reconstructed images are the large variations in brightness across the visible hemisphere of the star. The surface flux distribution is asymmetric with a bright region offset from the center and a darker zone toward the western side. The darker zone is slightly more prominent in the K-band images, and the contrast between the dark and bright zones may indicate that the darker region is related to cool circumstellar dust. However, the details of the reconstructed images depend upon assumptions about the extended flux, and the images shown in Figures 5 and 6 are representative of the range in results.
The NIR spectroscopy shows that the fading is much smaller at longer wavelengths compared to that in the visual spectrum. The relative fractions of flux fading from the V band (0.55 μm) to the K band (2.2 μm) are consistent with an extra component of dust extinction with an associated additional reddening of ΔE(B − V) ≈ 0.18 mag (assuming the nominal extinction law presented by Fitzpatrick 1999). Furthermore, the K-band continuum slope indicates the presence of a dust flux component that contributes progressively more flux at longer wavelength. We suggest that the apparent disk asymmetry observed in the interferometric images is also related to this component of circumstellar dust.
The Great Dimming of RW Cep may be the latest in a series of mass ejections over the last century. Jones et al. (2023) recently presented an analysis of archival measurements of the SED of RW Cep that documents the infrared excess from dust emission. The SED has one excess component that contributes strongly in the 5–12 μm range and a second component beyond 20 μm, and Jones et al. (2023) suggest that these correspond to inner and outer shells of temperatures 250 K and 100 K, respectively. These dust shells have an angular radius of 300–400 mas in an image made at 11.9 μm (see their Figure 1). Thus, the current fading may be the latest of continuing mass ejection and dust formation episodes, and the newly formed dust now partially obscures the visible hemisphere.
The overall appearance of the H- and K-band images of RW Cep is similar in character to the asymmetry found by Montargès et al. (2021) in visible-band images made during the great dimming of Betelgeuse that they attribute to dust formation in mass ejected from the star. Furthermore, the current dimming of RW Cep is similar in amplitude and reddening to that observed for Betelgeuse (Figure 1). We suspect that similar processes are causing the asymmetric appearance of the CHARA images made during the great dimming of RW Cep. We note that the star attained a relative brightness maximum in 2019 November (JD 2458800 in Figure 1) and then generally faded to its current historic minimum (Vollmann & Sigismondi 2022). We suggest that the maximum light time may have corresponded to a particularly energetic convective upwelling of hot gas that launched a surface mass ejection event. This gas is now cooling to the point of dust formation, and the part of the ejected cloud seen in projection against the photosphere causes the darker appearance of the western side of the star. The duration of such dimming events may scale with stellar and dust cloud size, so that the timescale ranges from about a year in smaller Betelgeuse, through several years for RW Cep, to decades for larger VY CMa (Humphreys et al. 2021). We plan to continue CHARA Array observations over the next year to explore how developments in the images are related to the photometric variations.
Acknowledgments
This work is based upon observations obtained with the Georgia State University Center for High Angular Resolution Astronomy (CHARA) Array at Mount Wilson Observatory. The CHARA Array is supported by the National Science Foundation under grant Nos. AST-1636624, AST-1908026, and AST-2034336. Institutional support has been provided from the GSU College of Arts and Sciences and the GSU Office of the Vice President for Research and Economic Development. F.B. acknowledges funding from the National Science Foundation under grant No. AST-1814777. S.K. acknowledges support from the European Research Council through a Starting Grant (grant Agreement No. 639889) and Consolidator Grant (Grant Agreement ID 101003096). J.D.M. acknowledges funding for the development of MIRC-X (NASA-XRP NNX16AD43G and NSF AST-1909165) and MYSTIC (NSF ATI-1506540 and NSF AST-1909165). The work is also based on observations obtained with the Apache Point Observatory 3.5 m telescope, which is owned and operated by the Astrophysical Research Consortium. We thank Russet McMillan and Candace Gray for their help with obtaining the APO observations.
Facilities: CHARA - Center for High Angular Resolution Astronomy interferometer and APO - .
Software: PMOIRED (Mérand 2022), SQUEEZE (Baron et al. 2010, 2012), SURFING (Roettenbacher et al. 2016), Spextool (Cushing et al. 2004), and Xtelluric (Vacca et al. 2003).
Footnotes
- 11
- 12
- 13
- 14
- 15
- 16
- 17
- 18
- 19
- 20
- 21
- 22
- 23
Magnitudes collected from Gezari et al. (1993), which have typical uncertainties of ±0.02 mag for bright stars. These uncertainties are much smaller than the other sources of uncertainty in the magnitude error budget.