


Abstract
In this work, we model the collisional evolution of the Jupiter Trojans and determine under which conditions the Eurybates-Queta system survives. We show that the collisional strength of the Jupiter Trojans and the age of the Eurybates family and by extension Queta are correlated. The collisional grinding of the Jupiter Trojan population over 4.5 Gy results in a size–frequency distribution (SFD) that remains largely unaltered at large sizes (>10 km) but is depleted at small sizes (10 m to 1 km). This results in a turnover in the SFD, the location of which depends on the collisional strength of the material. It is to be expected that the Trojan SFD bends between 1 and 10 km. Based on the SFD of the Eurybates family, we find that the family was likely the result of a catastrophic impact onto a 100 km rubble pile target. This corresponds to objects with a rather low collisional strength (10 times weaker than that of basaltic material studied in Benz & Asphaug). Assuming this weak strength, and an initial cumulative slope of the size–frequency distribution of 2.1 between diameters of 2 m and 100 km when the Trojans were captured, the existence of Queta, the satellite of Eurybates, implies an upper limit for the family age of 3.7 Gy. Alternatively, we demonstrate that an unconventional collisional strength with a minimum at 20 m is a plausible candidate to ensure the survival of Queta over the age of the solar system. Finally, we show how different collisional histories change the expected number of craters on the targets of the Lucy mission and that Lucy will be able to differentiate between them.
Export citation and abstract BibTeX RIS

Original content from this work may be used under the terms of the Creative Commons Attribution 4.0 licence. Any further distribution of this work must maintain attribution to the author(s) and the title of the work, journal citation and DOI.
1. Introduction
The Lucy mission (Levison et al. 2017) will be the first mission to study Jupiter Trojans (JT) up close. During five encounters with seven Jupiter Trojans between 2027 and 2033, it will sample the diversity of Trojans. The targets include (3548) Eurybates, a C-type Trojan and the largest member of a collisional family (Brož & Rozehnal 2011), (11351) Leucus, and (21900) Orus, two D-type Trojans, (15094) Polymele, a P-type Trojan, and (617) Patroclus and Menoetius, an almost equal mass binary pair that is also a P-type. Polymele is the smallest target (D ∼ 21 km), whereas Patroclus is the largest (D ∼ 140 km). Leucus stands out for its very long rotation period (∼445 hr; Buie et al. 2018; Mottola et al. 2020). Lucy has several objectives with the Trojans: (i) It will map the colors, albedos, and shapes of the target bodies; (ii) It will determine the distribution of minerals, ices, and organics on each target surface; (iii) It will measure the crater size–frequency distributions (SFD) on each target body to determine the relative ages of different parts of their surfaces, and (iv) it will measure the masses and bulk densities of its targets as well as search for satellites and rings around them.
Jupiter Trojans are outer solar system planetesimals that orbit the Sun in a 1:1 resonance with Jupiter. They are found in two swarms around the L4 and L5 Lagrangian points of the Sun–Jupiter system where they lead/trail Jupiter by 60°, respectively (Lagrange 1772). Jupiter Trojans are known to be quite stable over the age of the solar system with only ∼25% having escaped the resonance since they were captured (Levison et al. 1997; Di Sisto et al. 2014; Holt et al. 2020). Currently we know of roughly 9400 Jupiter Trojans (∼3000 larger than 10 km; Emery et al. 2015) making the population smaller than, e.g., the main belt asteroid population (∼10,000 larger than 10 km; Bottke et al. 2015). Further, the L4 swarm, with ∼1800 Trojans larger than 10 km, appears to have more objects than the L5 swarm, with ∼1200 larger than 10 km (Jewitt et al. 2000; Yoshida & Nakamura 2008; Yoshida & Terai 2017).
The JTs show a bi-modal color distribution ("red" and "less red"; Szabó et al. 2007; Roig et al. 2008; Emery et al. 2011; Wong et al. 2014; Jewitt 2018). While the "red" Trojans overlap with "red" Kuiper Belt objects (KBOs) and Centaurs, the "less-red" Trojan population does not have a clear analog in the KBO population (Figure 1 in Wong & Brown 2016). There is no analog for the "very red" KBOs in the JTs.
The Eurybates family is a cluster of C-type fragments with similar orbits within the L4 swarm. Their members not only have inclinations that are tightly confined to 7.5° ± 0.5°, but they are also bluer than the "less-red" JTs. This makes them fairly exceptional within the Trojans.
Jupiter Trojans overall have very dark surfaces with visible albedos of 0.07 ± 0.03, according to data from the WISE infrared survey spacecraft (Grav et al. 2011). The large JTs are darker with albedos around 0.05 while small JTs are on average "brighter" with albedos around 0.1 but with a wide scatter between 0.03 and 0.2 (Figure 7 in Grav et al. 2011). JTs also have similar albedos and colors to comets (Fornasier et al. 2007, 2015). JTs populate the full stable region of around the Lagrange points, including high inclinations (30°), but typically have low eccentricities (<0.15). The strong excitation in inclinations is an important constraint on the origin of Jupiter Trojans.
Dynamical models suggest Jupiter Trojans are unlikely to have formed at their current location (Marzari et al. 2002). This has led several groups to propose different origin scenarios and capture mechanisms. For example, in the "jumping Jupiter" model (Gomes et al. 2005; Morbidelli et al. 2005; Tsiganis et al.2005; Nesvorný et al. 2013), the primordial Kuiper Belt beyond Neptune gets scattered by the giant planet instability. One part of the population is scattered outwards into the trans-Neptunian object (TNO) region, which includes the Edgeworth-Kuiper Belt. Another part is scattered inwards. It is there where Jupiter, which jumps on the semimajor axis, can capture some of these objects in the 1:1 resonance. This scenario would also imply that KBOs and Jupiter Trojans have a common origin but later evolved differently, resulting in different colors, e.g., due to the different collisional (Wong & Brown 2016) and thermophysical environments. The advantage of this model lies in the fact that it accurately predicts both the population size of the Jupiter Trojans and their orbital distribution, in particular their large range of inclinations. In a second fairly recent model proposed by Pirani et al. (2019), Jupiter forms at ∼20 au or farther and subsequently migrates to its current location while growing in mass and sweeping up planetesimals in the process and capturing them in the 1:1 resonance. This model accounts for the asymmetry in the size of the two Trojan swarms (see Figure 1), but the captured bodies do not reproduce the observed masses or the inclinations of the observed Trojans.

Figure 1. Left panel: the cumulative size–frequency distribution (SFD) as a function of diameter based on the WISE data (Grav et al. 2011) of the L4 (blue line) and L5 (orange line) Jupiter Trojan swarms are shown. The dashed black line shows the combined Trojan SFD and the green line the one of the Eurybates family (EF). The WISE data is complete down to about 20 km. Right panel: the cumulative SFD as a function of absolute magnitude, H, according to the data from the Minor Planet Center is shown. An absolute magnitude of 13.5 corresponds roughly to a 10 km Trojan, assuming an average albedo of 0.07 (Grav et al. 2011). The line colors correspond to the same (sub-)populations as in the left panel.
Download figure:
Standard image High-resolution imageIn this work we study the collisional evolution of the Jupiter Trojans and the Eurybates family to understand their implications for (i) their material strength, and (ii) the age of the Eurybates family and newly discovered satellite Queta (Noll et al. 2020). Queta's survival has implications for the family-forming event. We find that to a degree the age and strength of the Eurybates family and Queta are correlated and moreover depend on the SFD of the Jupiter Trojans at small sizes (<1 km).
2. Constraints from the Trojans, Eurybates Family, and Queta
Three constraints are of particular importance for this work:
- 1.the SFD of the Jupiter Trojans;
- 2.the Eurybates family and its SFD; and
- 3.the existence of Queta, the satellite of Eurybates.
We will present these constraints in the order given above, which also corresponds to going from a macro to a micro view.
2.1. The Jupiter Trojan SFD
First, Figure 1 shows the cumulative SFD of the two Trojan swarms using the WISE data (Grav et al. 2011). We often find that SFDs follow a power law where the number of objects larger than a certain diameter can be written as

where q is the cumulative power-law exponent or slope, and C0 is the normalization constant such that for a reference diameter, D0, the number of objects larger than D0 is N0. The differential power-law exponent, p, differs with respect to the cumulative power-law exponent by one: p = q + 1.
The Jupiter Trojan SFD has a well-defined cumulative slope of q = 2.1 between 10 and 100 km for both the L4 and L5 swarms (Figure 1). At larger sizes the slope becomes steeper (similar to the KBO SFD) but is poorly defined because of the limited number of objects. Note that 100 km planetesimals are thought to be the preferred size (e.g., Morbidelli et al. 2009a; Klahr & Schreiber 2020, 2021) for the formation of planetesimals by streaming instability (Youdin & Goodman2005). On the other end of the size range, the population of small Trojans has been explored for L4 (Jewitt et al. 2000; Yoshida & Nakamura 2008; Wong & Brown 2015; Yoshida & Terai 2017). The latter three studies find that the slope of the SFD continues below 10 km, below which there are some indications that the SFD might become shallower. Unfortunately, the papers do not agree where (or if) this turnover takes place. The latest study (Yoshida & Terai 2017), which uses the powerful Hyper Suprime-Cam attached to the Subaru Telescope, finds that a single power law is a better overall fit than a broken power law. It remains uncertain whether a bend in the Jupiter Trojan SFD has actually been detected. If such a turnover exists, it remains an open question how it relates to the observed turnover in the Edgeworth-Kuiper Belt, which occurs at roughly 1 km (Singer et al. 2019; Morbidelli et al. 2021).
2.2. The Eurybates Family
Second, we discuss the Eurybates family. To identify the family, we use the proper elements computed by Mira Brož (Holt et al. 2020) using the hierarchical clustering method (HCM, Zappala et al. 1990; Nesvorný et al. 2015) with a cutoff of 40 m/s. We have varied the cutoff to probe the change in family definition. Increasing the cutoff leads to clustering in the wider neighborhood, while a smaller cutoff leaves out many peripheral members. In total the HCM identified 400 family members, which roughly doubles the family members previously found by Nesvorný et al. (2015). This change reflects the increased number of known JTs since the time of that paper. The full list of family members with relevant properties presented in this work can be found in Tables 3 and 4.
The Eurybates family is well defined with respect to the proper elements (Figure 2) and is roughly located in aprop ∈ [5.27 au, 5.32 au], eprop ∈ [0.032, 0.066], and iprop ∈ [6.99°, 7.86°].

Figure 2. The proper elements of the L4 swarm (black circles) and the Eurybates family (pink circles) are shown. The left panel shows the proper semimajor axis, aprop, and proper eccentricity, eprop, while the right panel shows the proper inclination, iprop. The family is particularly well defined in inclination and hence easily stands out in the right panel.
Download figure:
Standard image High-resolution imageThe family is located close to the edge of the stable orbit region (Figure 2, and Robutel & Gabern 2006). In inclination, the family is extremely well defined (within half a degree for most members; Brož & Rozehnal 2011) and thus stands out in the right panel of Figure 2.
Figure 3 shows the SFD of the Eurybates family as retrieved by the HCM (red line in the left panel). This raw SFD has a shallow slope between 20 and 60 km of q ∼ 2.1, similar to the overall JT slope (Figure 1). At small sizes the SFD steepens up to a slope of q ∼ 3.7, a value that is steeper than that of the L4 Trojans. Slopes steeper than those of the background population are a common property of collisional families (Durda et al. 2007).

Figure 3. The left panel shows the SFDs of the Eurybates family with (i) all members retrieved by the HCM (red solid line and points) and (ii) suspected interloper (5258) Rhoeo removed from the family (blue solid line and points). The latter corresponds to our nominal case of the Eurybates family. The dashed line shows the approximate best power-law fit for the nominal SFD with a slope of 2.1 for objects larger than 19 km and 3.7 below that. The right panel shows a comparison of our nominal SFD with the results from the rubble pile simulation of Benavidez et al. (2012) at an impact speed of 6 km s−1, impact angle of 75°, and mass ratio of target to impactor bodies  . The diameters and associated errors were taken from the NEOWISE data set v2.0 (Mainzer et al. 2019).
Download figure:
Standard image High-resolution imageBefore going any further, we need to establish if some of the identified members could be interlopers. This is particularly important for the largest family member because the shape of the SFD at those sizes can be diagnostic of the family-forming collision itself (e.g., Benavidez et al. 2012).
To validate the possible detection of interlopers we first assess the likelihood of the background L4 population contaminating the Eurybates family region. We have used the following dynamical constraint to determine the background population. First, we defined an ellipsoid in proper (a, e, i)-space to encircle the family. The center of the ellipsoid was placed at (a, e, i) = (5.30 au, 0.049, 7.4°) and the respective radii set to (Ra , Re , Ri ) = (0.069 au, 0.040, 1.04°). These values were chosen to maximize the number of family members identified by HCM and to minimize the number of false defections. All JTs within this ellipsoid were considered as a simplified definition of the family members and only slightly differed from the actual family members determined by HCM. We then increased the volume of the ellipsoid by a factor of eight by increasing the radii by a factor of two in each dimension. The Trojan density within this larger volume minus the family volume was used to estimate the number of interlopers we can expect in the family. For objects with magnitude H < 12 we expect on average 1.4 interlopers. We also determined the probability of having N interlopers. There is a 40% chance that N ≥ 2, and a 20% chance that N ≥ 3. Consequently there is a non-negligible probability that there could be at least three large interlopers in the family. Over all sizes about 8% of the family members might be interlopers.
To investigate which of the largest members might be interlopers, we inspected their proper orbital elements as well as color data (Figure 4).
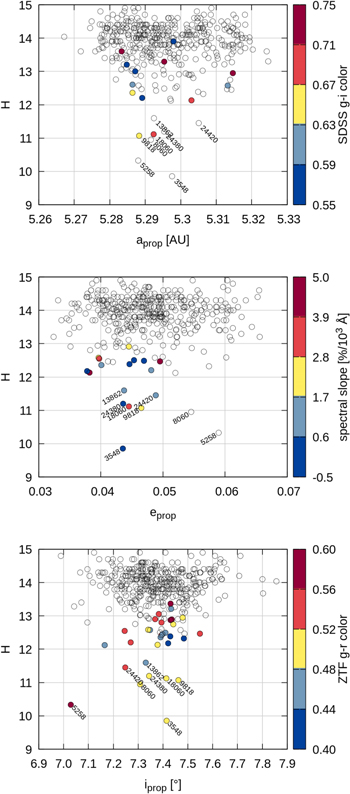
Figure 4. The top panel shows the H-magnitude of the Eurybates family as a function of the proper semimajor axis as well as g–i color from the Sloan Digital Sky Survey, SDSS (Ivezić et al. 2001). The text labels indicate the Trojan numbers of the eight brightest family members. The middle panel shows the H-magnitude as a function of proper eccentricity and spectral slope by Fornasier et al. (2007). For direct comparison the color scale has been chosen such that it corresponds roughly to the SDSS color bar in the top panel. The bottom shows the H-magnitude as a function of proper inclination and g–r color from the Zwicky Transient Facility (ZTF) observations (Schemel & Brown 2021). Trojan (5258) Rhoeo is a clear outlier with respect to proper eccentricity and inclination as well as ZTF color and therefore a very likely interloper. See Tables 3 and 4 for all details on the family members depicted here.
Download figure:
Standard image High-resolution imageWe find that the second brightest/largest object identified by HCM, (5258) Rhoeo, is clearly displaced in proper inclination and eccentricity with respect to the center of the family. This would imply, that a very large fragment from the family-forming event would have been ejected at a high speed. That is not to be expected. Collisional families typically have their largest members in the center of the orbital element distribution (e.g., Milani et al. 2017). That is a consequence of the velocity distribution being a function of 1/D. We hence strongly suspect that (5258) Rhoeo is an interloper. This conclusion is strengthened by its anomalous color compared to the other family members.
We collected colors from the Sloan Digital Sky Survey (SDSS; Ivezić et al. 2001), spectral slopes between 0.3 to 0.9 μm (Fornasier et al. 2007), and colors from the Zwicky Transient Facility (ZTF) observations (Schemel & Brown 2021). The SDSS g–i color (top panel in Figure 4) and the spectral slopes from Fornasier et al. 2007 (middle panel in Figure 4) are connected, and thus their color scales have been chosen such that they correspond to each other. The color scale of the ZTF data cannot be directly compared to the other two.
Eurybates and the bulk of the family have ZTF g–r of ∼0.5 whereas (5258) Rhoeo has 0.6, which is significantly redder. This together with the orbital displacement of (5258) Rhoeo previously discussed provides strong evidence that it is indeed an interloper.
The Eurybates family is significantly bluer than the overall L4 population (Figure 5). With a g–i color of 0.96 ± 0.09 (313024) 2000 AV210 is on the very red end of the color distribution and thus another likely interloper. It has a diameter of 10.805 ± 0.599 and will thus not affect the family SFD and the work described here.
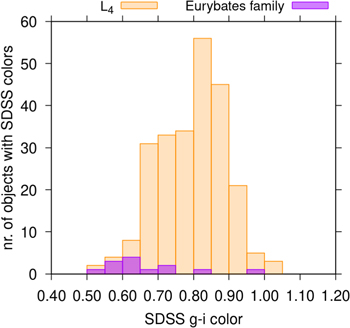
Figure 5. The histogram shows all L4 Trojans (orange) and all Eurybates family members (purple) with known SDSS colors. The Eurybates family is significantly bluer than the L4 Trojans overall.
Download figure:
Standard image High-resolution imageThere are two other family members that might be interlopers. (8060) Anius has a somewhat larger eccentricity (middle panel in Figure 4) but its ZTF color is close to the average color of the family. It is therefore unclear if (8060) Anius is indeed an interloper. We leave this as an open question. Future survey data might be able to provide additional insights. Similarly, (9818) Eurymachos has a slightly low semimajor axis for its size, comparable to (5258) Rhoeo (see the top panel in Figure 4). Other than that, the body is unremarkable with respect to the colors or orbital elements of the other family members. For this reason, we do not consider (9818) Eurymachos an interloper in this work.
The other larger family members do not have unusual colors or orbital elements. Consequently, for our work here we consider (5258) Rhoeo an interloper and exclude it from what we consider to be the nominal family. The family SFD excluding (5258) Rhoeo is shown in Figure 3. We can use these data to explore what the SFD tells us about the family-forming event.
A substantial amount of work has been done to simulate the outcome of asteroid impacts (e.g., Benz & Asphaug 1999; Durda et al. 2007; Benavidez et al. 2012; Jutzi 2015; Benavidez et al. 2018; Jutzi et al. 2019) using primarily a smoothed particle hydrodynamics (SPH) approach. We have access to the simulation results from Durda et al. 2007, who used 100 km diameter monolithic target bodies, and Benavidez et al. (2012), covering collisions of 100 km rubble pile target bodies. Given that these two works cover a large part of parameter space, we consider this to be a good first-order reference for possible outcomes.
We used three criteria to determine whether a simulation outcome matched the observed family SFD: (1) the mass ratio of the two largest family members shall be within 25%, (2) the slope between the second and tenth largest object shall be within ±0.2, and (3) the slope between the tenth and 30th largest body shall be within ±0.2. These criteria were chosen because they fully characterize the observed family SFD and should so be fairly diagnostic of the family-forming collision. For the 387 SPH runs available to us, the mass ratio varied between 3 × 10⁻⁵ and 1 (median of 0.03), the slope between the second and tenth largest object varied between −0.6 and −15 (median of −3.7), and the slope between the tenth and 30th largest body varied between −1.6 and −10 (median of −4.4).
We found that only one model outcome out of 387 satisfied all three criteria (see right panel of Figure 3). The model SFD is remarkably close to the actual family SFD. The simulation corresponded to a collision between a 100 km rubble pile target
4
(Benavidez et al. 2012) and a ∼35 km impactor ( ) at 6 km s−1 and an impact angle of 75° from vertical. Though this match is unlikely to be a unique solution, it is an important piece of information to be evaluated. This is the first indication in our analysis that Jupiter Trojans might be collisionally weak. We will examine this issue below.
A strong constraint for our modeling would be the estimated age of the family, but unfortunately, it is rather poorly constrained. Brož & Rozehnal (2011) and Rozehnal et al. (2016) estimated the family age between 1 and 4 Gy. Milani et al. (2017) were unable to retrieve an age for the Eurybates family from their dynamical methodology. Finally, using the escape probability of family members as derived from dynamical considerations, Holt et al. (2020) estimated the minimum age at ≥1.0 ± 0.4 Gy. We are hence left with a weak constraint for the family age between 1 Gy and the age of the solar system.
2.3. Eurybates' Satellite Queta
Our last and arguably most important constraint comes from Eurybates itself. Noll et al. (2020) reported the discovery of a 1.2 ± 0.4 km satellite around (3548) Eurybates, which has since been named Queta. Eurybates is only the fourth Trojan with a known satellite (Noll et al. 2020).
Since its discovery, Queta's orbit has been further constrained by Hubble Space Telescope observations (Brown et al. 2021). It has a semimajor axis of 2350 ± 11 km, an orbital period of 82.46 ± 0.06 days, and a small eccentricity of 0.125 ± 0.009 (Brown et al. 2021). We find the low eccentricity to be particularly noteworthy because impact simulations (e.g., Durda et al. 2007) typically generate companions around the target body that have highly eccentric orbits. In dynamics, "particles always return to the scene of the perturbation" unless some mechanism has changed their orbit. In Questa's case this can be due to the Kozai effect, which lets Queta's orbit go through oscillations in eccentricity (Brown et al. 2021).
The existence of Queta as a satellite of Eurybates, the most sizeable member of the largest collisional family within the Jupiter Trojans, immediately poses the question as to the long-term survival of Queta. To date, the dynamical stability of Queta has been studied by Brown et al. (2021). Here we will examine whether Queta can survive the expected collisional environment within L4 . We will summarize the dynamical findings from Brown et al. (2021) in Section 3.
3. Methods
To simulate the collisional evolution of the Trojans we employ the Boulder collisional code (Morbidelli et al. 2009b; Nesvorný et al. 2011, 2018). Here we only outline the broad principles of the code but a detailed description is provided in Morbidelli et al. (2009b) and Nesvorný et al. (2018). Boulder requires an initial SFD of the population, the intrinsic impact probability between bodies (Pi
), average impact speeds between bodies, and a function that describes the critical impact energy  , defined as the energy per unit target mass needed to disrupt and disperse 50% of the target (e.g., Benz & Asphaug 1999; Davis et al. 2002). The SFD and Pi
are used to calculate the expected number of impacts per time step of the impactor population of size Ri
on the targets with size Rj
(where Ri
< Rj
). For a given impact Boulder calculates the specific impact energy Q, which is defined as the kinetic energy of the impactor divided by the target mass. Collisions where
, defined as the energy per unit target mass needed to disrupt and disperse 50% of the target (e.g., Benz & Asphaug 1999; Davis et al. 2002). The SFD and Pi
are used to calculate the expected number of impacts per time step of the impactor population of size Ri
on the targets with size Rj
(where Ri
< Rj
). For a given impact Boulder calculates the specific impact energy Q, which is defined as the kinetic energy of the impactor divided by the target mass. Collisions where  are referred to as cratering events while collisions with
  correspond to super-catastrophic disruption events. When a catastrophic disruption occurs, the code calculates the masses of the largest remnant and that of the largest fragment as well as the power-law slope of the smaller fragments. These values are calculated based on the scaling laws found by the hydrocode results of Durda et al. (2004, 2007), and Nesvorný et al. (2006). Each collision alters the SFD, which is then used to estimate the subsequent number of expected impacts.
Two fundamental properties of the JTs are unknown: 1) the SFD (in particular for <10 km) when the Trojans were captured in resonance with Jupiter (we will call this the initial SFD), and 2) the collisional strength of Trojans as defined by  . With regards to the initial SFD, our tests suggest collisional evolution will not meaningfully affect the SFD of D ≥ 10 km Trojans. On this basis, we assume the shape of the Jupiter Trojan SFD for this size range is likely primordial and hence close to the present-day SFD. This will also become apparent from our results below. On the other hand the shape of the SFD below 10 km is unknown for the initial population. The present-day SFD is complete to ∼20 km (see Figure 1) and the slope is arguably well known down to ∼3–10 km (Yoshida & Nakamura 2008; Wong & Brown 2016; Yoshida & Terai 2017). We are therefore required to make assumptions about the initial SFD below 10 km. Here we will assume two end-member cases. For the first, we will assume that the initial slope below 10 km is simply a continuation of the present-day slope above 10 km (2.1, see Figure 1). For the second, we will assume that the initial slope below 10 km is one (q = 1) and thereby significantly shallower than the slope between 10 and 100 km (q = 2.1). This signifies an initial depletion of the JT population at small sizes.
Our version of Boulder also allows us to follow the orbital evolution of the Eurybates-Queta system in terms of how impacts on either Eurybates and Queta can alter the orbit of Queta or potentially disrupt either of them (Nesvorný et al. 2011, 2018). Changes to the semimajor axis and eccentricity of Queta are tracked over time. For nondisruptive impacts on either of the binary components, Boulder computes the change of the binary orbit depending on the linear momentum of the impactor as described in detail in the methods section of Nesvorný et al. (2018).
We are particularly interested in quantifying the four ways the Eurybates-Queta system can be dissolved: (1) impacts on Eurybates that (a) catastrophically disrupt Eurybates or (b) displace Eurybates such that Queta is no longer in orbit, and (2) impacts on Queta that (a) catastrophically disrupt Queta or (b) kick Queta out of orbit. Here we assume a semimajor axis of 2400 km and an eccentricity of 0.1, but we note that the orbit can evolve purely dynamically (Brown et al. 2021). In particular the eccentricity is predicted to oscillate between 0.1 and 0.35 within a roughly 500 yr period. This is induced when Queta's argument of pericenter sweeps by the Kozai resonance islands at 90° and 270° (Brown et al. 2021). We have tested the sensitivity of our results by varying the semimajor axis between 1200 km and 7200 km, and the eccentricity between 0.1 and 0.5. We have not found any significant change in our results within these ranges. For this reason, we will only present the nominal case. But we will return to this point and see why in this case the survival of Queta is not sensitive to the binary semimajor axis.
With regards to  we currently do not have a clear sense of the collisional strength of Trojans but can turn to literature for guidance. How impacts disrupt a body depends on the size of the target body, the mass ratio of the target and the impactor, the relative speed and angle of impact, as well as the material properties of the bodies (e.g., Holsapple & Housen 1986; Benz & Asphaug 1999; Michel et al. 2001; Leinhardt & Stewart2009; Jutzi et al. 2010; Benavidez et al. 2012; Holsapple & Housen 2019; Jutzi et al. 2019).
For the functional form of all  we follow the one in Benz & Asphaug (1999) where

with D being the diameter of the parent body in cm, ρ the bulk density of the body, and Cs,g
and ss,g
are the scaling constants and slopes in the strength and gravity regimes. Different disruption laws are shown in the left panel of Figure 6. They have primarily been derived for properties suitable to rocky or icy objects. Different techniques have been used to determine  . First, numerical models, such as SPH (e.g., Benz & Asphaug 1999; Michel et al. 2001; Jutzi et al. 2010), have been used to simulate the collision of bodies at different impact speeds and angles. Second, models for the collisional evolution of populations (akin to Boulder) have been used to constrain the disruption laws by simulating the evolution of the SFD and comparing them with the currently observed SFD in an inverse problem sense (e.g., Bottke et al. 2005, 2020; Benavidez et al. 2022). This method, though it can provide insights into the disruption law of a population, cannot infer material properties on its own. Third, ground truths from laboratory experiments (e.g., Senft & Stewart 2007, 2008) are crucial to determining the disruption or cratering laws.
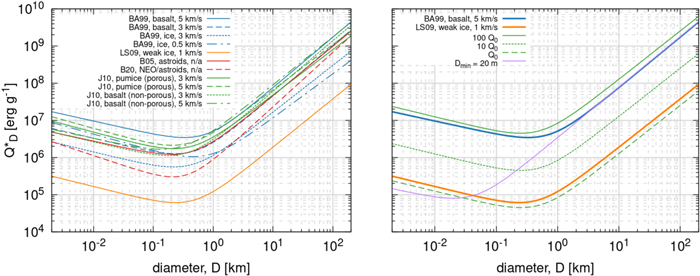
Figure 6. Critical impact energy,  , according to different studies (BA99; Benz & Asphaug 1999; LS09 Leinhardt & Stewart 2009; B05 Bottke et al. 2005; B20 Bottke et al. 2020; J10 Jutzi et al. 2010) are shown in the left panel. The right panel shows three different model assumptions Q0 (dashed green), 10Q0 (dotted green), and 100Q0 (solid green) as well as a
  with a minimum of 20 m (purple line). In addition, the literature values from Benz & Asphaug (1999), blue, and Leinhardt & Stewart (2009), orange, are shown as a reference. This illustrates that our weakest material (Q0) is slightly weaker than the weak ice from Leinhardt & Stewart (2009), while our strongest material (100Q0) is slightly stronger than the basaltic material from Benz & Asphaug (1999).
Download figure:
Standard image High-resolution imageThe  illustrated in Figure 6 shows many common features. They all have a minimum at a similar size of
 ![${D}_{\min }\in [200,400]$](https://content.cld.iop.org/journals/1538-3881/164/4/167/revision2/ajac8d6bieqn13.gif) m. This divides the curves into the so-called gravity regime (to the right of the minimum) and the strength regime (to the left of the minimum). The slopes in both the gravity and strength regime do not vary strongly. Lastly, despite the similarity in shape, the
m. This divides the curves into the so-called gravity regime (to the right of the minimum) and the strength regime (to the left of the minimum). The slopes in both the gravity and strength regime do not vary strongly. Lastly, despite the similarity in shape, the  functions vary significantly in absolute strength. The weak ice material of Leinhardt & Stewart (2009), the orange line in Figure 6, is almost two orders of magnitude weaker than the basaltic material in Benz & Asphaug (1999), the blue line in Figure 6.
We have for this reason chosen to retain the canonical shape of  and vary only the magnitude over two orders of magnitude. Our weakest material will be denoted by Q0 (see right panel of Figure 6) and corresponds to materials slightly weaker than the weak ice from Leinhardt & Stewart (2009). We then include scaling of 2.2Q0, 4.6Q0, 10Q0, 22Q0, 46Q0, and 100Q0 where the latter is slightly stronger than the basaltic material from Benz & Asphaug (1999). Given the match in the family SFD with the runs of Benavidez et al. (2012; Figure 3), the strength of Proto-Eurybates would correspond to our 4.6Q0 case.
Finally, we will also consider a more exotic  (purple line in the right panel of Figure 6), which follows the basaltic material from Benz & Asphaug (1999) in the gravity regime but then continues down to
  m before transitioning to the strength regime. We will discuss the motivation and implications for this kind of
  in Section 4.
3.1. Input Parameters
In Section 3, we mentioned the input parameters that are needed for this work. First, we have described that the Boulder code requires population-specific parameters. These are the initial SFD, intrinsic impact probability, Pi , and the average impact speeds, vi , of the population. In the case of the JTs we can treat the two swarms separately because they do not overlap dynamically and thus do not contribute to the collisional evolution of each other. For the SFD we, therefore, assume a slightly larger population than L4. The largest object in our SFD has a diameter of 140 km. Between our largest size and 100 km we have a steep slope leading to 15 Trojans larger than 100 km. Below 100 km we impose a cumulative slope of 2.1 down to our smallest size of 2 m. This initial SFD is shown in later figures (e.g., Figure 10) and has a total mass of 4 × 10⁻⁶ M⊕. This mass is consistent with the estimate by Nesvorný et al. (2013). The collisional environment within each swarm is defined by Pi = 7 × 10⁻¹⁸ km−2 yr−1 and vi = 4.6 km s−1 (Davis et al. 2002; Nesvorný et al. 2018). The intrinsic impact probability takes into account the resonant dynamics of the Trojans.
The second set of input parameters relates to the material properties of the JTs through the  . As described above we have tested two types of disruption laws, one with a canonical shape and a minimum in
  at D = 250 m and one with a minimum at D = 20 m. The former
  form a set with the weakest material labeled Q0. Scaled versions of Q0 have been tested up to 100 × Q0 (see Figure 6). The parameters
  (Equation (2)) used in this work are listed in Table 1.


4. Results
There are essentially three unknowns in our simulations as defined above: (1) the initial Jupiter Trojan SFD below 10 km; (2) the collisional strength of JTs,  and (3) the age of the Eurybates family. Here we present our results that will illustrate how these three properties affect each other, and what we can learn about them. With respect to the age of the Eurybates family, we stipulate that this is equal to the age of Queta, thereby assuming that Queta formed during the family-forming collision. While this is not necessarily true, we are of the opinion that this is a sound assumption absent any other data. As a result we use the age of the family and Queta interchangeably.
To keep things simple, we first start with a simplified situation of a static Jupiter Trojan SFD and will then add more complexity by allowing the SFD to collisionally grind down over time. Finally, we present the results for a noncanonical  which might have interesting implications for other small body populations in the outer solar system.
4.1. Static SFD
In a first step we assume that the SFD of the JT population has not evolved over the age of the solar system. To do this we switch off the collisional evolution of the SFD in Boulder. This retains only the part of the code that monitors impacts on the Eurybates-Queta system and as a consequence allows us to separate the effects from the evolving Trojan SFD (see Section 4.2) and the inherent survival probability of Queta given a certain Trojan population. Though this is a simplification it does allow us to retrieve a first estimate for the timescales. As described above we assume two different initial SFDs.
First, we assume that the SFD below 10 km continues with the same slope as at larger sizes (2.1, see orange line in Figure 10). In this case the probability that Queta survives is a simple exponential decay over time and depends only on  (left panel of Figure 7). At a certain age in the family the probability that Queta would have survived to this day becomes so small that we should not consider these cases. For our purpose we use a 10% survival probability as a discriminator between a scenario that we still consider plausible and scenarios where it would simply be too unlikely for Queta to have survived. We find that a large part of parameter space can be excluded (right panel of Figure 7).
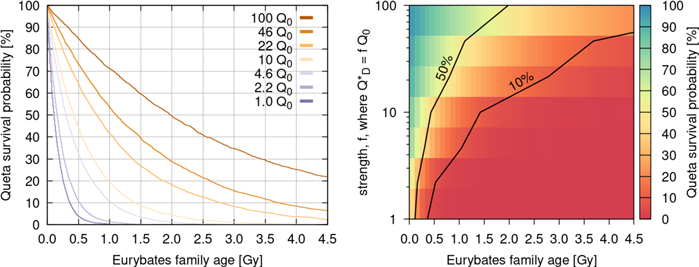
Figure 7. The left panel shows the survival probability of Queta as a function of the family age for the different  of our study. The right panel shows the same information but as a function of collisional strength. The two black lines show the 10% and 50% survival contours. Cases below the 10% contour should be discarded as viable cases. For these cases a static SFD with a cumulative slope of 2.1 between 2 m and 100 km was assumed.
Download figure:
Standard image High-resolution imageTherefore, Figure 7 can answer the question of the age of the Eurybates family as a function of collisional strength. Any cases below the 10% contour line in the right panel of Figure 7 should be considered statistically improbable. Given this static SFD with a slope of 2.1 between 2 m and 100 km, we find that  needs to be strictly larger than 4.6Q0. Otherwise Queta would not survive for more than 1 Gy, the lower limit for the family age. Interestingly, 4.6Q0 corresponds to the
  found by Benavidez et al. (2018) for their rubble pile asteroids. As we have seen above, one of their simulations is a good fit for the SFD of the Eurybates family. If the parent body of the Eurybates family was indeed this weak (4.6Q0), and this disruption law is representative of Jupiter Trojans, and the present-day SFD continues with the same slope down to small sizes, then this result would suggest that the Eurybates family is a "young" family (1 Gy).
We also observe that the age of the family and the collisional strength are directly linked. As the collisional strength increases so does the age of the family. Strictly speaking these are all upper limits for the age of the family. For example, our strongest material (100Q0) never falls below 10% and hence the family age could be up to the age of the solar system. On the other hand the 46Q0 case, which in fact corresponds roughly to the  of basaltic material in Benz & Asphaug (1999; see blue line in Figure 6) gives us an upper limit of ∼3.7 Gy for the family age.
We can also examine what contributes to the destruction of the Eurybates-Queta system. Figure 8 shows our results for different  and a family age of 1 Gy (left) and 4.5 Gy (right). We find that in the overwhelming fraction of cases, an impact occurs on Queta that catastrophically disrupts it (pink in Figure 8). There are no cases where an impact on Queta perturbs its orbit enough for the binary to be dissolved (red in Figure 8). In a minor fraction of cases (up to 10% after 4.5 Gy for 100Q0), an impact on Eurybates leads to the ejection of Queta. It is interesting to note that the relative fraction of cases where an impact on Eurybates destroys Eurybates (light blue in Figure 8) decreases with respect to when such an impact dissolves the binary (dark blue in Figure 8). This result makes sense because as the material strength increases it becomes harder to catastrophically disrupt Eurybates but "easier" to nudge Eurybates such that the binary orbit is dissolved and Queta is lost from the system. The fact that the survival of the Euybates-Queta system is dominated by impacts on Queta is noteworthy because it is different than what has been observed for other binaries, in particular the large Trojan binary pair of Patroclus and Menoetius (P-M binary; Nesvorný et al. 2018), the final fly-by target of the Lucy mission. The P-M system is an almost equal size binary with diameters of 113 km and 104 km, respectively. The survival of the P-M binary is limited by impacts on one of the components that alter the orbit such that the binary is dissolved. The binaries survival is thus sensitive to the semimajor axis of the binary (Nesvorný et al. 2018) because binaries with the larger semimajor axis are dissolved more easily than tight binaries. Nesvorný et al. (2018) estimated that the specific energy needed to dissolve the P-M binary through a noncatastrophic impact is much smaller than the respective
  . In our case, it is much easier to catastrophically disrupt the much smaller Queta (∼1 km). Therefore, in contrast to the P-M binary, the Eurybates-Queta system's survival is not sensitive to the semimajor axis.

Figure 8. The fraction of outcomes for the Eurybates-Queta system are shown for a family age of 1 Gy (left panel), and 4.5 Gy (right panel). A static SFD with a slope of 2.1 between 2 m and 100 km (Section 4.1) is assumed here. A total of 1000 runs were performed to estimate the fraction of outcomes of each case.
Download figure:
Standard image High-resolution imageUp to now we have assumed that the Jupiter Trojan SFD simply continues below 10 km with respect to the slope above 10 km. Because there are indications that the SFD bends/breaks at or somewhat below 1 km (Yoshida & Nakamura 2008; Wong & Brown 2015; Yoshida & Terai 2017), we now assume that the Trojan SFD has a break at 10 km and continues at small sizes with a slope of q = 1 (significantly flatter than above 10 km). In this case, we find a very different picture from Figure 9. We find that the age and collisional strength become unconstrained. Queta can survive 4.5 Gy in all cases of  . In the worst case scenario with extremely weak material (Q0) there is still a 50/50 chance of Queta surviving. In most cases (
 ) the survival probability of Queta over 4.5 Gy is ∼80%.

Figure 9. The fraction of outcomes for the Eurybates-Queta system are shown for a family age of 4.5 Gy when the initial Jupiter Trojan SFD is shallow (power law of 1) below 10 km.
Download figure:
Standard image High-resolution imageThis behavior is readily explained. Due to the very flat SFD below 1 km, the impactor population that could destroy Queta is simply not very large. Consequently the probability for Queta to be catastrophically disrupted (pink in Figures 8 and 9) shrinks to the single percent digits. In this situation, the probability of the Eurybates-Queta system being disrupted is dominated by impacts on Eurybates. This happens either by direct disruption of Eurybates in the case of weak material or dissolution of the binary for strong material. Further, we observe a transition from disruptions of Eurybates dominating the survival probability at low collisional strength to impacts on Eurybates dissolving the binary at large collisional strengths. At low strength, Eurybates is easily disrupted and thus becomes the primary mode limiting the retention of Eurybates-Queta system. As the strength increases Eurybates becomes hard to disrupt but can be nudged strongly enough to dissolve the orbit of Queta.
4.2. Evolving SFD
As argued above, the assumption of a static Jupiter Trojan SFD over the age of the solar system is likely to be an unrealistic simplification. Accordingly, we now consider an initial Trojan SFD with a slope of 2.1 below 10 km (see the orange line in Figure 10) and let it evolve over the age of the solar system.
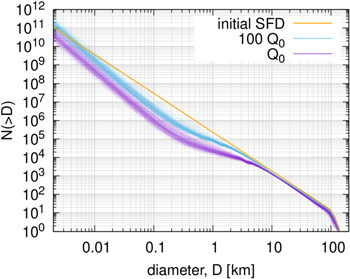
Figure 10. The initial Trojan SFD is shown in orange. The faint lines in purple are 300 different SFDs after 4.5 Gy of collisional grinding assuming  while the blue lines assume
  .
.
Download figure:
Standard image High-resolution imageThe results of 300 such simulations for a  of Q0 and 100Q0 are shown in Figure 10. We show 300 simulations to illustrate the stochastic nature of the collisional evolution of the Trojan population. The sets of simulations differ only in the random seed given to the code. Each simulation, therefore, signifies a possible future of the same initial state of the system.
We find that the slope between ∼6 km and 100 km remains unaltered though the population is depleted slightly in both cases. In both cases shown in Figure 10 the SFD below ∼6 km is significantly affected by collisional grinding. In particular, the population is depleted between 10 m and 3 km. This results in a turnover between 2 and 6 km. The location of this bend depends on the  . It is likely that this is the cause of the bend in the SFD seen by Yoshida & Nakamura (2008) and Wong & Brown (2015). But we should also point out that Yoshida & Terai (2017) reported no detection of this bend, and thus its existence and location require further observations. From a theoretical standpoint we expect there to be a bend in the Trojan SFD (Figure 10), therefore it is likely "merely" a matter of getting more observations to identify it.
The depletion of the JT population between 10 m and 1 km directly affects the survival probability of Queta because this is the impactor population responsible for its destruction (see above). We find that the survival probability of Queta significantly increases in all cases (see bottom row of Figure 11). Compared to the static SFD (Figure 8), all of the  allow Queta to plausibly survive with a family age of more than 1 Gy. But for these cases, we also need a material strength of at least 10Q0 for Queta to have a 10% chance of surviving the age of the solar system.
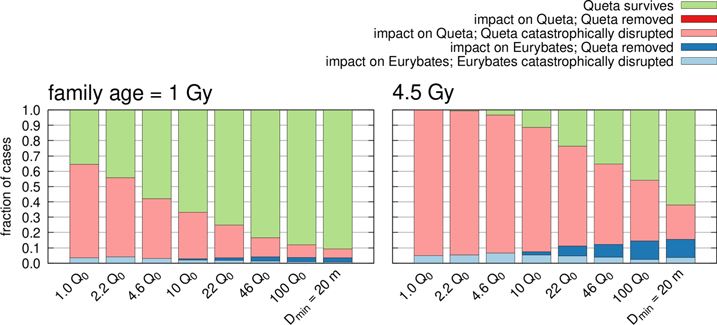
Figure 11. The fraction of outcomes for the Eurybates-Queta system are shown for a family age of 1 Gy (left panel), and 4.5 Gy (right panel). The results here take into account the changing SFD due to collisional grinding (Section 4.2). A total of 1000 runs were performed to estimate the fraction of outcomes of each case.
Download figure:
Standard image High-resolution imageFigures 12 shows the survival probability as a function of the family age. Compared to the static SFD (Figure 7) we observe that the decay is no longer exponential but becomes almost linear in time for the strongest material. Further, the part of parameter space consistent with Queta's existence (cases above the 10% contour) is greatly expanded compared to the static SFD (right panel of Figure 7). This result is not a surprise because there are fewer projectiles in the population capable of destroying Queta. The collisional strength derived from the Benavidez et al. (2012) rubble piles with  now puts an upper limit on the family age. The family is no older than 3.7 Gy with a probability of 90% for this size distribution and disruption law.
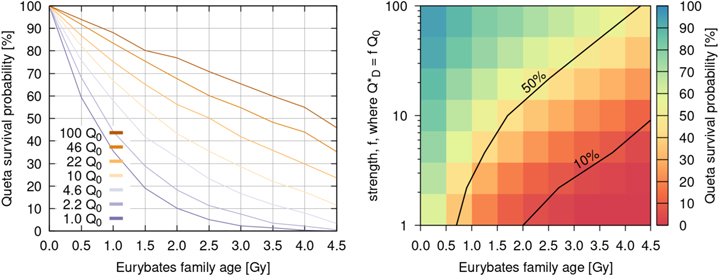
Figure 12. The left panel shows the survival probability of Queta for the evolving Trojan SFD case as a function of the family age for the different  of our study. The right panel shows the same information but as a function of collisional strength. The two black lines show the 10% and 50% survival contours. Cases below the 10% contour should be discarded as viable cases.
Download figure:
Standard image High-resolution image4.3. Unconventional 

Finally, we will examine what happens to our results if we employ a more unconventional  . As described in Section 4.2 (see also Figure 6) the minimum value of
  in literature for rocky and icy targets is typically around a diameter of
  m. There are indications from cratering results obtained by the New Horizons mission to the Pluto system and to the cold classical KBO Arrokoth (Singer et al. 2019; Morbidelli et al. 2021); however, this might not hold for icy bodies of the outer solar system. The critical clue is that the cumulative power-law slope of the Kuiper Belt SFD is approximately q = 1 over the size range between 1 km and tens of meters in diameter Morbidelli et al. (2021).
As discussed in Section 4.2, the location where the intermediate slope steepens back up to the slope in the strength regime is indicative of the minimum in  . For the asteroid belt, this change in slope is observed at 200 m (e.g., Bottke et al. 2020). For the Kuiper Belt, we have yet to identify the size of where this putative change in slope would take place. All we can say is that if it exists, it has to occur at sizes smaller than tens of meters. Accordingly, we infer that
  for Kuiper Belt objects, and presumably Trojans, need to have a minimum value smaller than a few tens of meters. We therefore assume an unconventional
  (purple line in the right panel of Figure 6) which follows the Benz & Asphaug (1999) basaltic material in the gravity regime but then continues down to include continuously weaker material strength all the way down to
  m before transitioning to the strength regime. This minimum value is consistent with the arguments made by Morbidelli et al. (2021), namely that an upturn near that point would provide the means to explain the quantity of dust observed in the Edgeworth-Kuiper Belt by New Horizons.
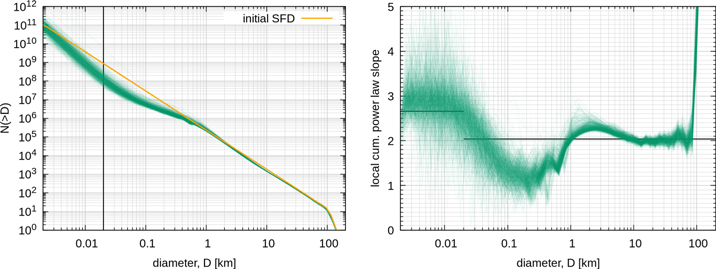
Figure 13 shows what the SFD evolved to after 4.5 Gy. The SFD is more complex than the ones previously shown (Figure 10). We interpret it using the local slopes shown in the right panel. Here we have defined the local slope as the power-law index connecting the two adjacent size bins within the Boulder output results. The typical distance between size bins is 1.25D.
Figure 13. The left panel shows the evolved SFDs after 4.5 Gy assuming a  with
with  m. For reference the initial SFD is shown in orange. The right panel shows the slopes assuming a local power law as well as the theoretical slopes (solid black) given by Equation (3). Both the largest and smallest Trojans approach the predicted slopes. The intermediate size regime shows a mild wave of the SFD, which steepens up between 1 and 10 km before becoming shallow below 1 km and finally converging to the strength regime slope.
Download figure:
Standard image High-resolution image
O'Brien & Greenberg (2003) showed for a population in collisional equilibrium that the differential power-law exponent, p, is connected to the slope, s, of the gravity or strength regime respectively via:

If  is independent of size (i.e., s = 0) we retrieve the classical Dohnanyi steady-state solution of p = 3.5 (Dohnanyi 1969). In our case the gravity regime of
  has a slope of s = 1.3 resulting in p = 3.05, which corresponds to a cumulative slope of 2.05. This is close to the observed slope between 10 and 100 km, which could indicate that this part of the population was in collisional equilibrium when the Trojans were captured. The slope at small sizes should correspond to the respective slope predicted for the strength regime. In between the two steep slopes of very small and large sizes we find a shallow slope in the diameter range from roughly 30 m to 1 km. Note that the location where the SFD transitions to the slope in the strength regime is precisely the location of the minimum in
  at roughly
  m of the traditionally shaped
  (Figure 10), and
  m for our unconventional
  (Figure 13). This makes sense as objects smaller than Dmin are stronger than their larger companions. As a consequence they can more easily break larger objects but not be easily broken up themselves.
Starting at large JTs (10 km < D < 100 km) in Figure 13, the SFD is largely unchanged from the initial SFD, and retains q ∼ 2. Few of these objects have been disrupted. At 10 km the slope begins to steepen slightly, reaching a peak at around 2.5 km before beginning to flatten. This indicates a steady-state "bump" is being formed by collisional evolution; it is analogous to the bump seen in the asteroid belt near 2–3 km, and we will discuss its origin below. The flattest part of the SFD occurs at ∼200 m. From there the slope steepens up again to reach the predicted slope in the strength regime for a collisionally-evolved Dohnyani-like SFD (O'Brien & Greenberg 2003). This final slope is reached as expected around  m. As with the asteroid belt, the limited number of projectiles near this minimum means there should be an excess of bodies at larger sizes corresponding to the targets that would be disrupted by 20 m projectiles. That explains the change of the aforementioned "bump" at around 1 km. Similarly, the slight "dip" in the population around 10 km is produced by the excess number of 1 km bodies in the bump. Intriguingly, there may be some limited evidence of a "dip" near 10 km Trojans. The tentative shallowing of the slope at small sizes (∼5 km Yoshida & Nakamura 2008; Wong & Brown 2015) is associated with a slightly steeper slope than the nominal 2.1 just before the apparent turnover. While this is not definitive proof, and details need to be worked out in future work and observations, we argue that there is sufficient support here to warrant seriously entertaining the possibility of an unorthodox
  with a Dmin at ∼20 m.
It is also worth mentioning that the bump at ∼1 km can cause the present-day population to exceed the initial population at that size (left panel of Figure 13). This is not observed in any of the cases that use a traditionally shaped  . The reason is that traditionally shaped
  produce a turnover at larger sizes (3–7 km) than for our unconventional
  (below 1 km). This leads to a smaller 1 km impactor population for traditional
  functions that is not large enough to disrupt many Trojans of the order of 10 km, i.e., it cannot produce a dip at those sizes. These larger breakups act as a source population for further 1 km Trojans and, therefore, allow a "bump" in the unconventional
  case.
case.
This model not only has the advantage of fitting into the data returned by the New Horizons mission (Singer et al. 2019; Morbidelli et al. 2021) and qualitatively matching the flattening of the Jupiter Trojan SFD at small sizes (Yoshida & Nakamura 2008; Wong & Brown 2015) but it also liberates the constraint on the collisional lifetime of Queta and thus the age of the Eurybates family.
In fact, this unconventional  would allow Queta to survive under any of our assumptions for at least the age of the solar system (Figures 8 and 11). The reason is that the projectile population capable of disrupting Queta is low and stays that way for 4.5 Gyr.
This unconventional  , though, would not match the strength of Proto-Euryabes derived from SPH simulations in Section 2.2. Note also that we have tested smaller values for Dmin, but they produce SFDs that are less consistent with New Horizons crater constraints because the shallow slope in the SFD continues to even smaller sizes than shown in Figure 13. This would make it difficult to reconcile the New Horizons crater record with the Kuiper Belt dust observations (see the argument in Morbidelli et al. 2021).
5. Discussion
The main avenue for disrupting the Euybates-Queta system is via direct impacts on Queta (Figures 8 and 11). Thus the crucial factor in the survival of Queta is the impactor population below 1 km. For Queta to survive from its creation in the Eurybates family-forming impact today and not have its survival be a fluke, we need to limit the number of projectiles that can disrupt Queta. From a collisional evolution perspective, that means the slope of the Jupiter Trojan SFD below 1 km needs to be shallow. This can be achieved by material with a traditionally shaped  or a more unorthodox shaped
  that has a minimum at 20 m.
In the first case, not all  functions allow Queta to survive the age of the solar system. If the collisional strength is too low, Queta is too easily disrupted, even though the Trojan SFD collisionally grinds down a substantial amount. For these kinds of runs, a minimum of 10Q0 is needed for the long-term (i.e., the age of the solar system) survival of Queta. The problem is that this value is inconsistent with the inferred strength against disruption we have found for Eurybates based on the family SFD (4.6Q0; Figure 3) derived from the SPH family-forming impact simulation. If, on the other hand, we relax the condition that the family be as old as 4.5 Gy and instead insist that
  then there is a 90% chance that the family is no older than 3.7 Gy (Figure 12). Thus for a traditional
  , either, the familiy is likely younger than the age of the solar system, or the collisional strength of Proto-Eurybates (4.6Q0) was lower than the overall Trojan population (>10Q0).
The case of a traditionally shaped  leads to a high probability that Queta experiences a catastrophic impact during the lifetime of the solar system. For Queta to still survive in such a scenario would require an additional mechanism. It is imaginable that Queta reaccumulated after a catastrophic disruption event, or that Queta was initially much larger than today and has undergone significant collisional grinding since. The latter, in particular, seems unlikely as impact simulations primarily result in small satellites (e.g., Durda et al. 2004). The existence of small satellites also seems consistent with observed satellites in the main belt (e.g., Figure 4 in Noll et al. 2020).
In the second case, with an unconventional shaped  that has its minimum at 20 m, Queta can easily survive the age of the solar system and, therefore, the Eurybates family can be as old as 4.5 Gy. But, again, this would bring the collisional strength of Proto-Eurybates and the overall Trojan population into disagreement.
The fact that several  are consistent with the survival of Queta, raises the question as to how we shall distinguish these cases. Figures 10 and 13 show that the Jupiter Trojan SFD can evolve to very different shapes when a variety of
  functions are used. This result has direct consequences for the expected crater SFD that the Lucy mission will observe. A back-of-the-envelope estimate shows that these contrasting Trojan SFDs lead to a stark difference in the expected number of craters forming on a Trojan over a given amount of time, e.g., Eurybates (Table 2). For the purpose of this estimate, we assume a crater to impactor ratio of 10 (e.g., Singer et al. 2019), e.g., a 1 km impactor would produce a 10 km crater. As Table 2 illustrates, the number of craters on Eurybates increases by a factor of four when the collisional strength increases from Q0 to 100Q0. The fact that our unconventional
  results in the largest number of craters seems counterintuitive at first but Figures 10 and 13 hold the answer. Because the shallow part of the Trojan SFD occurs at smaller sizes for the unconventional
  compared to the traditionally shaped
  , the overall population at sizes between 100 m and 1 km, corresponding to a projectile size range between 10 m and 100 m, is larger. This outcome leads to more craters. Additionally, the case of our unconventional
  likely leads to a saturated cratered surface, potentially complicating how our crater SFDs will be linked to the impactor SFD. Furthermore, the ratio between the number of craters larger than 1 km and 10 km is different for the case of our unconventional
  compared to the traditionally shaped
  with the latter producing more small craters for every large crater. In the case of traditionally shaped
  the slope of the Trojan SFD increases at roughly 300 m while for the unconventional
  the slope remains flat between 60 m and 1 km. This results in the different ratios of large to small impacts. Lucy, being able to measure craters as small as 70 m, and therefore sensitive to projectile sizes as small as 7 m, will be able to determine the crater SFD to sufficient precision to potentially differentiate between these case studies, assuming the surfaces are not saturated. In turn, this would allow us to indirectly estimate the collisional strength of the Trojans and the
  disruption law followed by both Trojans and similar objects.
Table 2. Minimum Number of Expected Craters on Eurybates, NC

| NC (>1 km) | NC (>10 km) |

|
|---|---|---|---|
| Q0 | 200 | 4 | 50 |
| 100Q0 | 800 | 16 | 50 |
 m m | 1200 | 50 | 24 |
Note. This calculation assumes impacts over 2 Gy and does not take into account saturation.
Download table as: ASCIITypeset image
6. Summary and Conclusions
In this work we have modeled the collisional evolution of the Jupiter Trojans and determined under which conditions the Eurybates-Queta system survives. We have shown that the collisional strength of the Jupiter Trojans and the age of the Eurybates family and Queta are correlated. This correlation depends on the initial Trojan SFD and how it collisionally evolves over time.
We found that the Eurybates family SFD matches best the outcome of SPH models of a 100 km rubble pile target (Benavidez et al. 2012) being hit by a ∼35 km impactor ( ) at 6 km s−1, and an impact angle of 75°. This corresponds to objects with a collisional strength of
  , where Q0 corresponds to slightly weaker material than the "weak ice" from Leinhardt & Stewart (2009).
In the case of static SFDs that do not evolve over time we examined a nominal case where the Jupiter Trojan SFD at small sizes (<10 km) has the same slope as between 10 and 100 km. With this SFD, and assuming the parent body of the Eurybates family was indeed weak, and is representative of Jupiter Trojans, we found that the Eurybates family must be a "young" family (1 Gy).
Should the Trojan SFD have a break at 1 km and have a shallow slope below that break then we cannot constrain the age of the Eurybates family and the collisional strength of the Trojans. The slope of the SFD below 1 km is the driving property to assess the family age and collisional strength. This is due to the fact that the population between 10 m and 1 km is the impactor population that can disrupt Eurybates and Queta.
Further, we found that the collisional grinding of the JT population results in an SFD that remains largely unaltered at large sizes (>10 km) but is then depleted at intermediate small sizes (10 m–1 km). This implies a turnover in the SFD, the location of which depends on the  . It is to be expected that the Trojan SFD bends toward a shallower slope between 1 and 10 km (Yoshida & Nakamura 2008; Wong & Brown 2015; Yoshida & Terai 2017).
For more realistic cases where the Trojan population is allowed to collisionally evolve we find the following: A material strength of at least 10Q0 is needed for Queta to survive the age of the solar system. For the likely strength of Eurybates (4.6Q0) there is a 90% chance that the family cannot be older than 3.7 Gy.
We find that an unconventional  with a minimum at
  m is a plausible candidate that does not require any additional assumptions on the Trojan SFD or the age of the Eurybates family. Further, it fits into the data returned by the New Horizons mission (Singer et al. 2019; Morbidelli et al. 2021) for the craters on Charon and KBO Arrokoth as well as the qualitative behavior of the Jupiter Trojan SFD at small sizes (Yoshida & Nakamura 2008; Wong & Brown 2015).
Finally, we have shown how different  will impact the expected number of craters on the targets of the Lucy mission. The data from Lucy may be able to differentiate between different cases of
  and subsequently indirectly determine the collisional strength of Jupiter Trojans.
The work in this paper was supported by the Lucy mission through NASA's Discovery Program grant NNM16AA08C.
R.M. and H.F.L. acknowledge the support from NASA's Emerging Worlds program, grant NNX17AE83G.
R.M. also acknowledges the support from the Swiss National Science Foundation (SNSF) under the grant P2BEP2_184482, and funding from the European Research Council (ERC) under the European Union's Horizon 2020 research and innovation program (grant agreement No. 101019380). D.N. acknowledges support from NASA SSW.
The work of R.D. was supported by NASA's Emerging Worlds program, grant 80NSSC21K0387.
I.W. is supported by an appointment to the NASA Postdoctoral Program at the NASA Goddard Space Flight Center, administered by Oak Ridge Associated Universities under contract with NASA.
Appendix
The dynamical and color properties of the Eurybates family used in this work are listed in Tables 3 and 4.
Table 3. List of all 400 Eurybates Family Members
| nr. | prov. des. | H a | D [km] b | aprop [au] c | eprop c | iprop [°] c |
|---|---|---|---|---|---|---|
| 3548 | 1973 SO | 9.85 | 63.885 ± 0.299 | 5.29758 ± 0.00065 | 0.04351 ± 0.00014 | 7.4150 ± 0.0012 |
| 5258 | 1989 AU1 | 10.33 | 53.275 ± 4.429 | 5.28801 ± 0.00115 | 0.05898 ± 0.00016 | 7.0285 ± 0.0018 |
| 8060 | 1973 SD1 | 10.95 | 37.873 ± 0.567 | 5.29164 ± 0.00054 | 0.05452 ± 0.00119 | 7.3082 ± 0.0006 |
| 9818 | 6591 P-L | 11.07 | 28.076 ± 3.215 | 5.28832 ± 0.00114 | 0.04650 ± 0.00020 | 7.4624 ± 0.0092 |
| 13862 | 1999 XT160 | 11.6 | 24.835 ± 0.589 | 5.29245 ± 0.00012 | 0.04372 ± 0.00003 | 7.3313 ± 0.0004 |
Notes. Family members were identified by HCM, including the likely interloper (5258) Rhoeo (see discussion in Section 2). The table gives the asteroid number (nr.), the provisional designation (prov. des.), the absolute magnitude (H), the diameter (D), as well as the proper semimajor axis (aprop), eccentricity (eprop), and inclination (iprop). The source number for each property is given in brackets. A machine-readable version of this table is available at https://doi.org/10.5281/zenodo.7016865.
a Minor Planet Center; 2020-12-08, https://minorplanetcenter.net/iau/lists/JupiterTrojans.html. b NEOWISE data v2.0, Mainzer et al. (2019), https://sbn.psi.edu/pds/resource/neowisediam.html. c Mira Brož (Holt et al. 2020).Only a portion of this table is shown here to demonstrate its form and content. A machine-readable version of the full table is available.
Download table as: DataTypeset image
Table 4. Color Data for Eurybates Family Members
| nr. | prov. des. | H a | D (km) b | g–i (mag) c | S (%/103 Å) d | g–r (mag) e |
|---|---|---|---|---|---|---|
| 3548 | 1973 SO | 9.85 | 63.885 ± 0.299 | −0.18 ± 0.57 | 0.51 
| |
| 5258 | 1989 AU1 | 10.33 | 53.275 ± 4.429 | 0.6 
| ||
| 8060 | 1973 SD1 | 10.95 | 37.873 ± 0.567 | 0.51 
| ||
| 9818 | 6591 P-L | 11.07 | 28.076 ± 3.215 | 0.64 ± 0.022 | 2.12 ± 0.72 | 0.49 
|
| 13862 | 1999 XT160 | 11.6 | 24.835 ± 0.589 | 1.59 ± 0.7 | 0.46 
| |
| 18060 | 1999 XJ156 | 11.12 | 36.431 ± 3.966 | 0.69 ± 0.045 | 2.86 ± 0.6 | 0.51 
|
| 24380 | 2000 AA160 | 11.2 | 31.607 ± 0.266 | 0.34 ± 0.65 | 0.51 
| |
| 24420 | 2000 BU22 | 11.45 | 21.723 ± 1.211 | 1.65 ± 0.7 | 0.55 
| |
| 24426 | 2000 CR12 | 12.13 | 14.336 ± 1.007 | 0.71 ± 0.054 | 4.64 ± 0.8 | 0.49 
|
| 28958 | 2001 CQ42 | 12.18 | 21.577 ± 0.652 | −0.04 ± 0.8 | 0.41 
| |
| 39285 | 2001 BP75 | 12.49 | 17.602 ± 0.499 | 0.25 ± 0.69 | 0.48 
| |
| 39795 | 1997 SF28 | 12.42 | 18.342 ± 0.742 | 0.54 
| ||
| 43212 | 2000 AL113 | 12.2 | 19.212 ± 1.09 | 0.56 ± 0.028 | 1.19 ± 0.78 | 0.53 
|
| 43436 | 2000 YD42 | 12.12 | 0.45 
| |||
| 53469 | 2000 AX8 | 12.39 | 18.453 ± 0.354 | 0.17 ± 0.8 | 0.44 
| |
| 65150 | 2002 CA126 | 12.47 | 4.14 ± 0.7 | |||
| 65225 | 2002 EK44 | 12.36 | 16.654 ± 0.234 | 0.64 ± 0.036 | 0.97 ± 0.85 | 0.46 
|
| 88229 | 2001 BZ54 | 12.32 | 0.39 
| |||
| 111805 | 2002 CZ256 | 12.58 | 0.605 ± 0.025 | 0.48 
| ||
| 127846 | 2003 FO111 | 12.47 | 0.54 
| |||
| 160856 | 2001 DU92 | 12.59 | 16.216 ± 0.54 | 0.5 
| ||
| 163135 | 2002 CT22 | 12.58 | 16.661 ± 0.735 | 2.76 ± 0.73 | ||
| 163189 | 2002 EU6 | 12.9 | 16.23 ± 0.781 | 0.53 
| ||
| 163216 | 2002 EN68 | 12.55 | 13.25 ± 0.801 | 3.6 ± 0.98 | 0.52 
| |
| 166211 | 2002 EP135 | 12.88 | 14.412 ± 1.052 | 0.57
| ||
| 191088 | 2002 CP286 | 12.95 | 0.8 ± 0.072 | 0.5 
| ||
| 192388 | 1996 RD29 | 12.91 | 2.76 ± 0.89 | |||
| 192929 | 2000 AT44 | 12.5 | 13.339 ± 0.482 | −0.53 ± 0.83 | ||
| 195412 | 2002 GF39 | 12.45 | 19.051 ± 0.439 | 0.46 
| ||
| 200024 | 2007 OO7 | 12.8 | 13.808 ± 0.886 | 0.55 
| ||
| 200032 | 2007 PU43 | 12.89 | 17.945 ± 0.582 | 0.6 
| ||
| 210237 | 2007 RQ154 | 12.75 | 16.698 ± 0.713 | 0.5 
| ||
| 214376 | 2005 LF20 | 13.06 | 0.52 
| |||
| 219835 | 2002 CH82 | 13.29 | 0.72 ± 0.05 | |||
| 223251 | 2003 FB70 | 12.6 | 17.702 ± 0.529 | 0.63 ± 0.042 | ||
| 237035 | 2008 SL91 | 13.37 | 11.96 ± 0.773 | 0.59 
| ||
| 246145 | 2007 PE9 | 13.21 | 12.093 ± 0.601 | 0.46 
| ||
| 252683 | 2002 AE166 | 13 | 0.58 ± 0.028 | |||
| 252711 | 2002 CU152 | 13.2 | 0.59 ± 0.057 | |||
| 259316 | 2003 FJ38 | 13.9 | 0.53 ± 0.078 | |||
| 313024 | 2000 AV210 | 13.6 | 10.805 ± 0.599 | 0.96 ± 0.092 |
Notes. Family members were identified by HCM, including the likely interloper (5258) Rhoeo. The table gives the asteroid number (nr.), the provisional designation (prov. des.), the absolute magnitude (H), the diameter (D), as well as the g–i color from the Sloan Digital Sky Survey, the spectral slopes between 0.3 and 0.9μm (S), and the g–r color from the ZTF observations. A machine-readable version of this table is available at https://doi.org/10.5281/zenodo.7016865.
a Minor Planet Center; 2020-12-08, https://minorplanetcenter.net//iau/lists/JupiterTrojans.html. b NEOWISE data v2.0, Mainzer et al. (2019), https://sbn.psi.edu/pds/resource/neowisediam.html. c Sloan Digital Sky Survey (SDSS) Moving Object Catalog (Ivezić et al. 2001), https://sbn.psi.edu/pds/resource/sdssmoc.html. d Fornasier et al. (2007), https://sbn.psi.edu/pds/resource/fornasier.html. e Schemel & Brown (2021).A machine-readable version of the table is available.
Download table as: DataTypeset image
Footnotes
- 4
Sometimes impact simulation results are scaled to different target sizes to fit family SFDs (e.g., Durda et al. 2004) but this was not needed here.