


Abstract
We report the results of model simulations performed to explain the nature of a sodium emission feature in Io Neutral Clouds. The feature was detected via high-resolution spectroscopic observations from the 3.6 m Italian telescope TNG. The emission feature is blueshifted compared to the main emission (the banana-shaped Neutral Cloud of Io) by a few tens of km s−1, and it is most prominent when Io is a few tens of degrees before eclipse behind Jupiters shadow. The feature's morphology changes with time, indicative of a geometrical effect. We constrained its direction, velocity, and column density with a model of sodium atom trajectories under the influence of Io's and Jupiter's gravity, and solar radiation pressure. The model that best explains this emission feature has the atoms injected into the exosphere from the leading/sub-Jovian hemisphere of Io (45°–68° west longitude), with velocities from 50 to 90 km s−1 relative to Io. These trajectories are consistent with those of negatively charged dust grains (radius ∼10 nm) accelerated by the corotational electric field of Jupiters magnetosphere. We propose that sputtering of sodium atoms from Na-bearing molecules (NaCl and Na2SO4) in these nanodust grains is the process responsible for our emission feature. Both modeling and observational constraints provide an order-of-magnitude estimate of the sodium production rate of ∼1026 s−1. Our work provides another method to monitor the amount of material that Io is supplying to its Neutral Clouds and plasma torus.
Export citation and abstract BibTeX RIS
1. Introduction
Io's Neutral Clouds are one of the brightest visible manifestations of the intense volcanic and magnetospheric activity in the Jovian system. All the material that fills the Io Plasma Torus and Io's Neutral Clouds ultimately comes from the intense volcanic activity of Io. Since the discovery of sodium at Io (Brown 1974), and its Neutral Cloud (Trafton et al. 1974), this minor but bright species has been used to monitor the response of Io's Neutral Cloud to the changes of its drivers (Io volcanic activity and Jupiter magnetosphere). The resonant scattering efficiency (the so-called g value) of sodium is orders of magnitude greater than the dominant species in Io's Neutral Clouds (S and O and their molecular compounds). Moreover, the wavelength of the sodium doublet (the D2 line at D1 line around 5900 Å) is such that it can be easily detected from the ground. Over the past decades, observations and models have identified structures in the Neutral Clouds, each related to a particular source process and interaction with the Jovian magnetosphere. The most prominent of these structures, and the first to be discovered, is the corona, sometimes referred to as the "banana cloud" (the "Region B" in Brown et al. 1975), composed of slowly escaping sodium atoms (a few km s−1 relative to Io). Its peculiar morphology, with the leading part more extended (about 60° along the orbit) than the trailing part (30° along the orbit), is controlled by celestial mechanics and by ionization from the plasma torus, which is warmer outwards from Io's orbit compared to inwards (Nash et al. 1986). Another feature of the sodium Neutral Clouds is the "jet" (or directional feature; Goldberg et al. 1984), much more variable than the banana cloud, and composed of much more energetic atoms. The "jet" extends from Io in the anti-Jupiter direction, oriented approximately perpendicularly to the local Jovian magnetic field (Wilson & Schneider 1994). It is probably caused by prompt pickup ion neutralization very close to Io, its narrowness indicating an unperturbed Jovian magnetic field at Io (Wilson & Schneider 1999). The outer acceleration results from the corotational electric field applied to positively charged ions. Finally, a more diffuse feature is the "stream" (Schneider et al. 1991) of fast moving neutral sodium atoms resulting from dissociative recombination of fast molecular sodium-bearing ions (most likely NaCl+) corotating with Jupiter at ∼70 km s−1. These atoms can be found all around Ios orbit. Over many orbits around Jupiter, this stream creates the vast, faint neutral sodium cloud detected hundreds of Jupiter radii from Jupiter (Mendillo et al. 1990). All these features contribute to the roughly 1 ton of plasma that is injected in the Io Plasma Torus every second (Schneider & Bagenal 2007). Their morphology depends on several factors, including Io's position (both orbital longitude and magnetic latitude) Jupiter's magnetic field, and Io's volcanic activity (see review by Bagenal & Dols 2020). For example, it has long been debated whether the sodium Neutral Clouds decrease in extent during eclipses behind Jupiter, due to condensation of Io's atmosphere and/or to a suppression of solar photons available for photodissociation of sodium-bearing molecular compounds. It was to test these possibilities that we performed ground-based observations of Io before and after eclipses, in 2007. We discovered that solar flux is an important factor in supplying the sodium atoms to the Neutral Clouds, and that suppression of photodissociation of sodium-bearing molecules (most likely NaCl) during eclipse drives a decrease in exospheric Na atoms soon after egress (Grava et al. 2014).
During those observing runs, we also discovered an additional spectroscopic feature: an emission of sodium (visible at both D-lines) blueshifted (i.e., directed toward the observer and thus toward Jupiter) by tens of km s−1 relative to Io, hence moving much faster than the escape speed at Io (see Figure 1). We first reported this feature in Schneider et al. (2008) and performed additional observations at the same telescope in 2009. This paper describes the analysis of this feature using simulations of sodium atoms in Io's Neutral Clouds and suggests possible explanations.
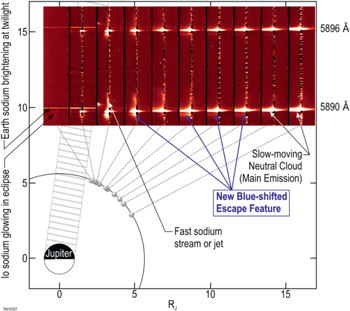
Figure 1. Two-dimensional spectra of Io with the continuum subtracted, stacked over a scheme of the observational geometry. The spectra progress in time from right to left, and wavelength run from bottom to top. The width of the spectra, corresponding to the length of the slit, is 27''. RJ = Jupiter radius ∼70,000 km. In the spectra, Jupiter direction is to the left of Io's subtracted continuum.
Download figure:
Standard image High-resolution image2. Observations and Data Reduction
Spectra were collected by the now-decommissioned high-resolution échelle spectrograph SARG mounted at the 3.6 m Italian telescope Telescopio Nazionale Galileo (TNG) during several nights spanning 2 yr, and different geometric configurations of Io. Spectra taken in 2007 were analyzed by Grava et al. (2014) and included in this work for completeness, while spectra taken in 2009 are analyzed here for the first time. The spectrograph's slit was 26."7 long and 0."4 wide, had a spectral resolution of λ/Δλ ∼ 115,000, and was placed almost always parallel to Jupiter's rotational equator and centered on Io (or on other Galilean satellites, when used for calibration). The exposure time was almost always 600 s. The 2007 spectra were obtained with an interference filter which blocked all photons but those with wavelengths close to the sodium doublet. This procedure allowed us to use the full extent of the long slit without order overlapping. The 2009 spectra were obtained without such interference filter, to collect light from the entire bandpass of SARG (3700–10,000 Å) and to study, therefore, other species. As such, only the central ∼50 pixels were used, and the remaining ∼30 pixels at the edges were excluded due to order contamination. The effective length of the slit in this case was 17."7.
Data reduction of the spectra was described in depth in Grava et al. (2014) and is summarized here. Standard data reduction steps such as subtraction of bias, flatfielding, and wavelength calibration (using a Th–Ar lamp) were performed using IRAF routines. Specific data reduction steps pertinent to our data set were performed later and included: (1) removal of an interference pattern caused by the sodium filter (for 2007 observations only); (2) removal of a "pedestal" (residual background); (3) removal of a "ghost" of Jupiter's spectrum on top of Io spectra; (4) removal of telluric absorption, performed using rapidly rotating O- and B-type stars devoid of absorption lines observed at several airmasses that bracketed ours; (5) subtraction of the "continuum," i.e., the solar light reflected off Io's disk using spectra of other Galilean satellites (Europa, Ganymede, and, more rarely, Callisto) properly shifted to account for the different Doppler speeds; (6) conversion of sodium brightness from counts s−1 to Rayleighs (1 R = 106/4π photons cm−2 s−1 sr−1; Hunten et al. 1956) using Jupiter spectra and the well-measured intrinsic brightness of Jupiter at the sodium wavelength (5.5 MR Å−1; Brown & Schneider 1981). During most of the nights the seeing was good, never exceeding 16" as FWHM (calculated as a deconvolution of a Gaussian fit to Io's continuum and the theoretical diameter of Io's disk, 1."2). Details of observations are summarized in Table 1.
Table 1. List of Observations
| Filename | Obs. Mid-time (UT) | t (s) | ssl (°) | λIII (°) | Mlat (°) | p.a. (°) |
|---|---|---|---|---|---|---|
| JDEI0102 | 2007 Apr 25T02:01:33 | 600 | 316 | 29 | −10 | 66 |
| JDEI0106 | 2007 Apr 25T03:07:52 | 600 | 326 | 59 | −8 | 66 |
| JDEI0109 | 2007 Apr 25T03:39:07 | 600 | 330 | 74 | −6 | 66 |
| JDEI0112 | 2007 Apr 25T04:14:26 | 600 | 335 | 90 | −4 | 66 |
| JDEI0114 | 2007 Apr 25T04:50:26 | 600 | 340 | 107 | −1 | 66 |
| JDEI0115 | 2007 Apr 25T05:02:42 | 600 | 342 | 112 | 0 | 66 |
| JDEI0119 | 2007 Apr 25T05:41:37 | 600 | 347 | 130 | 3 | 90 |
| JDEI0120 | 2007 Apr 25T05:53:17 | 600 | 349 | 136 | 4 | 90 |
| JDEI0121 | 2007 Apr 25T06:04:55 | 600 | 351 | 141 | 5 | 90 |
| JDEI0122 | 2007 Apr 25T06:12:44 | 120 | 352 | 146 | 5 | 90 |
| JDWF0002 | 2007 May 11T00:16:32 | 600 | 316 | 213 | 9 | 85 |
| JDWF0004 | 2007 May 11T00:39:57 | 600 | 319 | 223 | 9 | 90 |
| JDWF0008 | 2007 May 11T01:22:55 | 600 | 326 | 243 | 7 | 90 |
| JDWF0010 | 2007 May 11T01:37:36 | 600 | 328 | 250 | 6 | 90 |
| JDWF0015 | 2007 May 11T02:30:28 | 600 | 335 | 274 | 3 | 90 |
| JDWF0017 | 2007 May 11T02:46:03 | 600 | 337 | 282 | 2 | 90 |
| JDWF0022 | 2007 May 11T03:37:23 | 600 | 345 | 305 | −2 | 90 |
| JDWF0024 | 2007 May 11T03:52:34 | 600 | 347 | 312 | −3 | 90 |
| JDWF0025 | 2007 May 11T04:04:15 | 600 | 348 | 318 | −4 | 90 |
| JDWF0026 | 2007 May 11T04:18:16 | 600 | 350 | 324 | −5 | 90 |
| JFQI0034 | 2007 Jun 20T23:37:43 | 600 | 11 | 183 | 9 | 90 |
| JFQI0035 | 2007 Jun 20T23:49:40 | 600 | 12 | 188 | 9 | 90 |
| JFQI0037 | 2007 Jun 21T00:05:42 | 600 | 14 | 196 | 10 | 90 |
| JFQI0043 | 2007 Jun 21T01:05:08 | 600 | 23 | 224 | 9 | 90 |
| JFQI0045 | 2007 Jun 21T01:19:53 | 600 | 25 | 230 | 8 | 90 |
| JFQI0049 | 2007 Jun 21T01:59:44 | 600 | 31 | 249 | 7 | 90 |
| JFQI0051 | 2007 Jun 21T02:14:04 | 600 | 33 | 256 | 6 | 90 |
| JFQI0056 | 2007 Jun 21T03:12:27 | 600 | 41 | 282 | 2 | 90 |
| JFQI0058 | 2007 Jun 21T03:28:22 | 600 | 43 | 290 | 0 | 90 |
| JGGV0044 | 2007 Jul 6T21:53:49 | 600 | 10 | 7 | −9 | 90 |
| JGGV0045 | 2007 Jul 6T22:05:48 | 600 | 12 | 13 | −9 | 90 |
| JGGV0049 | 2007 Jul 6T22:36:19 | 600 | 16 | 27 | −10 | 90 |
| JGGV0052 | 2007 Jul 6T23:06:43 | 600 | 21 | 41 | −9 | 90 |
| JGGV0058 | 2007 Jul 7T00:02:07 | 600 | 29 | 67 | −7 | 90 |
| JGGV0062 | 2007 Jul 7T00:36:20 | 600 | 33 | 83 | −5 | 90 |
| JGGV0067 | 2007 Jul 7T01:20:25 | 600 | 40 | 103 | −1 | 90 |
| KPBB0028 | 2009 Sep 7T21:55:26 | 180 | 234 | 86 | −4 | −270 |
| KPBB0034 | 2009 Sep 7T23:38:40 | 600 | 249 | 132 | 3 | −270 |
| KPCB0056 | 2009 Sep 8T23:43:16 | 600 | 93 | 81 | −5 | −270 |
| KPCB0059 | 2009 Sep 9T00:24:09 | 600 | 99 | 100 | −2 | −180 |
| KPFB0035 | 2009 Sep 9T20:22:05 | 600 | 268 | 296 | −1 | −270 |
| KPFB0038 | 2009 Sep 9T20:59:06 | 600 | 273 | 313 | −3 | −180 |
| KPFB0041 | 2009 Sep 9T21:33:50 | 600 | 278 | 329 | −6 | −270 |
| KPFB0047 | 2009 Sep 9T22:27:46 | 600 | 286 | 353 | −8 | −270 |
| KPIB0078 | 2009 Sep 12T23:43:39 | 600 | 187 | 230 | 9 | −180 |
| KPIB0081 | 2009 Sep 13T00:25:12 | 600 | 193 | 249 | 7 | −270 |
| KPJB0031 | 2009 Sep 13T21:33:57 | 600 | 12 | 116 | 1 | −270 |
| KPJB0033 | 2009 Sep 13T21:51:41 | 600 | 14 | 124 | 2 | −270 |
| KPJB0050 | 2009 Sep 14T01:30:31 | 600 | 45 | 226 | 9 | −270 |
Note. t = exposure time. ssl = subsolar longitude, counted westward (or counterclockwise) on Io. It is also equivalent to Io's orbital longitude, with 0° corresponding to superior conjunction (Io opposite to Earth behind Jupiter) and 90° corresponding to Eastern elongation. λIII and Mlat are Io's system III longitude and magnetic latitude, respectively. p.a. = position angle, or the slit's angle relative to Jupiter's rotation axis, counted counterclockwise starting from Jupiter's north pole.
Download table as: ASCIITypeset image
3. The Blueshifted Emission Feature
Figure 2 shows a typical spectrum of Io. On the left is the average of Io's brightness over detector columns 31–33, corresponding to a distance of 1.7–2.9 RIo eastwards on the sky plane (toward Jupiter, in this case) of Io's center (1 RIo ∼1820 km) and, in dashed line, the g values. The g value (or g factor) is the number of solar photons resonantly scattered each second by each sodium atom. In optically thin exospheres, like Io's neutral clouds, the brightness I (in Rayleighs) is directly related to the line-of-sight column density N (in atoms cm−2) by the g-value g (Brown & Yung 1976):

The g value (expressed in photons atoms−1 s−1) is related to the solar spectrum, and depends, among other things, on the heliocentric radial velocity Δv of sodium atoms, owing to the deep Fraunhofer absorption in the solar spectrum Hunten et al. (1988). We used g values for sodium from Killen et al. (2009). Δv is measured in our spectra by the Doppler shift Δλ of Io relative to the reference wavelengths λ of the sodium D-lines (5889.95 and 5895.92 Å for the D2 and D1 line, respectively):

where c is the speed of light. The resulting Δv is referred to Io's reference frame, which is in itself moving relative to the Sun. An atom at rest at Io moving away from the Sun (like at western elongations) will "see" a redshifted solar spectrum. Therefore, to properly convert brightness into column densities it is necessary to blueshift the g values, i.e., shifting them toward negative velocities. This is shown in Figure 2, panel (a), which shows that the "dip" in the emission line (in Rayleighs) at −5 km s−1 is caused by the "dip" of the Fraunhofer line of the g value at −2.5 km s−1. The resulting division gives the column density without such "dip" (panel (b)), but with a "bump" on the blue side of the peak (negative velocities). This is the new emission feature. It is reminiscent of the "skirt" detected first by Trafton (1975) and then by Cremonese et al. (1992) and interpreted by Trafton & Macy (1977, 1978) to be due to sodium atoms streaming away from Io at moderate speeds (18 km s−1 at most) in the leading direction. However, it is different from that because the "bump" lies on the opposite side. Our "bump" is more prominent on the short wavelength side when Io is west of Jupiter. Moreover, as we shall see briefly, the feature changes Doppler shift through the night. Note that in our observations the west direction corresponds to the orbital trailing side of Io. In terms of plasma flow, the trailing side corresponds to the upstream side, and East is the leading (or downstream) side.

Figure 2. Left: spectrum of one Io observation (solid line) and the g-value used (dashed line) around the D2 emission line. Right: their ratio, which is the column density.
Download figure:
Standard image High-resolution imageWe performed the conversion from brightness to column density for all of our 2D spectra. An example of the resulting 2D spectra, together with the geometry of the observation, is shown in Figure 3 (the others can be found as a Figure set in the online Journal). In this figure, Io is about to enter Jupiter's shadow and the main emission feature (the "banana cloud"), being approximately at rest relative to Io (white horizontal dashed lines), dominates the spectra. The faint, straight emission line traversing the whole slit length is Earth's sodium layer at 90 km altitude resonantly scattering solar photons shortly before dawn. The streak of diffuse emission very close to Io on the Eastern side (toward Jupiter) extending to ∼75 km s−1 is the stream of fast sodium atoms that feed the giant sodium nebula (e.g., Flynn et al. 1992). The feature modeled in this paper is the extended emission blueshifted by few of tens of km s−1 with respect to Io, meaning these sodium atoms are moving toward the observer. The feature is seen here in the eastern half of the slit (left, in the figure), i.e., toward Jupiter.
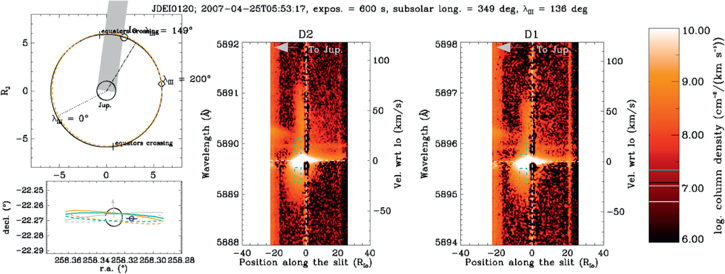
Figure 3.
Composite image to put our 2D spectra in the observational perspective. The two right panels show our 2D Io spectra converted into column densities, in logarithmic color scale (D2 and D1, respectively). The region enclosed within the cyan dashed rectangles (7–22 km s−1 and 3–7 Io radii) is used to compute the average source rate discussed in Section 5 and listed in Table 2. The gray arrows indicate the direction to Jupiter (toward left, in this case). The left panels show a simplified view of the geometry of the observations, from the celestial north pole (top) and from Earth (bottom), similar to Cremonese et al. (1992). The black solid circle on top (and gray on bottom) represents Io's orbit, in Jupiter's equatorial plane. Orange dashed circles on both top and bottom-left panels represent Jupiter's magnetic equator at Io's distance, and include the tilt of 9 8 toward System III magnetic longitude λIII = 200° and the offset of 0.12 RJ toward λIII = 149°. Cyan circle in bottom-left panel represents the centrifugal equator, where the cold plasma ions reside. The arrow in the lower left panel indicates the rotation axis of Jupiter, and is black or gray if it points toward or away from the observer, respectively. Dashed lines in lower left panel indicate portions of the circles away from the observer. The blue circle and the small black line crossing it represent Io's disk and the spectrograph's slit, respectively. All objects in the two left panels are drawn to scale, except Io, for which the size has been magnified by 10. The complete set (49 images) for all observations can be found as a Figure set in the online journal. (The complete figure set (49 images) is available.)
Download figure:
Standard image High-resolution image4. Modeling the Emission Feature
We applied our Monte Carlo model of sodium atom trajectories (Burger et al. 2014) to reproduce our observations as closely as possible, by including the location and direction of ejection and the velocity distribution of ejected atoms. These parameters are constrained by our observations. The goal is to reproduce the emission feature and its temporal variability.
Figure 4 illustrates the change in time of the new feature's morphology at different orbital (or subsolar) longitudes. This sequence shows that the blueshifted feature, more prominent toward the end of the observing run, early in the night is redshifted by a similarly high speed (>10 km s−1). The transition from red to blueshifts suggests that Na is ejected in a direction that is roughly perpendicular to the Io-observer line when the subsolar longitude is ∼330° (between the 4th and the 5th spectrum in Figure 4). This red to blueshift can then be explained by the changing observing geometry as Io orbits Jupiter. This peculiar behavior inspired our modeling approach. We first modeled the trajectories of the neutral sodium atoms (Section 4.1) and then found a plausible physical mechanism that can bring these sodium atoms at the location and with the speed we observe them (Section 4.1).
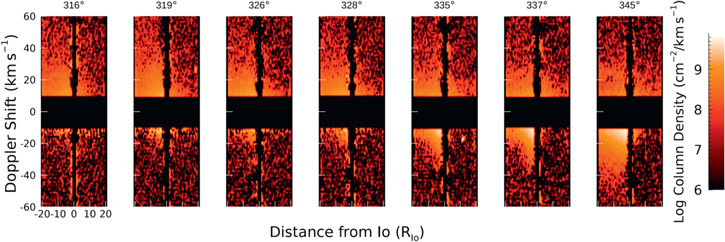
Figure 4. Observations taken in 2007 May, calibrated in column density per unit velocity at different orbital (or subsolar) longitudes. Doppler velocities less than 10 km s−1, which include the "banana cloud," have been blacked out to highlight the feature, which transitions from redshifted to blueshifted in this 4 hr time span. Ios orbital position is given as subsolar longitude and is indicated at the top of each plot. Io's continuum has been carefully removed with the procedure discussed in the text.
Download figure:
Standard image High-resolution image4.1. Neutral Sodium Atoms Trajectories
To simulate the observations we used the Monte Carlo model that is described in Burger et al. (2014). In this model, atoms are tracked under the forces of gravity and solar radiation pressure. The equations of motion are solved with a 5th order, adaptive step-size Runge–Kutta algorithm. Atoms are ejected at randomly selected times between the start and end of the model run so that the simulation contains a mixture of freshly released and older atoms. Loss processes include photoionization, electron-impact ionization, and charge exchange, though the atoms in the simulations shown below are mostly lost by leaving the small field of view. The observation geometry was recreated using the SPICE toolkit (Acton 1996).
We ran the model many times with different initial conditions in order to determine the direction and speed of Na that would reproduce the red to blueshift in Figure 4. Sodium atoms are ejected radially in intervals 1125 wide. The origin of the ejected atoms is labeled in Io's west longitude, where 0° corresponds to the sub-Jupiter meridian and 90° points along Ios orbital motion (the "leading" direction). Speeds values from 4 to 130 km s−1 were used, each with a narrow distribution (each bin being 10 m s−1 wide).
Each of the two free parameters we used to reproduce our observations affects only one aspect of the emission feature. The ejection speed distribution affects the Doppler shift (wavelength dimension), while the ejection location affects the morphology of the emission feature (spatial direction). This is illustrated in Figure 5, where we show the effects of changing these parameters, compared to the nominal, best model.

Figure 5. The simulation from the best model is shown at the center. The other four subpanels show models with the right ejection direction but too low (left panel) or too fast (right panel) ejection speed, or models with the right ejection speed but wrong directions (top and bottom panels). Velocities within 10 km s−1, marked by horizontal dashed lines, have been masked to leave out the main emission feature. The vertical dashed line represents the region of Io's continuum.
Download figure:
Standard image High-resolution imageWe find that the best combination of parameters to reproduce our observations is a broad speed distribution, with ejection velocities relative to Io of 50–90 km s−1, and a relatively narrow range of ejection location: 45°–68° of Io west longitude, meaning an ejection from the sub-Jovian/leading hemisphere. Models with the nominal direction but lower speed (40 km s−1) or higher speed (130 km s−1) fail to match the magnitude of the Doppler shift, though they maintain the red-to-blue transition at a subsolar point of ∼ 330° (left-right panels in Figure 5). The mismatches in direction include one angular bin toward the leading direction and one bin toward the sub-Jovian direction, and these both fail to reproduce the red-to-blue transition and the magnitude of the Doppler shift (top-down panels in Figure 5).
Figure 6 shows the best simulations compared to some of the observations. The rest of the data-model comparison can be found in the animation associated with Figure 6 in the online journal. The nominal model shown here (in both Figures 5 and 6) includes speeds of 57 km s−1 and 90 km s−1, though lower speeds could be included without significantly changing the result. Figure 6 illustrates how our model can reproduce the shift in velocity relative to Io (from red, or positive, to blue, or negative) within the same amount of time (about 4 hr).
Figure 6. Comparison between four spectra obtained in 2007 May (top panel) and their best-fit model simulations (bottom panel). The simulations are able to reproduce the shift in Doppler velocity, from positive relative velocities (moving away from the observer) to negative ones (moving toward the observer). An animation of this comparison for all nine observations in 2007 May is available in the online Journal. The animation has a slightly different format from the one here shown, in that it has the observations on the left and the corresponding best model to the right.
(An animation of this figure is available.)
Download figure:
Video Standard image High-resolution imageFigure 7 shows a top-down view of the nominal model of sodium trajectories near the beginning and end of the observing sequence. In this image, directions toward the observer (Earth, ⊕, and Jupiter, ♃) are indicated. The red-to-blue shift is seen here as a change in ejection direction as seen from Earth. Also, it can be noted that the ejection direction is roughly halfway, in terms of degrees, between the leading direction and Jupiter direction.

Figure 7. Top-down view of the model shown in Figure 6. The left panel shows the beginning of the observation sequence, when the Na is directed away from the observer to produce a red Doppler shift. The right panel shows the end of the sequence, when the Na is blueshifted. The white arrow points toward Jupiter, Earth is straight down.
Download figure:
Standard image High-resolution image4.2. Dust Grains Trajectories
Having found the characteristics of the sodium feature (speed distribution and direction), we need to identify a process that may bring sodium atoms at the location and speed observed. The direction of the blueshifted sodium feature (toward Jupiter) is consistent with negatively charged particles that move following Jupiter magnetosphere's corotational electric field (e.g., Horányi et al. 1997). There are two possible candidates: sodium-bearing negative ions that are promptly neutralized and negatively charged Na-rich dust grains from which sodium atoms are liberated. In this section we discuss the latter, as many of the grains' properties agree with our directional feature; at the end of Section 5.1 we briefly discuss the negative ions hypothesis.
Dust in the Jovian environment has been detected by multiple spacecraft: Ulysses (Grün et al. 1993), Galileo (Grün et al. 1996), and Cassini (Postberg et al. 2006). All these observations are consistent with electrically charged dust grain of radius ∼10 nm (Zook et al. 1996). The periodicity of the dust impact signal in Galileo data was one of the early indicators that Io, and not the gossamer rings, was the source of such dust grains (Graps et al. 2000). Subsequently, the Cosmic Dust Analyser (CDA) onboard Cassini was able to distinguish the composition of these grains. NaCl was the dominant species identified by CDA, followed by other components like Na2SO4 and K2SO4 (Postberg et al. 2006). This is in contrast with the main composition of Io's atmosphere and neutral clouds, where NaCl, Na+, and Cl+ are just trace species (NaCl fraction in composition is less than 1%, while the Na+ and Cl+ concentration in the torus is between 2% and 6%; Lellouch et al. 2003; Küppers & Schneider 2000) The inverse trend in composition for dust may be related to the process that ultimately ejects these particles in the first place, i.e., volcanic eruptions. Because of their high condensation temperature, NaCl and KCl are abundant condensates 20 minutes after outgassing from the vent; while sulfuric components, due to their lower condensation temperature, are still far from condensation (Zhang et al. 2004).
We performed simulations of the trajectory of negatively charged nanodust grains of various sizes. We assume that the dust particles 10 nm in radii start with a circular Keplerian motion at Io's orbit and an initial charge of 20 electric charge, corresponding to a surface potential of −3 V. The charging and dynamical evolution of nanometer-sized grains is modeled as described in Horányi et al. (1997). For individual dust grains, two equations are integrated simultaneously: the equation of motion and the grain charging equation. The equation of motion considers the gravity of Jupiter and the Lorentz forces acting on the grain from the corotating magnetosphere. The grain charging equation depends on plasma properties at the grain's location and determines the grain charge-to-mass ratio, essential to calculate the Lorentz forces. Grains can be charged negatively or positively, depending on the plasma environment, and the charging begins almost instantaneously.
A top-down view of the trajectory of a negatively charged dust grain of radius 10 nm, as well as a positively charged one (same size), is shown in Figure 8. Figure 9 shows the direction, the relative speed and distance with respect to Io of a negatively charged dust grain of radius 10 nm. The gray circle in that figure represents the parameter space (both velocity and distance to Io) consistent with our observations. The dynamical evolution of charged nanoparticles largely depends on the grain charge polarity: the positively charged particle is accelerated away from Jupiter in almost a straight trajectory, while the negatively charged one exhibits a cycloidal motion along Ios orbit similar to pickup ions. In general, negatively (positively) charged grains are accelerated toward (away from) Jupiter because of the outward-pointing corotating electric field (e.g., Horanyi et al. 1993). Within the first cycloid (within the first ∼15 minutes), when the grain is within ∼10 Io radii, both its direction and speed are comparable to the properties of the sodium jet. Grains of larger size (e.g., 100 nm), with a much smaller charge-to-mass ratio, are less accelerated by Lorentz forces compared to 10 nm radius dust grains. Therefore, their velocity relative to Io is much smaller than the observed one. Similarly, much smaller particles (size < 10 nm) have a much smaller gyroradius and tend to stay much closer to Io (a couple of Io radii at most) than our sodium feature. We shall return to this point in the next section.
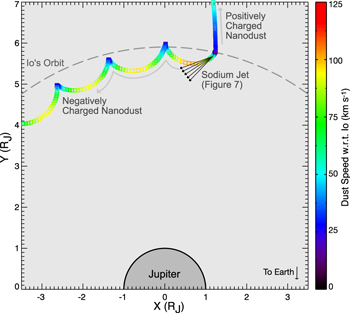
Figure 8. Top-down view of the trajectories of a negatively charged and a positively charged 10 nm radius dust grain. RJ = Jupiter radius ∼70,000 km.
Download figure:
Standard image High-resolution image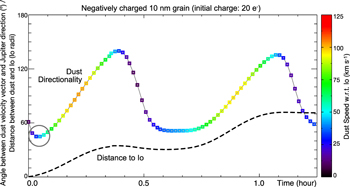
Figure 9. Simulation of trajectory of a negatively charged 10 nm radius dust grain (of 20 e− initial charge) moving under the influence the corotational electric field of Jupiter's magnetosphere. The line threading through the colored squares is the direction (angle), while the colored squares represent the velocity. The gray circle indicates the parameter space of the modeled neutral sodium atoms: speed range of 50–90 km s−1 (cyan to yellow colors) and direction of ∼45°. The negatively charged particles have the right velocity at the right time to match our observations. The dashed line is the distance from Io and is also referred to the y axis (in Io radii) and that is also consistent with our data (Figure 4). Tick marks on the x axis are 5 minutes.
Download figure:
Standard image High-resolution image
5. Discussion
Nanodust particles get charged at high altitude at Io by capture of ionospheric electrons or photoelectron production (Krüger et al. 2003b). Only the most energetic plumes are expected to bring grains to high altitudes so that they collect sufficient charge from ambient plasma to overcome Io's gravity (Johnson et al. 1980). Flandes (2004) showed that particles need to reach at least ∼400 km altitude to be able to escape, and the flight time from vent to this height is 15–20 minutes.
Once they get charged, these nanodust particles follow trajectories that are determined by the corotational electric field of Jupiter's magnetosphere. The dependence of dust trajectories on the highly variable magnetosphere implies a variability in the grains trajectories even if the dust ejection rate is constant. This variability, combined with the narrow field of view of our slit, might explain the variability seen in our data set within a couple of hours (Figure 4). Most previous Io nanodust detection were carried out at distances further away from Ios orbit. In this respect, our observations probe a much closer region to Io than all previous dust measurements.
The spatial information of the observed Na jets also provides constraints on the dynamics of its possible dusty source. The observed Na speeds correspond roughly to ∼50 km s−1, but grains in the dust model (10 nm in radius with 20 e− initial charge) need to be accelerated for some distance before reaching those speeds, at least 7 RIo as seen from Earth.
A dust grain with lower initial charge gets charged later, and thus farther away from Io than our observations. Only grains with proper charge-to-mass ratio can be sufficiently accelerated by the Lorentz forces and maintain a direction comparable to the observed sodium jet. To first order, regardless of the grain size, grains in the same plasma environment will be charged to roughly the same electrostatic potential determined by the ambient plasma conditions. For a given electrostatic potential, the grain charge-to-mass ratio is inversely proportional to the square of the grain size. Negatively charged grains much larger than 10 nm have lower charge-to-mass ratio and would not be accelerated to the observed speed in the vicinity of Io. Negatively charged grains much smaller than 10 nm, on the other hand, have much smaller gyroradius and will produce both red and blue shifted components in the vicinity of Io, which is also not consistent with the observation. The grain dynamics thus suggests that the sodium jet can only be produced by charged grains with radius ∼10 nm. This is in good agreement with previous grain size estimate of the Jovian stream particles based on space dust instruments onboard Galileo and Cassini spacecraft (Postberg et al. 2006; Hsu et al. 2012).
It is possible to perform a rough estimate of the source rate from the spectra and compare it to the source rate from the neutral model. The sodium source rate r is the product of the peak column abundance, the vertical extent d of the emission, and the velocity v⊥ perpendicular to the observer's line of sight (Schneider et al. 1991):

In the above formula, we used Io's diameter as vertical extent d of our feature; n is the column density per unit velocity averaged between 3.0 and 7.0 RIo; and the integral is performed between v1 = 7 and v2 = 22 km s−1 relative to Io, where the blueshifted feature is more prominent. Finally, the velocity perpendicular to the observer's line of sight is defined as  , where vlos
is the line-of-sight velocity (the one our spectroscopic observations are sensitive to) and θ is the angle between our line of sight and the jet (we assume our directional feature, or "jet," to be the axis of the cone of sodium atoms—see Figure 7). This angle is necessarily taken out of our modeling, since with spectroscopic observations we can only measure the radial (line-of-sight) velocity and have no information on the true orientation of the sodium feature. For each spectrum, we average the D2 and the D1 source rates and report these numbers in Table 2. The median of the resulting sodium source rates is 7.0 × 1025 Na s−1 from the data, corresponding to 2.7 kg s−1. The source rate from the neutral model is somehow greater (2.6 × 1026 Na s−1, corresponding to 10.0 kg s−1), but this was derived assuming a wide "jet" (30° in the vertical direction). A narrower feature would require proportionally less sodium.
, where vlos
is the line-of-sight velocity (the one our spectroscopic observations are sensitive to) and θ is the angle between our line of sight and the jet (we assume our directional feature, or "jet," to be the axis of the cone of sodium atoms—see Figure 7). This angle is necessarily taken out of our modeling, since with spectroscopic observations we can only measure the radial (line-of-sight) velocity and have no information on the true orientation of the sodium feature. For each spectrum, we average the D2 and the D1 source rates and report these numbers in Table 2. The median of the resulting sodium source rates is 7.0 × 1025 Na s−1 from the data, corresponding to 2.7 kg s−1. The source rate from the neutral model is somehow greater (2.6 × 1026 Na s−1, corresponding to 10.0 kg s−1), but this was derived assuming a wide "jet" (30° in the vertical direction). A narrower feature would require proportionally less sodium.
Table 2. Sodium Source Rate for the Emission Feature Discussed in this Paper
| Filename | Data Source Rate (s−1) | Model Source Rate (s−1) |
|---|---|---|
| JDEI0119 | 7.0 × 1025 | 1.6 × 1026 |
| JDEI0120 | 1.1 × 1026 | 2.6 × 1026 |
| JDWF0002 | 1.4 × 1025 | 5.8 × 1025 |
| JDWF0004 | 2.8 × 1025 | 9.2 × 1025 |
| JDWF0008 | 4.6 × 1025 | 1.4 × 1026 |
| JDWF0010 | 7.0 × 1025 | 2.1 × 1026 |
| JDWF0015 | 2.3 × 1026 | 2.9 × 1026 |
| JDWF0017 | 1.7 × 1026 | 2.7 × 1026 |
| JDWF0022 | 9.8 × 1025 | 2.8 × 1026 |
| JDWF0024 | 7.7 × 1025 | 3.0 × 1026 |
| JDWF0025 | 6.9 × 1025 | 2.2 × 1026 |
Note. The data source rate is the average of the source rates from the D2 and D1 emission lines). Model source rates for some of the 2007 April observations are not available because the emission feature was not well defined.
Download table as: ASCIITypeset image
5.1. Sputtering of Na from Nanodust Grains
For the dust hypothesis to work, we need a mechanism that releases sodium atoms from these nanodust grains. Possible processes include photon-stimulated desorption (PSD), electron-stimulated desorption, or ion sputtering. The first two have too low a source rate. From experiments of PSD of Na from surfaces that simulate the lunar silicates (Yakshinskiy & Madey 1999), scaling the solar flux to Jupiter's distance, and taking into account our derived distribution of dust grains, the source rate from PSD is 109 s−1. The same authors also showed that electron-stimulated desorption has an only slightly higher cross section compared to PSD. The other mechanism, ion sputtering, gives higher source rates, although there are several uncertainties that affect the calculation of the rate. First, an absolute value for sputtering yield of sodium atoms has only been measured on Na2S: Chrisey et al. (1988) report a sputtering yield of 0.1 and 0.2 Na2S ion−1 from O+ and S+ ions, respectively. The molecules of interest in our case are sodium chloride (NaCl) and sodium sulfate (Na2SO4), given that these were the compositions of the Na-bearing dust grains detected by Cassini CDA (Postberg et al. 2006). Sodium sputtering yield for NaCl has been estimated by Johnson (2000) to be ∼1.0 Na ion−1, assuming that NaCl has the same atomic ejection efficiency as Na2S. Sodium sputtering yield for Na2SO4 has only been reported as a relative value: it is 100–1000 times greater than the sputtering yield for NaS (Wiens et al. 1997). Assuming the absolute sputtering yield of NaS to be the same as that of Na2S, we can estimate the Na sputtering yield from Na2SO4 to be 100–1000 times greater than that of NaCl, or 100–1000 Na ion−1. The flux Φ of precipitating ions responsible for the sputtering (mostly S+ and O+) can be calculated by multiplying the velocity of the ions (co-rotation, or 57 km s−1) by the density of these heavy ions close to Io, or about 1500 cm−3 (Dougherty et al. 2017). We obtain Φ = 8.6 × 10⁹ Na cm−2 s−1.
The second uncertainty is the dust available for sputtering. Over the course of the 7 yr mission and from a distance between 13 and 400 RJ from Io, the Galileo Dust Detector System measured dust production rates at Io between 10−3 and 102 kg s−1 (with an average value between 0.1 and 1.0 kg s−1), possibly correlated to volcanic eruptions at Io (Figure 2 of Krüger et al. 2003a).
With these numbers, we can estimate the number of Na atoms sputtered by nanodust grains and compare it to our observed sodium production rate. We start by assuming a dust production rate of 1 kg s−1, the upper value of the average range reported by Krüger et al. (2003a). Assuming a spherical shape and a density of 1.5 g cm−3 (Krüger et al. 2003a), this corresponds to 1.6 × 10²⁰ grains s−1 of radius 10 nm. We now multiply this number by the time it takes for the dust grains to reach the point where we do see sodium emission, or 0.05 hr (from Figure 9), to get Ngrains = 2.9 × 10²². The total area available for sputtering will be Ngrains · A · c, where A is the area of a 10 nm radius spherical nanodust grain, and c the concentration of either NaCl (90%) or Na2SO44 (10%), from Cassini CDA measurements (Postberg et al. 2006). These areas are 3.2 × 1011 cm2 and 3.6 × 1010 cm2 for NaCl and Na2SO4, respectively. Multiplying them by the corresponding sputtering yields Y and the heavy ion flux, we get the sodium production rate for sputtering s:

We obtain 2.8 × 10²¹ Na s−1 from NaCl, and 3.1 × 10²² Na s−1 from Na2SO4 from 1 kg s−1 of dust material.
These numbers are between 3 and 4 orders of magnitude lower than our inferred rate of 7.0 × 1025 s−1 (from the observations). They can be reconciled with our values if we assume some combination of the highest estimate for dust production rate from Galileo (100 kg s−1), the highest estimate for the sputtering yield of Na from Na2SO4 (1000 Na ion−1), and a surface area for porous particles that is ∼10 times higher than the spherical area (this is the case for micron-sized lunar regolith particles; Taylor & Meek 2004). Additionally, the dust production rates from Galileo should be considered a lower limit, as dust is likely to undergo other destruction processes (not included in the calculations of Krüger et al. 2003a) between Io and the distance at which grains were detected by Galileo (between 13 and 400 RJ from Io). This is particularly true if some ejected dust has a more volatile composition than NaCl. Finally, it is not clear how the ion sputtering experiments, performed on flat surfaces, would change for dust composed of fluffy grains. To further investigate the discrepancy, a detailed calculation of the release of Na from dust particles and full treatment of dust destruction in Jupiter's highly complicated plasma environment would be required, and these are outside the scope of this paper.
We note that the new sodium feature was most prominent when Io was within 5° of the magnetic equator (Table 1). The bulk of the Io plasma torus is confined in the centrifugal equator, which is very close to the magnetic one. The plasma environment of that region (high plasma-electron density and low electron temperature; Meyer-Vernet et al. 1995) is consistent with the negative grain charge polarity inferred from the trajectory simulation. In addition, the sputtering erosion responsible to release sodium atoms from dust surfaces is also higher at low magnetic latitudes because of the higher ion density. Our results thus indicate an indirect pathway to deliver sodium atoms, and likely other species, from Io to the neutral clouds (and ultimately to the magnetosphere) by sputtering from dust surfaces.
We conclude this section by evaluating and discarding another possible candidate, mentioned in Section 4.2, that is a population of negative ions formed inside Io's plumes. In this case, the most likely process to create these ions is three-body electron attachment. The most likely species to undergo this process is NaSO4, a radical species with a substantial electron affinity and the highest-rate coefficient among several Na-bearing species. The negative ions would then release the neutral sodium atoms we observe following electron detachment. The concentration of NaSO4 inside Io's plumes is unknown, but to match our observed source rate per unit volume, a density similar to that of potassium would be required, or 9 orders of magnitude greater than the the expected concentration of Na2SO4 inside Io's plumes (Moses et al. 2002). For this reason, we favor the hypothesis of ion sputtering from negatively charged dust nanograins as the most plausible source of our new sodium emission feature.
6. Conclusions
We have performed a Monte Carlo simulation of sodium atoms under the influence of Io's gravity and solar radiation pressure to explain an unusual Jupiter-oriented feature (Schneider et al. 2008) we detected in our high-resolution spectra of Io's sodium Neutral Clouds from the TNG telescope. This feature is directed toward Jupiter and is rapidly variable in time. The best model is the one that has the sodium atoms ejected in the leading-sub/Jovian hemisphere of Io (45°–68° west longitude) with a broad velocity distribution (50–90 km s−1). We propose that the mechanism most likely responsible for creating sodium atoms with that orientation and that speed is sputtering of Na from Na-bearing molecules (NaCl or Na2SO4, both detected near Jupiter by Cassini CDA) attached to negatively charged dust grains (10 nm in radius) that move under the influence of the corotational electric field of Jupiter's magnetosphere. This is consistent with modeling of trajectories of negatively charged nanodust grains, which present the right velocity and orientation consistent with our observations and our sodium model. The median sodium source rate inferred from our observations is 7.0 × 1025 Na s−1, to be compared with the theoretical estimate from ion sputtering of Na from NaCl or Na2SO4 between 5.5 × 10²¹ Na s−1 and 6.2 × 1026 Na s−1, depending on the choice of several uncertain parameters, such as the sputtering yield, the dust production rate at Io, and surface area available to sputtering. We point out the need for detailed calculations of the release of Na from dust particles and full treatment of dust destruction in Jupiter's highly complicated plasma environment.
Our results uncover a new mechanism by which Io's sodium Neutral Clouds are replenished, and highlight the need for future observing campaigns to better constrain the escape rate of sodium atoms produced at Io by this mechanism; before the arrival of Europa Clipper spacecraft, whose dust counter will be able to study the dust population in the Jupiter environment at much closer range than any other spacecraft so far.
This work has been supported by NASA Solar System Workings grant 80NSSC18K0008, NSF's Planetary Astronomy Program, and the Astronomy Department and CISAS of University of Padua, through a contract by the Italian Space Agency (ASI). C.G. wishes to thank Rosemary M. Killen for providing the g-values used in this work, and Jane L. Fox and John M. C. Plane for insightful discussions on negative ions chemistry. Based on observations made with the Italian Telescopio Nazionale Galileo (TNG) operated by the Fundación Galileo Galilei of the Istituto Nazionale di Astrofisica at the Observatorio del Roque de los Muchachos (La Palma, Canary Islands, Spain). Files for observations in 2009 are available on the archive of the TNG telescope, at http://archives.ia2.inaf.it/tng. Files for observations in 2007 can be requested to the corresponding author.