


Abstract
Blazars represent about 62% of the sources in the γ-ray Fermi-LAT catalog, and about 80% of the γ-ray sources associated with a lower-energy counterpart, dominating the γ-ray sky. In particular, about 42% of the γ-ray blazars are classified as Blazars Candidates of Uncertain type (BCUs) for which spectroscopic observations are mandatory to confirm their blazar nature. Here we report the spectra of 64 targets observed as part of our follow-up optical spectroscopic campaign. This sample includes 62 sources classified in Fermi-LAT catalog as BCUs, one source classified as a generic active galactic nucleus, and one source classified as a BL Lac in Fermi-LAT and as blazar of uncertain type in the Roma-BZCAT catalog. We confirm the blazar nature of all BCUs. We classify 33 of them as BL Lacs, 11 as Flat Spectrum Radio Quasars, and 18 as blazars with nonnegligible host-galaxy emission. We also classify the generic active galactic nucleus as a BL Lac. Finally, we confirm the classification of the BL Lac. We also reported a lower limit redshift for 43 sources. For 20 sources, we got redshift measurements consistent with the literature values. For the other 21 sources, we obtained their first spectroscopic redshift measurement; while, for two sources, we provide lower limits on the redshift. With the upcoming release of the sixth edition of the Roma-BZCAT Multifrequency Catalog of Blazars, we take the opportunity in the present work to present the collective results of the first phase of our optical spectroscopic follow-up campaign.
Export citation and abstract BibTeX RIS
1. Introduction
Blazars are one of the most peculiar and among the rarest class (Abdo et al. 2010) of active galactic nuclei (AGNs) whose emission, extending over the whole electromagnetic spectrum, is dominated by radiation from relativistic particles accelerated in jets closely aligned to the line of sight (Blandford & Rees 1978; Urry & Padovani 1995). Blazars are subdivided in two main subclasses, distinguished on the basis of their optical spectra: BL Lac objects and Flat Spectrum Radio Quasars (FSRQs). The former subclass presents weak emission lines in their optical spectra with equivalent widths (EW) smaller than 5 Å (Stickel et al. 1991), while FSRQs show quasar-like optical spectra with broad emission lines. Blazars represent about 62% of the sources in the Fermi Large Area Telescope Fourth Source Catalog (4FGL; Abdollahi et al. 2020), the most recent release of the Fermi mission γ-ray source catalog. In addition, blazars represent about 80% of the γ-ray sources associated to a lower-energy counterpart, hence dominating the γ-ray sky. About 42% of the γ-ray blazars in 4FGL, and about 26% of the whole catalog are blazar candidates of uncertain type (BCUs; Ackermann et al. 2015), lacking optical spectroscopic information necessary for their classification. On the other hand, ∼23% of the sources in the 4FGL are currently unidentified/unassociated, meaning that they lack a firm association with a lower-energy counterpart. In order to identify and classify blazars and blazar candidates, optical spectroscopy remains the decisive tool that provides a precise classification of γ-ray source counterparts.
With the goal of identifying and classifying new blazars, in 2013, we started our optical spectroscopic campaign through observations performed with different ground-based facilities—Multiple Mirror Telescope (MMT), Loiano Cassini Telescope, Mayall 4 m Telescope at Kitt Peak National Observatory (KPNO), Southern Astrophysical Research (SOAR) Telescope, Magellan Telescopes at Las Campanas Observatory, Palomar Observatory, Telescopio Nazionale Galileo (TNG), William Herschel Telescope (WHT), National Astronomical Observatory San Pedro Mártir (OAN-SPM), Nordic Optical Telescope (NOT), Guillermo Haro Astrophysics Observatory (OAGH), Blanco Telescope at Cerro Tololo Inter-American Observatory (CTIO) - as well as exploiting archival data from optical spectroscopic surveys—Sloan Digital Sky Survey (SDSS; Aguado et al. 2019), 6dF Galaxy Survey (6dFGS; Jones et al. 2009), and the Large Sky Area Multi-Object Fiber Spectroscopic Telescope (LAMOST; Cui et al. 2012) Extragalactic Survey. The main goal of our optical spectroscopic campaign is to identify blazars among unidentified/unassociated γ-ray sources and BCUs, since they constitute the largest known population of gamma-ray emitters (Abdollahi et al. 2020).
This resulted in a series of published works (Massaro et al. 2014, 2015b, 2016; Paggi et al. 2014; Landoni et al. 2015; Ricci et al. 2015; Álvárez Crespo et al. 2016a, 2016b, 2016c; Peña-Herazo et al. 2017, 2019, 2020, 2021; Marchesini et al. 2019; de Menezes et al. 2020) in which we report analysis of spectroscopic data for 371 blazars and blazar candidates, leading to classification, reclassification, and redshift estimates for these sources. Our spectroscopic identifications were used by other groups to: (i) build the luminosity function of BL Lacs (Ajello et al. 2014); (ii) select potential targets for the Cerenkov Telescope Array (Massaro et al. 2013a; Arsioli et al. 2015); (iii) obtain stringent limits on the dark matter annihilation in subhalos (e.g., Zechlin & Horns 2012; Berlin & Hooper 2014); (iv) search for counterparts of new flaring γ-ray sources (Bernieri et al. 2013); (v) test new γ-ray detection algorithms (Campana et al. 2015, 2016); (vi) perform population studies on unassociated γ-ray sources (e.g., Acero et al. 2013); and (vii) discover the new subclass of radio weak BL Lacs (e.g., Massaro et al. 2017).
With the upcoming release of the sixth edition of the Roma-BZCAT Multifrequency Catalog of Blazars (Roma-BZCAT; Massaro et al. 2015a)—the most comprehensive list of blazars confirmed by means of published spectra—we conclude with the present work the first phase of our spectroscopic campaign, with the analysis of additional 64 sources. All the information about the new blazars, the newly classified sources, and the new redshift estimates collected during the optical spectroscopic campaign will be included in the sixth edition of the Roma-BZCAT.
The present paper is organized as follows. In Section 2 we present the sample of sources analyzed in this work, in Section 3 we outline the details of the observations and data reduction procedures, in Section 4 we present our results, and in Section 5 we summarize our conclusions together with a recap of the results of the first phase of our optical spectroscopic campaign.
2. Sample Description
The sample of the present analysis comprises 57 sources from the 4FGL. In particular, 55 sources are listed in the 4FGL as BCUs. In addition we have one source (namely 4FGL J1012.7+4228) listed in the 4FGL as AGN, that is, an AGN of unknown type; and one (namely 4FGL J0538.2–3910) listed as BLL, that is, a BL Lac type object, without a redshift estimate. In addition, we include in our sample seven sources that were listed in the first release of 4FGL as BCUs, but that are not in the present 2.2 release of the catalog. The observing logbook of the total 64 sources analyzed in this work are presented in Table 1.
Table 1. Logbook of the Spectroscopic Observations of Our Sample
| Name Fermi | Class | Association | Name WISE | R.A. | Decl. | Telescope | Date |
|---|---|---|---|---|---|---|---|
| Fermi | |||||||
| 4FGL J0030.6–0212 | BCU | PKS B0027–024 | J003031.82–021156.1 | 00:30:31.83 | −02:11:56.1 | NTT | 2019 Nov 24 |
| 4FGL J0039.1–2219 | BCU | PMN J0039–2220 | J003908.21–222001.4 | 00:39:08.21 | −22:20:01.4 | Blanco | 2020 Dec 19 |
| 4FGL J0049.4–5402 | BCU | PMN J0049–5402 | J004948.86–540243.5 | 00:49:48.87 | −54:02:43.6 | NTT | 2019 Nov 26 |
| 4FGL J0056.6–4452 | BCU | PKS 0054–451 | J005645.85–445102.0 | 00:56:45.85 | −44:51:02.1 | SOAR | 2019 Sep 24 |
| 4FGL J0101.7–5455 | BCU | MRSS 151–121576 | J010142.01–545547.4 | 01:01:42.02 | −54:55:47.4 | Blanco | 2020 Dec 17 |
| 4FGL J0107.3–1210 | BCU | PMN J0107–1211 | J010711.78–121123.3 | 01:07:11.78 | −12:11:23.3 | NTT | 2019 Nov 26 |
| 4FGL J0132.7–0804 | BCU | PKS 0130–083 | J013241.13–080404.9 | 01:32:41.13 | −08:04:04.9 | Blanco | 2020 Dec 15 |
| 4FGL J0138.5–4613 | BCU | PMN J0138–4614 | J013833.91–461416.9 | 01:38:33.92 | −46:14:16.9 | Blanco | 2020 Dec 14 |
| 4FGL J0143.5–3156 | BCU | PKS 0140–322 | J014310.12–320056.5 | 01:43:10.13 | −32:00:56.6 | SOAR | 2019 Dec 20 |
| 4FGL J0146.0–6746 | BCU | SUMSS J014554–674646 | J014554.85–674648.7 | 01:45:54.85 | −67:46:48.8 | SOAR | 2019 Nov 30 |
| 4FGL J0154.3–0236 | BCU | TXS 0151–028 | J015422.79–023453.7 | 01:54:22.80 | −02:34:53.7 | Blanco | 2020 Dec 12 |
| 4FGL J0207.4–3855 | BCU | PKS 0205–391 | J020715.60–385703.2 | 02:07:15.60 | −38:57:03.3 | NTT | 2019 Nov 26 |
| 4FGL J0212.2–0219 | BCU | RX J0212.3–0222 | J021216.88–022155.7 | 02:12:16.88 | −02:21:55.8 | Blanco | 2020 Dec 19 |
| 4FGL J0232.5–1118 | BCU | PMN J0232–1120 | J023241.91–112020.2 | 02:32:41.91 | −11:20:20.2 | Blanco | 2020 Dec 20 |
| 4FGL J0301.4–3124 | BCU | PKS 0259–316 | J030116.23–312615.8 | 03:01:16.24 | −31:26:15.9 | NTT | 2019 Nov 26 |
| 4FGL J0307.8–0419 | BCU | LEDA 095522 | J030744.52–041909.1 | 03:07:44.52 | −04:19:09.2 | Blanco | 2020 Dec 14 |
| 4FGL J0309.4–4000 | BCU | PKS 0307–402 | J030913.01–400150.8 | 03:09:13.01 | −40:01:50.8 | Blanco | 2020 Dec 15 |
| 4FGL J0317.8–4414 | BCU | PKS 0316–444 | J031757.67–441417.0 | 03:17:57.67 | −44:14:17.1 | Blanco | 2020 Dec 15 |
| 4FGL J0338.7–5706 | BCU | 1RXS J033832.0–570449 | J033832.03–570448.8 | 03:38:32.03 | −57:04:48.8 | Blanco | 2020 Dec 19 |
| 4FGL J0355.1–1841 | BCU | NVSS J035513–184309 | J035513.28–184308.5 | 03:55:13.29 | −18:43:08.6 | Blanco | 2020 Dec 21 |
| 4FGL J0357.6–4625 | BCU | PKS 0355–465 | J035728.71–462543.1 | 03:57:28.71 | −46:25:43.2 | Blanco | 2020 Dec 16 |
| 4FGL J0406.0–5407 | BCU | SUMSS J040608–540445 | J040608.66–540449.8 | 04:06:08.66 | −54:04:49.9 | NTT | 2019 Nov26 |
| 4FGL J0414.8–5338 | BCU | RBS 0526 | J041458.11–533943.7 | 04:14:58.11 | −53:39:43.8 | Blanco | 2020 Dec 18 |
| 4FGL J0416.0–6628 | BCU | PMN J0416–6629 | J041604.89–662858.5 | 04:16:04.89 | −66:28:58.5 | Blanco | 2020 Dec 16 |
| 4FGL J0429.9–3101 | BCU | MRSS 421–156568 | J042958.93–305935.2 | 04:29:58.94 | −30:59:35.2 | Blanco | 2020 Dec 12 |
| 4FGL J0433.7–5725 | BCU | SUMSS J043344–572613 | J043344.13–572613.2 | 04:33:44.13 | −57:26:13.3 | Blanco | 2020 Dec 18 |
| 4FGL J0435.4–2623 | BCU | 1RXS J043518.7–262120 | J043517.77–262122.3 | 04:35:17.77 | −26:21:22.4 | Blanco | 2020 Dec 12 |
| 4FGL J0437.4–6155 | BCU | SUMSS J043719–615654 | ⋯ | 04:37:19.79 | −61:56:54.9 | Blanco | 2020 Dec 20 |
| 4FGL J0443.3–6652 | BCU | PMN J0443–6651 | J044318.24–665204.4 | 04:43:18.24 | −66:52:04.5 | NTT | 2019 Nov 24 |
| 4FGL J0506.0–0357c | BCU | NVSS J050605–040152 | J050605.98–040152.4 | 05:06:05.98 | −04:01:52.4 | NTT | 2019 Nov 26 |
| 4FGL J0509.9–6417 | BCU | 1RXS J050957.9–641741 | ⋯ | 05:09:57.90 | −64:17:41.0 | Blanco | 2020 Dec 21 |
| 4FGL J0525.6–2008 | BCU | NVSS J052527–201048 | ⋯ | 05:25:27.78 | −20:10:48.7 | Blanco | 2020 Dec 17 |
| 4FGL J0526.7–1519 | BCU | NVSS J052645–151900 | J052645.44–151900.5 | 05:26:45.44 | −15:19:00.6 | NTT | 2019 Nov 24 |
| 4FGL J0538.2–3910 | BLL | NVSS J053810–390844 | J053810.36–390842.5 | 05:38:10.36 | −39:08:42.5 | NTT | 2019 Nov 24 |
| 4FGL J0620.7+2643 | BCU | RX J0620.6+2644 | J062040.05+264331.9 | 06:20:40.06 | +26:43:31.9 | OAN | 2020 Feb 27 |
| 4FGL J0647.0–5138 | BCU | 1ES 0646–515 | J064710.04–513547.7 | 06:47:10.04 | −51:35:47.8 | SOAR | 2019 Nov 20 |
| 4FGL J0651.0+4013 | BCU | RX J0651.0+4013 | J065105.41+401338.1 | 06:51:05.42 | +40:13:38.1 | OAN | 2020 Feb 26 |
| 4FGL J0652.1–4813 | BCU | 1RXS J065201.0–480858 | J065200.57-480859.3 | 06:52:00.58 | −48:08:59.3 | SOAR | 2021 Jan 16 |
| 4FGL J0654.0–4152 | BCU | LEDA 571171 | J065359.90–415144.9 | 06:53:59.90 | −41:51:45.0 | Blanco | 2020 Dec 13 |
| 4FGL J0703.3–0050 | BCU | TXS 0700–007 | J070319.08–005103.1 | 07:03:19.09 | −00:51:03.1 | Blanco | 2020 Dec 16 |
| 4FGL J0709.2–1527 | BCU | PKS 0706–15 | J070912.51–152703.5 | 07:09:12.52 | −15:27:03.6 | Blanco | 2020 Dec 16 |
| 4FGL J0719.1–7055 | BCU | 1RXS J071910.3–705411 | J071908.60–705403.4 | 07:19:08.61 | −70:54:03.5 | Blanco | 2020 Dec 20 |
| 4FGL J0731.2–1403 | BCU | PMN J0731–1402 | J073112.98–140207.0 | 07:31:12.99 | −14:02:07.0 | NTT | 2019 Nov 26 |
| 4FGL J0744.2–6918 | BCU | PKS 0744–691 | J074420.39–691907.1 | 07:44:20.40 | −69:19:07.2 | SOAR | 2021 Mar 14 |
| 4FGL J0749.4+1058 | BCU | TXS 0746+110 | J074927.38+105733.1 | 07:49:27.39 | +10:57:33.2 | Blanco | 2020 Dec 21 |
| 4FGL J0830.0+5231 | BCU | RX J0830.1+5230 | J083010.91+523027.1 | 08:30:10.92 | +52:30:27.2 | OAN | 2020 Feb 26 |
| 4FGL J0847.0–2336 | BCU | PMN J0847–2337 | J084701.57–233701.7 | 08:47:01.58 | −23:37:01.7 | Blanco | 2020 Dec 17 |
| 4FGL J0929.3–2414 | BCU | NVSS J092928–241632 | J092928.23-241632.9 | 09:29:28.23 | −24:16:32.9 | Blanco | 2020 Dec 21 |
| 4FGL J0953.4–7659 | BCU | RX J0953.1–7657 | J095304.35–765802.0 | 09:53:04.35 | −76:58:02.1 | SOAR | 2021 Mar 14 |
| 4FGL J0959.6+4606 | BCU | 2MASX J09591976+4603515 | J095919.80+460351.9 | 09:59:19.81 | +46:03:51.9 | OAN | 2020 Feb 25 |
| 4FGL J1008.0+0028 | BCU | PKS 1005+007 | J100811.44+002959.9 | 10:08:11.44 | +00:30:00.0 | Blanco | 2020 Dec 20 |
| 4FGL J1012.7+4228 | AGN | B3 1009+427 | J101244.28+422956.9 | 10:12:44.28 | +42:29:56.9 | OAN | 2020 Feb 26 |
| 4FGL J1020.7–3920 | BCU | 2MASS J10203893–3920563 | J102038.95–392056.2 | 10:20:38.95 | −39:20:56.2 | SOAR | 2021 Mar 24 |
| 4FGL J1052.3+0818 | BCU | 2MASX J10522451+0814095 | J105224.53+081409.5 | 10:52:24.53 | +08:14:09.6 | OAN | 2020 Feb 27 |
| 4FGL J2211.2–1325 | BCU | PKS 2208–137 | J221124.09–132809.7 | 22:11:24.09 | −13:28:09.7 | SOAR | 2019 Oct 6 |
| 4FGL J2230.9–7815 | BCU | PKS 2225–785 | J223030.53–781556.4 | 22:30:30.53 | −78:15:56.5 | SOAR | 2019 Sep 23 |
| 4FGL J2246.7–5207 | BCU | RBS 1895 | J224642.10–520640.4 | 22:46:42.10 | −52:06:40.4 | SOAR | 2019 Dec 16 |
| Not present in the 4FGL 2.2 release | |||||||
| 4FGL J0041.9–4702 | BCU | RBS 0097 | J004147.02–470136.9 | 00:41:47.02 | −47:01:37.0 | Blanco | 2020 Dec 13 |
| 4FGL J0056.5–3936 | BCU | NVSS J005620–394144 | J005620.10–394144.3 | 00:56:20.11 | −39:41:44.4 | Blanco | 2020 Dec 17 |
| 4FGL J0214.1–4733 | BCU | 2MASS J02140989–4732357 | J021409.84–473235.2 | 02:14:09.84 | −47:32:35.2 | Blanco | 2020 Dec 18 |
| 4FGL J0331.8–7040 | BCU | SUMSS J033202–703952 | J033202.35–703948.9 | 03:32:02.35 | −70:39:48.9 | Blanco | 2020 Dec 21 |
| 4FGL J0516.8–0509 | BCU | PMN J0517–0520 | J051728.10–052041.0 | 05:17:28.11 | −05:20:41.0 | SOAR | 2021 Feb 22 |
| 4FGL J0527.3–6223 | BCU | PMN J0527–6225 | J052745.43–622516.7 | 05:27:45.43 | −62:25:16.7 | Blanco | 2020 Dec 14 |
| 4FGL J0648.4–6941 | BCU | 1RXS J064850.3–694519 | J064850.50–694522.5 | 06:48:50.50 | −69:45:22.6 | Blanco | 2020 Dec 17 |
Note. The last seven sources of the table are those present in the first release of the 4FGL, but removed in the last 2.2 release.
It is worth noting that six sources in our sample are also listed in the 5th edition of the Roma-BZCAT. In particular, the AGN source 4FGL J1012.7+4228 is listed in BZCAT as a BZB (that is, a BL Lac type object), the BLL source 4FGL J0538.2–3910 is listed in the BZCAT as BZU (that is, a blazar of uncertain type), one BCU—namely 4FGL J0516.8-0509—is listed in the BZCAT as BZQ (that is, a FSRQ), and the other three BCUs are listed in the BZCAT as BZUs. Finally, we note that only 23 of the 64 sources in our sample have a previous spectroscopic redshift estimate, in particular the AGN source and 22 BCUs.
3. Methods and Data Reduction Procedures
We adopted the same classification criteria of the Roma-BZCAT, using the same naming convention; that is, BZBs for BL Lac objects, and BZQs for FSRQs. BZBs have almost featureless optical spectra with only weak absorption or emission lines (Stickel et al. 1991; Stocke et al. 1991). We then classify BZBs as sources showing featureless spectra or with emission lines of EW < 5 Å. BZQs, on the other hand, showing typical quasar-like optical spectra, with broad emission lines, and we then classify as BZQs sources showing spectra with emission lines with EW > 5 Å. BZGs are those blazars having a nonnegligible host-galaxy emission in both their optical spectra and in their broadband SED (Massaro et al.2012), similar to elliptical galaxies in the optical band (Massaro et al. 2012, 2015c; Shaw et al. 2012).
Sources were observed in visiting mode at the Victor Blanco 4 m telescope in Cerro Tololo, Chile. We made use of the COSMOS spectrograph red grism (r2k), center slit with 1 2 width, and the OG530 filter. This setup gave a spectral range of 5515–9635 Å and a dispersion of 1 Å/pixel. We acquired Hg–Ne comparison lamp spectra on each target position for the wavelength calibration.
Six sources were observed with the 2.1 m telescope of the OAN in San Pedro Mártir, Mexico. The telescope carries a Boller and Chivens spectrograph with a 1024 × 1024 pixels E2V 4240 CCD, tuned to the 4000–8000 Å range, a dispersion of 2.26 Å/pix, and a slit width of 25. This configuration gives a resolution of 10 Å. Wavelength calibration was done using CuHe-NeAr and He-Ar comparison lamps.
Twelve sources were observed with the 4.1 m SOAR telescope at Cerro Pachón, Chile. We used the single, long-slit mode of the Goodman High Through-put Spectrograph (Clemens et al. 2004) with a slit width of 1'' and a grating of 400 l mm−1, giving a dispersion of ∼3 Å pixel−1 in a spectral range from ∼4100 Å up to 7900 Å, and resolution of ∼6 Å. We used HgAr lamps to perform wavelength calibration.
The last 11 were observed at NTT. We performed long-slit spectroscopic observations using the EFOSC2 spectrograph with grism No. 13. The instrument configuration gave a spectral range of 3700–9000 Å and a dispersion of 2.77 Å/pix with a slit width of 1''. After each target, we observed HeAr comparison lamps to perform the wavelength calibration.
We reduced the data using IRAF standard reduction packages (Tody 1986). For each acquisition, we carried out bias subtraction, flat-field correction, and cosmic-ray removal. We collected two or three individual exposures per target and summed or combined using the median. To remove cosmic rays we used the L.A. Cosmic IRAF algorithm (van Dokkum 2001). We performed relative flux calibration with spectrophotometric standard stars observed each night. We corrected all spectra for galactic extinction making use of extinction maps of Schlafly & Finkbeiner (2011), reddening law of Cardelli et al. (1989), and values of EB−V of Schlegel et al. (1998). Additionally, we normalized the spectra to a fitted polynomial of 10th degree to make evident detected spectral features. Finally, we performed a smoothing by Gaussian convolution of the spectra for visual presentation. The spectra are presented in the Appendix along with the sources finding charts.
For measuring the redshift, we identified by visual inspection quasar emission lines as Balmer lines or C iv, C iii], Mg ii, [O i], [O ii], [O iii], [N ii], and [S ii]. We also look for host-galaxy absorption lines as Ca ii H&K, G band, Mg i, Mg ii, or Balmer lines. Then we fitted a Gaussian profile near the line's peak to avoid shifted spectral components. We performed the line fitting using IRAF (Tody 1986).
4. Results
We were able to classify all the 64 sources in our sample based on their optical spectra. We present the results in Table 2. In particular, we classify the AGN source (4FGL J1012.7+4228) as a BZB, confirming the BZCAT classification. For the BLL source (4FGL J0538.2–3910), listed in BZCAT as a BZU, we provide the new classification of BZB, due to its featureless spectrum. Regarding the 62 BCUs, we classify 33 of them as BZBs, 18 as BZGs, and 11 as BZQs (see Table 2).
Table 2. Main Results of the Optical Spectroscopic Observations for the Sources Analyzed in the Present Work
| Name Fermi | Class Fermi | Name WISE | Old Redshift | New Class | New Redshift |
|---|---|---|---|---|---|
| 4FGL J0030.6–0212 | BCU | J003031.82–021156.1 | 1.8037 | BZQ | 1.804 |
| 4FGL J0039.1–2219 | BCU | J003908.21–222001.4 | 0.0644 | BZG | 0.065 |
| 4FGL J0049.4–5402 | BCU | J004948.86–540243.5 | ⋯ | BZB | ⋯ |
| 4FGL J0056.6–4452 | BCU | J005645.85–445102.0 | ⋯ | BZB | ⋯ |
| 4FGL J0101.7–5455 | BCU | J010142.01–545547.4 | ⋯ | BZG | 0.261 |
| 4FGL J0107.3–1210 | BCU | J010711.78–121123.3 | ⋯ | BZB | ⋯ |
| 4FGL J0132.7–0804 | BCU | J013241.13–080404.9 | 0.1485 | BZQ | 0.149 |
| 4FGL J0138.5–4613 | BCU | J013833.91–461416.9 | ⋯ | BZG | 0.090 |
| 4FGL J0143.5–3156 | BCU | J014310.12–320056.5 | 0.3751 | BZQ | 0.372 |
| 4FGL J0146.0–6746 | BCU | J014554.85–674648.7 | ⋯ | BZB | ⋯ |
| 4FGL J0154.3–0236 | BCU | J015422.79–023453.7 | 0.0823 | BZQ | 0.083 |
| 4FGL J0207.4–3855 | BCU | J020715.60–385703.2 | 0.2540 | BZB | ⋯ |
| 4FGL J0212.2–0219 | BCU | J021216.88–022155.7 | ⋯ | BZB | 0.169 |
| 4FGL J0232.5–1118 | BCU | J023241.91–112020.2 | 0.2087 | BZG | 0.209 |
| 4FGL J0301.4–3124 | BCU | J030116.23–312615.8 | ⋯ | BZQ | 0.313 |
| 4FGL J0307.8–0419 | BCU | J030744.52–041909.1 | 0.0289 | BZQ | 0.029 |
| 4FGL J0309.4–4000 | BCU | J030913.01–400150.8 | ⋯ | BZB | 0.193 |
| 4FGL J0317.8–4414 | BCU | J031757.67–441417.0 | 0.0761 | BZQ | 0.076 |
| 4FGL J0338.7–5706 | BCU | J033832.03–570448.8 | ⋯ | BZB | ⋯ |
| 4FGL J0355.1–1841 | BCU | J035513.28–184308.5 | ⋯ | BZB | ⋯ |
| 4FGL J0357.6–4625 | BCU | J035728.71–462543.1 | 0.1000 | BZB | 0.100 |
| 4FGL J0406.0–5407 | BCU | J040608.66–540449.8 | ⋯ | BZB | ⋯ |
| 4FGL J0414.8–5338 | BCU | J041458.11–533943.7 | ⋯ | BZB | ⋯ |
| 4FGL J0416.0–6628 | BCU | J041604.89–662858.5 | ⋯ | BZB | 0.385 |
| 4FGL J0429.9–3101 | BCU | J042958.93–305935.2 | ⋯ | BZG | 0.218 |
| 4FGL J0433.7–5725 | BCU | J043344.13–572613.2 | ⋯ | BZB | > 1.273 |
| 4FGL J0435.4–2623 | BCU | J043517.77–262122.3 | ⋯ | BZB | 0.418 |
| 4FGL J0437.4–6155 | BCU | ⋯ | ⋯ | BZB | ⋯ |
| 4FGL J0443.3–6652 | BCU | J044318.24–665204.4 | ⋯ | BZQ | 0.746 |
| 4FGL J0506.0–0357c | BCU | J050605.98–040152.4 | ⋯ | BZB | ⋯ |
| 4FGL J0509.9–6417 | BCU | ⋯ | ⋯ | BZB | 0.271 |
| 4FGL J0525.6–2008 | BCU | ⋯ | ⋯ | BZG | 0.092 |
| 4FGL J0526.7–1519 | BCU | J052645.44–151900.5 | ⋯ | BZB | ⋯ |
| 4FGL J0538.2–3910 | BLL | J053810.36–390842.5 | ⋯ | BZB | ⋯ |
| 4FGL J0620.7+2643 | BCU | J062040.05+264331.9 | ⋯ | BZG | 0.134 |
| 4FGL J0647.0–5138 | BCU | J064710.04–513547.7 | ⋯ | BZB | ⋯ |
| 4FGL J0651.0+4013 | BCU | J065105.41+401338.1 | ⋯ | BZB | ⋯ |
| 4FGL J0652.1–4813 | BCU | J065200.57–480859.3 | ⋯ | BZB | ⋯ |
| 4FGL J0654.0–4152 | BCU | J065359.90–415144.9 | 0.091 | BZG | 0.091 |
| 4FGL J0703.3–0050 | BCU | J070319.08–005103.1 | ⋯ | BZB | ⋯ |
| 4FGL J0709.2–1527 | BCU | J070912.51–152703.5 | ⋯ | BZB | 0.142 |
| 4FGL J0719.1–7055 | BCU | J071908.60–705403.4 | ⋯ | BZB | 0.339 |
| 4FGL J0731.2–1403 | BCU | J073112.98–140207.0 | ⋯ | BZB | ⋯ |
| 4FGL J0744.2–6918 | BCU | J074420.39–691907.1 | ⋯ | BZB | ⋯ |
| 4FGL J0749.4+1058 | BCU | J074927.38+105733.1 | 0.214 | BZB | > 0.827 |
| 4FGL J0830.0+5231 | BCU | J083010.91+523027.1 | 0.2057 | BZG | 0.206 |
| 4FGL J0847.0–2336 | BCU | J084701.57–233701.7 | 0.0607 | BZG | 0.061 |
| 4FGL J0929.3–2414 | BCU | J092928.23–241632.9 | ⋯ | BZG | 0.208 |
| 4FGL J0953.4–7659 | BCU | J095304.35–765802.0 | ⋯ | BZB | 0.109 |
| 4FGL J0959.6+4606 | BCU | J095919.80+460351.9 | ⋯ | BZG | 0.148 |
| 4FGL J1008.0+0028 | BCU | J100811.44+002959.9 | 0.0979 | BZB | 0.098 |
| 4FGL J1012.7+4228 | AGN | J101244.28+422956.9 | 0.3651 | BZB | ⋯ |
| 4FGL J1020.7-3920 | BCU | J102038.95–392056.2 | ⋯ | BZB | ⋯ |
| 4FGL J1052.3+0818 | BCU | J105224.53+081409.5 | 0.2234 | BZG | 0.224 |
| 4FGL J2211.2–1325 | BCU | J221124.09–132809.7 | 0.3921 | BZQ | 0.391 |
| 4FGL J2230.9–7815 | BCU | J223030.53–781556.4 | ⋯ | BZQ | 0.511 |
| 4FGL J2246.7–5207 | BCU | J224642.10–520640.4 | 0.194 | BZB | 0.194 |
| Not present in the 4FGL 2.2 release | |||||
| 4FGL J0041.9–4702 | BCU | J004147.02–470136.9 | 0.15 | BZG | 0.150 |
| 4FGL J0056.5–3936 | BCU | J005620.10–394144.3 | 0.2626 | BZG | 0.263 |
| 4FGL J0214.1–4733 | BCU | J021409.84–473235.2 | ⋯ | BZG | 0.172 |
| 4FGL J0331.8–7040 | BCU | J033202.35–703948.9 | ⋯ | BZG | 0.277 |
| 4FGL J0516.8–0509 | BCU | J051728.10–052041.0 | 1.4129 | BZQ | 1.405 |
| 4FGL J0527.3–6223 | BCU | J052745.43–622516.7 | 0.0836 | BZB | 0.083 |
| 4FGL J0648.4–6941 | BCU | J064850.50–694522.5 | ⋯ | BZG | 0.233 |
Note. The last seven sources of the table are those present in the first release of the 4FGL, but removed in the last 2.2 release. Column description: (1) 4FGL Source Name; (2) 4FGL Source Class; (3) Associated Counterpart; (4) Old Redshift; (5) R.A. (J2000); (6) decl. (J2000); (7) New Source Class; (8) New Redshift; (9) Telescope.
We obtained redshift estimates for 41 BCU sources, 11 classified as BZQs, 18 classified as BZGs, and 10 classified as BZBs. For 19 sources we got redshift estimates consistent with the literature values. For the other 21 sources we obtained a spectroscopic redshift estimate for the first time.
Finally, for two other sources, namely the BZBs 4FGL J0433.7–5725 and 4FGL J0749.4+1058, we were able to provide lower limits on the redshift, namely z > 1.273 and z > 0.823, respectively (see Figure 1). The latter estimate is not consistent with the literature value z = 0.214 reported by Malkin (2018), but we could not find a SDSS spectrum for this source to confirm this. Redshift lower limits were estimated by the detection of intervening absorption systems in BL Lac spectra (Stocke & Rector 1997; Paiano et al. 2017; Landoni et al. 2018, 2020; Paiano et al. 2020). It is worth noting that in the literature there are only four BZBs with lower limits larger than our estimate for 4FGL J0433.7–5725.

Figure 1. Spectra of BZB sources 4FGL J0433.7–5725 (upper panel) and 4FGL J0749.4+1058 (lower panel) obtained with Víctor M. Blanco Telescope at Cerro Tololo Inter-American Observatory. The redshift lower limits are estimated using the Mg II and Fe II absorption lines.
Download figure:
Standard image High-resolution image5. Summary and Conclusions
Identifying the nature of blazar candidates and determining their redshift are crucial since it helps to: (i) obtain more stringent constraints on their luminosity function (Ajello et al. 2014; Ackermann et al. 2016); (ii) study the imprint of the extragalactic background light in the blazar γ-ray spectra (e.g., Domínguez Sánchez et al. 2011; Ackermann et al. 2012b; Sandrinelli et al. 2013); (iii) select potential targets for TeV observatories (Massaro et al. 2013b; Arsioli et al. 2015); (iv) search for new classes of γ-rays sources (Massaro et al. 2017; Bruni et al. 2018); and (v) set more stringent limits on the annihilation of dark matter in subhalos (see e.g., Zechlin & Horns 2012; Ackermann et al. 2014; Berlin & Hooper 2014).
D'Abrusco et al. (2012) discovered that γ-ray emitting blazars occupy a specific region of the two-dimensional WISE color–color planes. As shown in Figure 2, BZBs and BZQs are fairly separated in the W1–W2 versus W2–W3 WISE color–color plane, with BZQs (red dots in the figure) occupying the upper right part of the plane, and BZBs (blue dots) aligned along a strip extending toward the lower left. In addition, BZGs tend to occupy the lower-left region of this plane (see Figure 20 of Paggi et al. 2020). As shown in Figure 2, the BCUs that we classify as BZBs in this analysis (orange squares) mainly occupy the region of γ-ray BZBs in the WISE color–color plane. Similarly, BCUs that we classify as BZGs (purple triangles) tend to cluster in the lower-left region of the plane, where γ-ray BZBs are usually found. On the other hand, BCUs that we classify as BZQs (black diamonds) are scattered along the BZGs, BZBs, and BZQs regions of the color–color diagram. This can be due to either source variability or "changing-look" blazars.

Figure 2. γ-ray emitting blazars from Roma-BZCAT (BZBs indicated with blue dots and BZQs indicated with red dots) in the W1–W2 vs. W2–W3 WISE color–color plane. BCUs classified as blazars in the present analysis are overplotted with the symbols indicated in the legend.
Download figure:
Standard image High-resolution imageSince the optical classification of blazars relies on somewhat arbitrary thresholds on the EW and continuum to spectral features contrast, their spectral variability (Gaur et al. 2012; Isler et al. 2013; León-Tavares et al. 2013) can lead to changes in their classification (see, e.g., Vermeulen et al. 1995; Pian et al. 1999; Capetti et al. 2010; Ghisellini et al. 2011; Ruan et al. 2014; Álvárez Crespo et al. 2016a; Acosta-Pulido et al. 2017). In addition, the optical classification of blazars can be affected by observational effects, like the signal-to-noise ratio, spectral coverage, and spectral resolution. Since BZGs and BZBs are differentiated by the Ca ii break strength, changes between these classes are also sensitive to the continuum arising from the jet and the orientation angle (Landt et al. 2002; Massaro et al. 2012). In addition, a high level of the nonthermal jetted continuum radiation can "swamp" the other emission arising from the blazar—like the disk emission, the broad emission lines, or the host-galaxy emission—leading to a BZB classification (Giommi et al. 2012, 2013).
In this work we analyzed 64 sources present in different releases of 4FGL, 62 BCUs, one generic AGN, and one source listed in the 4FGL as a BLL and in the Roma-BZCAT as a BZU. Through optical spectroscopic observations collected at various ground-based telescopes we were able to confirm the blazar nature of all BCUs, classify the AGN as a BZB, and confirm the BLL source as a BZB. In addition, we obtained the first spectroscopic redshift estimate for 21 sources and put a lower limit on the redshift of two other sources.
The remaining BL Lacs without known redshift are potential targets for indirect redshifts determinations. In the last decades, several methods were proposed to achieve indirect redshift estimates for BL Lac objects. In particular, the use of ultraviolet observations looking for the Lyα forest (see e.g., Danforth et al. 2010, 2013; Furniss et al. 2013, 2019). Also, searching for an attenuation signature at the Lyman limit due to intervening absorbing systems along the line of sight (see e.g., Rau et al. 2012; Kaur et al. 2017, 2018; Rajagopal et al. 2020). Also, looking for their host galaxy (see e.g., Farina et al. 2018).
Another method for estimating BL Lac redshifts is to investigate their environment searching for groups or clusters of galaxies surrounding BL Lacs with unknown redshifts (see, e.g., Falomo et al. 1990, 1993a, 1993b, 1995, 1996; Romanishin 1992; Pesce et al. 1994, 1995; Rovero et al. 2016; Torres-Zafra et al. 2018; Johnson et al. 2019). However recent analyses showed that the large scale environments of BL Lacs are not as those expected for classical radio galaxies (Massaro et al. 2020a) and cosmological biases (Massaro et al. 2020b), and Massaro et al. (2019) can thus indicating that further investigations should be carried out to obtain a more robust statistical validation of this procedure.
With this work we close the first phase of our optical spectroscopic campaign, aimed at identifying the nature of blazar candidates, confirming the classification of known blazars, and determining their redshift. Including the sources studied in the present analysis, during the last nine years we either observed or analyzed archival spectra of 435 blazar and blazar candidates, including 129 blazars already included in the fifth edition of the Roma-BZCAT but without clear classification or redshift estimate. Figure 3 shows a summary of the sources that we classified across the years, both through dedicated optical spectroscopic observations (upper panel) or through analysis of archival spectra (lower panel). In particular, we classified 337 sources as BZBs, 47 as BZGs, and 51 as BZQs. We also provided redshift estimates or lower limits for 82 BZBs previously without redshift.
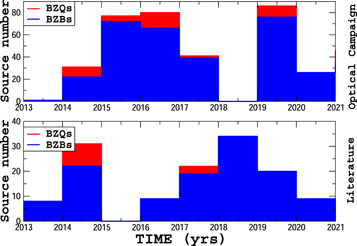
Figure 3. Summary of the sources classified during the optical spectroscopic campaign for each year through dedicated spectroscopic observations (upper panel) and through analysis of archival spectra (lower panel). With the blue and red colors we indicate the sources classified as BZBs and BZQs, respectively.
Download figure:
Standard image High-resolution imageAll these results will be included in the upcoming release of the sixth edition of the Roma-BZCAT Multifrequency Catalog of Blazars, providing information about the new discovered blazars, the newly classified sources, and the new redshift estimates collected during this nine-year-long optical campaign.
Finally, BL Lacs play a crucial role to investigate the extragalactic background light (EBL; i.e., the integrated light from all celestial objects since the re-ionization epoch), for which signatures are imprinted in their γ-ray spectra (see e.g., (Stecker et al. 1992). This feature allow also to constrain the EBL evolution with cosmic time (see e.g., Aharonian et al. 2006; Ackermann et al. 2012a; Domínguez et al. 2013; Domínguez & Ajello 2015). However, it is necessary to know the redshift of γ-rays blazar, proven to be challenging for those BL Lacs showing featureless optical spectra. Our new redshift measurements on γ-ray blazars will contribute to better constrains of the EBL. Particularly, our results on the lower limits of 4FGL J0433.7–5725 and 4FGL J0749.4+1058 at z > 1.273 and z > 0.823 will be of importance for EBL constrains as they are more sensitive to high-redshift sources.
This work was supported by CONACyT (Consejo Nacional de Ciencia y Tecnología) research grant 280789 (Mexico). R.A.A.-A. acknowledges support from the CONACyT program for PhD studies. This work is supported by the MPIfR-Mexico Max Planck Partner Group led by V.M.P.-A. Based on observations obtained at the Southern Astrophysical Research (SOAR) telescope, which is a joint project of the Ministério da Ciência, Tecnologia, e Inovação (MCTI) da República Federativa do Brasil, the U.S. National Optical Astronomy Observatory (NOAO), the University of North Carolina at Chapel Hill (UNC), and Michigan State University (MSU). Part of this work is based on archival data, software or online services provided by the ASI Science Data Center. This publication makes use of data products from the Wide-field Infrared Survey Explorer, which is a joint project of the University of California, Los Angeles, and the Jet Propulsion Laboratory/California Institute of Technology, funded by the National Aeronautics and Space Administration. We acknowledge TOPCAT 18 (Taylor 2005) for the preparation and manipulation of the tabular data and the images.
Appendix: Spectra and Finding Charts
In this appendix we collect the optical spectra and finding charts for the 64 sources analyzed in this work. In Figure 4 we present the optical spectra with identified lines (upper panels) and normalized spectra (lower panels). In Figure 5 we present the finding charts that show the second generation Digitized Sky Survey in the r band. The complete figure sets of the spectra and finding charts are available in the online journal.
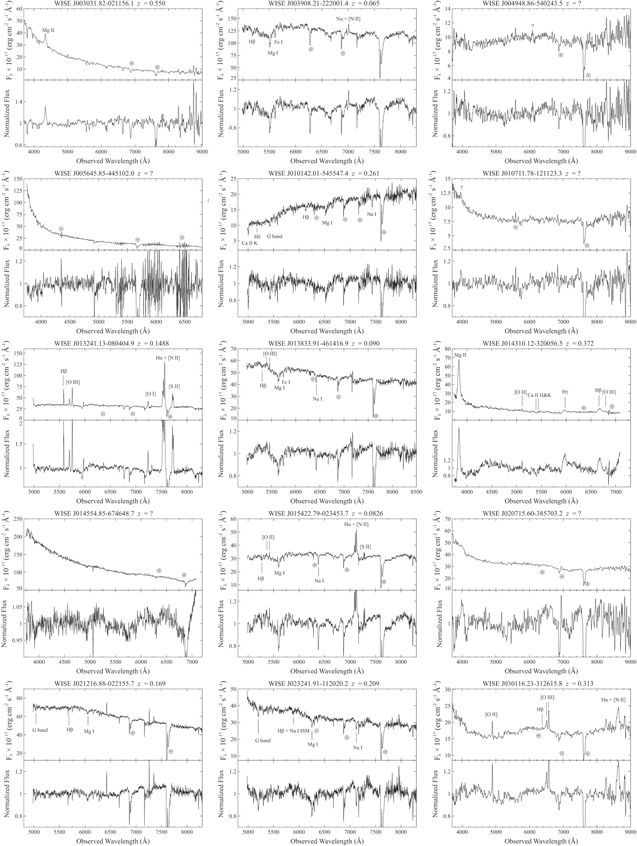
Figure 4.
Optical spectra of the 64 sources analyzed in this work. In the upper panels we show the spectra with identified lines, while in the lower panels we show the spectra normalized to one. The complete figure set (five images) is available in the online journal. (An extended version of this figure is available.)
Download figure:
Standard image High-resolution image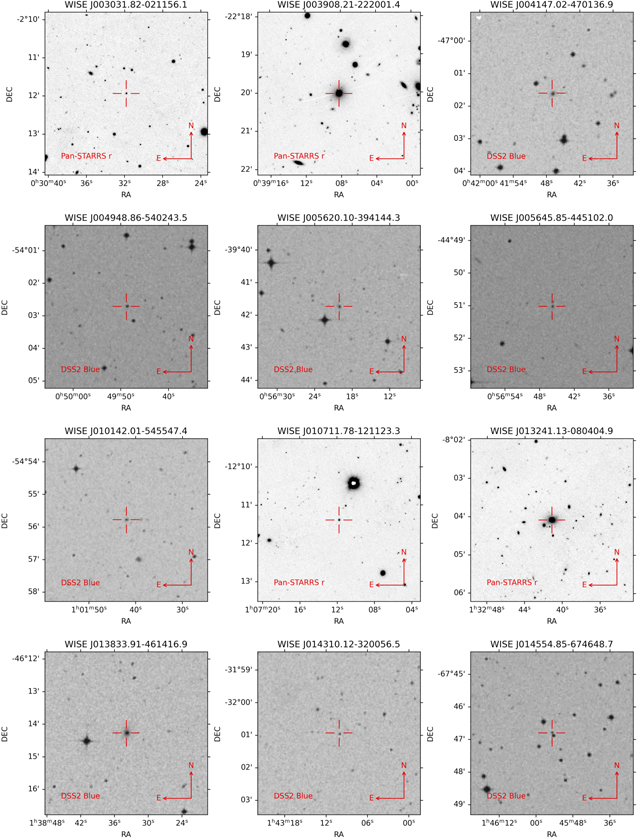
Figure 5.
Finding charts of the 64 sources analyzed in this work. The images corresponds to the 2nd Digitized Sky Survey (red). The complete figure set (six images) is available in the online journal. (An extended version of this figure is available.)
Download figure:
Standard image High-resolution image