


Abstract
We observed the compact group of galaxies NGC 6845 with GMOS-S imaging and long-slit spectroscopy. The group itself is comprised of two spiral galaxies and two S0 galaxies, and shows signs of gravitational interaction among them. While the spiral galaxies have been already well studied, the two S0 galaxies have received little attention. We investigate the morphology and stellar kinematics of the two S0 galaxies in detail in order to derive the value for their mass and subsequently incorporate them into the mass model for the group. It was found that the internal kinematics of the largest S0 (NGC 6845 C) is mostly regular, while the smallest S0 (NGC 6845 D) shows some hint of interaction, most likely with NGC 6845 C and NGC 6845 A. The new determination of the dynamical mass of the group implies that the group mass has to be 10 times the combined mass of the individual members according to their internal kinematics. The results point to an early stage of the group interaction and also to the possibility that it has still not reached virial equilibrium. From the galaxy evolution viewpoint, this group represents an example of the case of the transformation of Spirals into S0 galaxies in dense environments.
Export citation and abstract BibTeX RIS
1. Introduction
Compact groups (CGs) of galaxies consist of 3–5 galaxies with small projected separations (i.e., comparable to the individual galaxies' diameters) and within a ∼3 mag range in brightness. Therefore they are among the densest structures in the universe.
Although the existence of CGs has been established since the discovery of Stephan's Quintet (Stephan 1877), the first criteria for an objective definition were introduced by Rose (1977; hereafter R77), and Hickson (1982; hereafter H82), based on measurable quantities. The first criteria by R77 were: (i)  with
with  , (ii)
  , where n is the number of galaxies, m is the blue magnitude, A is the area on the sky subtended by the group, and σ is the average surface density of field galaxies with
  . The second set of criteria, by H82, were (i)
  with
with  , (ii)
  , and (iii)
  , where mB
is the magnitude of the brightest member, RG
is the smallest angular diameter that contains the geometric center of each member galaxy,
, where mB
is the magnitude of the brightest member, RG
is the smallest angular diameter that contains the geometric center of each member galaxy,  is the mean surface brightness contained in this area, and RN
is the angular diameter of the largest concentric circle that contains no other external galaxies within this magnitude range or brighter.
is the mean surface brightness contained in this area, and RN
is the angular diameter of the largest concentric circle that contains no other external galaxies within this magnitude range or brighter.
One long-standing question is whether the galaxies in CGs are physically as close as they appear (e.g., Hickson 1997; Oehm & Kroupa 2018). Another issue from the theoretical point of view concerns the lifetime of these objects: believed to be transient configurations by many investigators (e.g., Rose 1979; Rose & Graham 1979), their physical reality has been questioned by several studies involving N-body simulations (e.g., Barnes 1989); on the other hand, arguments in favor of it have been provided on observational grounds (e.g., Tovmassian et al. 2000). Besides their importance from the cosmological viewpoint, CGs are very good candidates for the study of galaxy interactions and mergers, since they provide a variety of dynamical stages of evolution, ranging from three to five mildly interacting galaxies to those close to becoming a single merged galaxy.
The NGC 6845 group was first identified by Klemola (1969). It was selected and classified as a CG in R77 according to the criteria defined there and cataloged as Rose 38 (note that it also satisfies the criteria from H82). It is comprised of four galaxies and was first studied individually by Graham & Rubin (1973). In this first study all member galaxies were identified as spirals, two of them "seen nearly edge on." These two were later reclassified as S0 (de Vaucouleurs et al. 1991). The member galaxies were labeled as A, B (the two spirals), and C, D (the two S0s). The group spans roughly over 4' × 2' on the sky and shows signs of strong gravitational interaction: a tidal bridge with several star formation regions joins the two spirals and another two stellar debris filaments appear to link the S0 galaxies with the dominant spiral. All these morphological features had been identified on long-exposure photographic plates.
This group is particularly interesting for many reasons. It is one of the closest compact groups (63 h Mpc), yet relatively overlooked. The main galaxy (NGC 6845 A) is a spiral showing a maximum rotational velocity of ∼300 km s−1, among the highest known (Rodrigues et al. 1999), implying that its mass is comparable to that of M31 (e.g., Kafle et al. 2018) despite being of moderate size–only about one half the dimension of M31. The interaction between the spirals, consistent with a retrograde passage of B with respect to the direction of rotation of A, is not the type of interaction that would likely produce the observed tails and bridges (Klemola 1969; Graham & Rubin 1973; Rose 1977; Rose & Graham 1979). N-body models have not yet been able to completely reproduce the observed morphology, which suggests that the models still need to be improved. Rodrigues et al. (1999) focused mainly on the spiral galaxies, both observationally and with N-body simulations. They investigated the interaction between them via optical spectroscopy of the ionized gas. They derived the masses for the spirals and discussed plausible scenarios for the collision between them and the generation of the star formation knots. The group was also studied in H i (Rodrigues et al. 1999; Gordon et al. 2003).
In order to complete the picture and gain a deeper understanding of the nature of the member galaxies–and also address the question about the stability of the configuration, its lifetime, and future evolution of this representative of strongly interacting, young compact groups–it would be essential to derive accurate values for the masses of the two S0 galaxies. With this purpose in this work, we focused on the observations of NGC 6845 C and NCG 6845 D using Gemini/Gemini South Multiobject Spectrograph (GMOS-S) imaging and long-slit spectroscopy.
2. Observations and Data Reduction
The observations were performed with the GMOS-S (Hook et al. 2004) mounted at the 8.1 m Gemini South telescope. The observations taken before 2014 June used the GMOS-S EEV detector array, which consists of three adjacent 2048 × 4608 pixel CCDs separated by two 0.5 mm wide gaps and a pixel scale of 0 073 pix−1 in the unbinned mode and a spectral response of approximately 360–930 nm; while the observations taken after that date used the new Hamamatsu CCDs detector array, which consists of three 2048 × 4176 pixel CCDs separated by two gaps of 0.92 mm width The scale is 008 pix−1 in unbinned mode. The spectral response range of these detectors is 360–1030 nm, with improved sensitivity in wavelengths redder than 650 μm, as compared to the previous detectors (Gimeno et al. 2016).
Imaging was done using  broadband filters. The average seeing obtained ranged from from 083 in the g' band to 053 in the z' band. The z' band image featured the best seeing and is the least affected by internal extinction by dust. Therefore it was adopted as the best tracer of the stellar mass and used for the morphological analysis. The imaging observations are summarized on Table 1.
Table 1. Summary of Imaging Observations
| Detector | Filter | Seeing (arcsec) | Exposure Time (s) | Mean Airmass |
|---|---|---|---|---|
| (1) | (2) | (3) | (4) | (5) |
| EEV | g' | 0.83 | 2520 | 1.25 |
| EEV | r' | 0.75 | 1680 | 1.16 |
| EEV | i' | 0.58 | 990 | 1.07 |
| EEV | z' | 0.55 | 900 | 1.05 |
Note. (1) CCD type. (2) GMOS broadband filter. (3) Seeing on the final combined image. (4) Total exposure time. (5) Mean airmass during observations.
Download table as: ASCIITypeset image
The spectroscopy observations consisted of long-slit spectra along the major axis of the galaxies, to derive the mean stellar rotation curve and the velocity dispersion in the inner regions, using the calcium triplet (Ca ii) lines at 849.8, 854.2, and 866.2 nm (e.g., Dressler 1984). The choice of GMOS at Gemini South is optimal for this study from the availability of the Nod and Shuffle (N&S) mode for spectroscopy (Glazebrook & Bland-Hawthorn 2001), since accurate subtraction of the sky lines is fundamental due to their high density at long wavelengths and the relatively low surface brightness of the disks of the galaxies. The diameter of the biggest of the two galaxies is about half the angular size of the N&S slit (108''), which allows the effective use of this mode with nodding direction along the slit.
Spectroscopic observations taken with the EEV array used the R831 grating with the 05 wide slit. The CCD was binned by two in the spatial direction, which results in a spatial scale of 0146/pixel. The spectroscopy of galaxy C was taken with this configuration. Observations of galaxy D on the other hand were taken with the Hamamatsu array using the R400 grating with the 10 slit, with a spatial scale of 016/pixel under 2× spatial binning. The spectroscopy observations are summarized in Table 2.
Table 2. Summary of Spectroscopic Observations
| Galaxy | Detector | Grating | Slit | Wavelength | Dispersion | R | Range | Exposure Time(s) |
|---|---|---|---|---|---|---|---|---|
| (1) | (2) | (3) | (4) | (5) | (6) | (7) | (8) | (9) |
| C | EEV | R831 |

| 850 | 0.068 | 5328 | 745–957 | 4 × 1200 |
| D | Hamamatsu | R400 |

| 860 | 0.151 | 1080 | 622–1097 | 1 × 810 |
Note. (1) Observed galaxy. (2) CCD type. (3) Diffraction grating. (4) Slit width. (5) Observation central wavelength in nm. (6) Dispersion in nm pix−1 at the observing central wavelength. (7) Resolution  at observing central wavelength. (8) Spectral range of the observations in nm. (9) Exposure time
Download table as: ASCIITypeset image
All data were processed in the standard way: bias frames, flat fields, and fringe frames were observed for imaging processing and arc lamp exposures for wavelength calibration. All these were taken as part of the Gemini baseline calibrations. Raw data were reduced using the standard gmos iraf package. 7 Template K-type stars were observed for the spectral cross-correlation analysis. The radial velocities and velocity dispersions were computed from the Ca ii absorption lines with the cross-correlation technique (Tonry & Davis 1979). For the calculation of all distance dependent quantities, a value of H0 = 67 km s−1 Mpc−1 is assumed. A constant mass-to-light ratio is assumed for each component of the mass models of the galaxies.
3. Results and Analysis
3.1. Imaging
Figure 1 shows the GMOS-S stacked  image of NGC 6845. In this multiband image, the contrast between the two spirals and the two S0s can be readily noticed. The former show bluer spiral arms and have numerous star-forming regions. These regions have been intensively studied (e.g., Rodrigues et al. 1999; Olave-Rojas et al. 2015). The two S0 galaxies on the other hand have a smoother appearance, devoid of star-forming regions, and a more uniform color; nevertheless, they do show some structure and also hints of interaction.

Figure 1. Combined 4' × 4' GMOS-S  image of NGC 6845. From left to right: galaxies B, A, C, D. North is up, east to the left.
Download figure:
Standard image High-resolution imageAs mentioned before, this study focuses on the two S0 galaxies. After reducing the data and deriving the structural parameters, the two-dimensional algorithm GALFIT (Peng et al. 2002) was used to fit bulge and disk components to the galaxies' z' images. Once the best fit is achieved, the resulting PSF-deconvolved model would serve as the basis for constraining the dynamically motivated models (described in more detail in Appendix).
For each galaxy, the photometry was performed over a rectangular aperture, after masking foreground stellar sources. The instrumental fluxes were converted into magnitudes taking into account the photometric zero point and the atmospheric extinction coefficients tabulated for GMOS-S. 8 For computing the absolute magnitudes, we adopted for the group the distance of 42.2 Mpc (corresponding to the mean observed recession velocity and our assumed value for H0). The luminosities were computed from the absolute magnitudes. One important aspect to consider in general is internal extinction. Since we work in the z' band, this is expected to be relatively low. For the internal extinction, we adopted the empirical expression

for the correction to be applied in order to obtain the face-on magnitude, where (a/b) is the axial ratio. The latter was taken from the GALFIT model. The factor  depends mainly on the wavelength and weakly on the luminosity. It was investigated in the optical by Giovanelli et al. (1994), Tully et al. (1998), and in the near infrared by Masters et al. (2003). According to these studies, for the I band the value of
  is about ∼1.0, whereas the lower limit for J is ∼0.3. Therefore we adopted here a value
  , considered to represent a realistic lower limit estimation in z' for the purpose of this study. The galactic extinction value was taken from Schlafly & Finkbeiner (2011). Solar absolute magnitudes were taken from Willmer (2018).
The galaxies' luminosity values were in turn used for computing the mass to luminosity ratio (M/L) together with the mass of the adopted Satoh model.
Table 3 shows the results from the photometry.
Table 3. NGC 6845 C and D: Magnitudes and Luminosities
| Galaxy | z' | ΔmGal | Δmint |

|

|
|---|---|---|---|---|---|
| (1) | (2) | (3) | (4) | (5) | (6) |
| C ⋯ | 12.70 ± 0.05 | 0.057 | 0.25 | −22.60 |

|
| D ⋯ | 14.28 ± 0.05 | 0.057 | 0.26 | −21.01 |

|
Note. (1) Individual galaxy name. (2) Apparent z' magnitudes, corrected for atmospheric extinction. (3) Galactic extinction in z'. (4) Internal extinction correction. (5) Absolute z' magnitude, corrected for galactic and internal extinction. (6) Luminosity in solar units (see main text for further details).
Download table as: ASCIITypeset image
3.1.1. NGC 6845 C
Galaxy C is the greatest of the two galaxies of this study, with an apparent diameter of about  . Classified as S0 in de Vaucouleurs et al. (1991), in GMOS-S imaging the structure appears more complex. The bulge is very bright and the nucleus has the highest central surface brightness in the group. The disk has a high inclination (close to edge on) and shows some structure resemblant of spiral arms. Figure 2(a) shows the z' band GMOS-S image, in which the dust obscuration is less prominent. Figure 2(b) shows also the GALFIT model, consisting of a Gaussian nucleus, a
  bulge, and an exponential disk.

Figure 2. (a) GMOS-S z' image (left) and (b) GALFIT model (right) for NGC 6845 C.
Download figure:
Standard image High-resolution image3.1.2. NGC 6845 D
This is the smallest of the group members. Classified also as S0 in de Vaucouleurs et al. (1991), in the GMOS-S image, the structure also appears more complex, as is the case of galaxy C. The nucleus is bright and distinctive, and the disk has a high inclination and features a ring-shaped structure. Figure 3(a) shows the z' band GMOS-S image. Also noticeable are two condensations or "ansae" on either extreme of the major axis of this ring, possibly an enhancement as a consequence of the projection of the highly inclined ring structure mentioned above.

Figure 3. (a) GMOS-S z' image (left) and (b) GALFIT model (right) for NGC 6845 D.
Download figure:
Standard image High-resolution imageAfter fitting a nucleus+bulge+disk model with GALFIT, it was found that indeed a fourth component was needed for fitting the ring structure as well as the aforementioned condensations: Figure 3(b) shows the adopted GALFIT model, consisting of a nucleus, a bulge, a disk, plus an outer ring-like structure, modeled after the truncated disk.
The outer disk shows mild warping on the northern side, toward galaxy C. As will be shown in Section 3.2, this corresponds to the receding side of the stellar rotation curve. The southern side of the disk, on the other hand, features a "puff-up" on the surface brightness, evidenced by the outer isophotes. These tidal distortions can be seen more clearly in Figure 4, where the isophotes are depicted explicitly.

Figure 4. Isophotes of the GMOS-S z' image of NGC 6845 D. The right (receding) side corresponds to the N-NE, where a mild warp of the outer isophote can be appreciated. This warp points toward NGC 6845 C. On the left (approaching) side, a "puff-up" of the outer disk can be inferred. Innermost isophote corresponds to 18 mag/ , outermost to 23 mag/
 .
.
Download figure:
Standard image High-resolution image3.2. Spectroscopy
Long slit spectra were acquired along the major axis for both galaxies. The observations details are listed in Table 2. Figure 5 shows the reduced 2D spectra of galaxies C and D, where the Ca ii absorption lines tracing the stellar rotation curve can be readily distinguished. The night sky emission lines were satisfactorily removed thanks to the Nod and Shuffle technique.

Figure 5. GMOS-S z' image and spectrum in the Ca ii region, of galaxy C (top) and D (bottom). Wavelength scale is in Angstroms. The Ca ii absoption lines are indicated with vertical bars. On the galaxies' inset images, SSE side of the galaxies is to the top.
Download figure:
Standard image High-resolution image3.2.1. NGC 6845 C
Figure 6 shows the results of NGC 6845 C spectroscopic observations. On the top panel, the differential stellar rotational velocity and the velocity dispersion are plotted, both from the Ca ii long slit observations along the major axis. The absorption Ca ii lines can be traced up to ∼14'' ≃ 6 kpc from the center, corresponding to a surface brightness of  20 mag/
 . The data were obtained with the EEV detectors. As can be seen, the amplitude of the rotation curve (≈480 km s−1) is quite large, comparable to that of galaxy A (which was pointed out by Graham & Rubin (1973) as having one of the largest known maximum rotational velocities). The fact that the rotation curves are relatively symmetrical, indicates that galaxies A (studied by Rodrigues et al. 1999) and C are fairly massive. We inspected the rotation curves of spiral galaxies published by Catinella et al. (2005) and found that only 65 out of a total of 403 spiral galaxies (∼16%) have a rotation curve amplitude larger than (∼480 km s−1). The central velocity dispersion is also high, similar to the highest known in S0 galaxies (e.g., Fisher 1997).

Figure 6. Kinematics of NGC 6845 C. Observed mean stellar rotational velocity and velocity dispersion. The scatter between adjacent data points is a measure of the uncertainties involved (∼10 km s−1 in the inner  , ∼40–50 km s−1 at the outer regions.)
Download figure:
Standard image High-resolution image3.2.2. NGC 6845 D
Figure 7 shows the results of NGC 6845 D spectroscopic observations. These data were obtained with the new Hamamatsu detectors, which feature a much improved sensitivity between 650 and 1030 nm, and negligible fringing, as compared to the EEV detectors (Gimeno et al. 2016). As a consequence, a much better signal-to-noise was achieved in the end, with less exposure time than what would have been required with the previous detectors. The stellar rotation curve is fairly symmetric within the inner 8'', so there is a pronounced drop in the southern (blue) side.

Figure 7. Same as Figure 6 but for NGC 6845 D. Additionally, the rotation from  and N[ii] are also plotted.
Download figure:
Standard image High-resolution imageAs this was observed with the R400 grating with greater spectral coverage, the gas rotation curve was also observed from the H ii and N[ii] emission lines. These are plotted in Figure 7 as well, along with the stellar rotation curve. The gas is corotating with the stars and the gas rotation curve rises above the stellar one in the inner 4''-expected if the gas is a tracer of circular motions.
3.3. Mass Models
The GALFIT model was used as the base for deriving a dynamically motivated mass model based on Satoh (1980) with analytic expressions for the potential-density distributions. The purpose of applying this model is to be able to reproduce simultaneously the observed morphology and kinematics. The procedure was to extract the intensity along the major axis of the image of the GALFIT model. In this way, we retrieve a PSF-deconvolved surface brightness radial profile. Then we fit this profile with a Satoh model after considering the inclination and integrating along the line of sight. By doing this, the structural parameters for the components of the Satoh model are determined (see Appendix for further details). Although the GALFIT model used three components for the adopted best fit, only two components (bulge+disk) sufficed for the Satoh model (after experimenting with a varying number of components, it was found that little is to be gained by increasing complexity adding more components). The inclination was computed simply from the axes ratio of the GALFIT model disk component. Figures 8 and 9 show the radial plots along the major axis of the composite GALFIT and Satoh models obtained as described above.

Figure 8. Radial plots of the surface brightness profile along the major axis of the composite GALFIT and Satoh models for galaxy C.
Download figure:
Standard image High-resolution image
Figure 9. Same as 8 but for Galaxy D.
Download figure:
Standard image High-resolution imageFigures 10 and 11 show the spectroscopy data again for galaxies C and D, respectively, together with the corresponding rotational velocity and the velocity dispersion curves computed from the analytic Satoh (1980) models. The parameters of the models are listed in Table 4. The observed stellar rotation and velocity dispersion curves are fairly well reproduced by the model curves. The velocity dispersions are higher toward the center, although for galaxy D there is a hint of a dip in the inner ∼04. Also in the case of galaxy D, the rotation curve shows a decrease on the approaching side, as pointed out in Section 3.2.2. Together with the bending of the outer isophotes and the "puff up," this builds a picture consistent with a strong, recent interaction, where the overall morphology has not been dramatically impacted yet. These findings support the scenario proposed by Rose & Graham (1979).

Figure 10. Kinematics of NGC 6845 C. Top panel: observed mean stellar rotational velocity and velocity dispersion. The scatter between adjacent data points is a measure of the uncertainties involved (∼10 km s−1 in the inner  , ∼40–50 km s−1 at the outer regions.). Bottom panel: computed rotational velocity and velocity dispersion curves from the corresponding Satoh dynamical model, plotted together with the data.
Download figure:
Standard image High-resolution image
Figure 11. Same as Figure 10 but for NGC 6845 D.
Download figure:
Standard image High-resolution imageTable 4. NGC 6845: Models Parameters
| Parameter | NGC 6845 C | NGC 6845 D |
|---|---|---|

| 12.63 | 14.26 |
 ( ( ) ) | 18.0 | 3.51 |

 ) ) | 2.61 | 1.50 |

| 77.0 | 71.3 |

| 3.60 | 0.53 |

| 0.20 | 0.10 |

| 0.65 | 1.00 |

| 14.40 | 2.98 |

| 4.00 | 2.10 |

| 0.50 | 0.50 |
Note. The first four rows are the global properties of the derived models for each galaxy. Rows 5–7 are the bulge parameters and 8–10 are the disk parameters.
Download table as: ASCIITypeset image
3.4. The Total Mass of the Group
Table 5 shows the results of the radial velocity measurements, including the determinations of Rodrigues et al. (1999) for galaxies A and B, together with the results of the present work for galaxies C and D. Adopting the mean as the radial velocity of the group we have VGroup = 6664 km s−1. The radial velocity dispersion is σ = 305 km s−1.
Table 5. NGC 6845: Radial Velocities of the Individual Galaxies
| Galaxy | Lines |

|
|---|---|---|
| NGC 6845 A a | Hα | 6399 ± 20 |
| NGC 6845 B a | Hα | 6746 ± 20 |
| NGC 6845 C b | Ca ii | 6690 ± 20 |
| NGC 6845 D b | Ca ii | 7072 ± 20 |
Notes.
a Data for galaxies A and B from Rodrigues et al. (1999). b This paper.Download table as: ASCIITypeset image
The mass of NGC 6845 as a group, assuming that it is in dynamical equilibrium, was estimated by applying the four mass estimators described by Heisler et al. (1985); namely the virial mass  , the projected mass
  , the median mass
  , and the average mass
  . The first two involve the mean value of
  , where Vi
and
, where Vi
and  are the radial velocity and projected separation of galaxy i from the group center, and the others the average and median of
  . The results are shown in Table 6. Adopting the mean of the four values, we obtain for the group mass
  .
.
Table 6. NGC 6845: Dynamical Mass Estimations for the Group

|

|

|

|
|---|---|---|---|

|

|

|

|
Note. All values in  (see main text for details).
Download table as: ASCIITypeset image
These are in rough agreement with the values reported by Rodrigues et al. (1999). They computed the B mass-to-luminosity (M/L) ratio from their observations together with previously existing available data, and from that they reported a value for the group mass of  and
and  , depending on the prescription for internal absorption in the member galaxies.
If we consider the masses of the individual galaxies, we can see how their combined value compares with the values obtained above for the mass of the group as a whole. For galaxy A, Rodrigues et al. (1999) derived a value of  (scaled to match our adopted value of H0) from fitting a Satoh (1980) model to the optical rotation curve. They obtain the mass for galaxy B by scaling by the B/A luminosity value (note that this assumes the same M/L ratio for both galaxies), resulting in
  . For galaxies C and D, we obtained the M/L ratios from the mass of the fitted models as described above and the results of the photometry. The combined mass computed from the values for the masses of individual galaxies
  . If the group is assumed to be in equilibrium this represents less than 10% of the total mass.
Of special interest is the presence of ionized gas emission in galaxy D. A line emission from early-type galaxies has been detected in strongly interacting or merging compact groups (e.g., Tiersch et al. 1999) and also kinematically decoupled gaseous components have been detected in S0 galaxies, precisely by their counter-rotating emission lines, and related to the external origin of the gas (e.g Bertola et al. 1992). We note that in the case of NGC 6845 D the gas is corotating with the stars.
Numerical simulations of the evolution of CGs have addressed the problems of the possibly transient nature of these structures (Rose & Graham 1979; Rodrigues et al. 1999) and mentioned it as one possible explanation for the order-of-magnitude difference between the virial mass of the group and the sum of the individual member masses (or at least part of it).
From H i observations, Rodrigues et al. (1999) note that no irregularities in the H i velocity field are evident around galaxies C and D, pointing to a marginal role in the group. This supports the picture of a dominant pairwise interaction between galaxies A and B on one side and C with D on the other. Interaction between galaxies A and D is less likely as Rodrigues et al. (1999) pointed out. Higher resolution H i observations performed by Gordon et al. (2003) further confirmed this result. In addition, Rodrigues et al. (1999) and Olave-Rojas et al. (2015) pointed out that we are observing the very first encounter between galaxies A and B. All these results point to an early stage of the group interaction, raising the possibility that it has not reached virial equilibrium, as had been suggested by Rose (1979).
4. Stellar Content Analysis
The evolution of individual galaxies in groups and clusters is unavoidably linked to the environment they reside in. For the particular case of compact groups, this is expected to occur in a pronounced way given the high spatial density. In order to study the two S0s from this perspective, we derived the ( ) color to characterize the stellar content and compare the results with other studies of galaxies in groups and clusters done using similar techniques. The (
 ) colors for the two galaxies were derived from the GMOS images in g' and i'. The magnitudes were computed as described in Section 3.1. Of special note is the fact that, since these galaxies are close to edge on, internal extinction is expected to be nonnegligible, especially in the g' band, which will be the main source of uncertainty in the color index. Therefore this needs to be taken into account, although detailed modeling of the dust extinction is beyond the scope of this study. For deriving the corrected values, we formally applied the expression (1) for the bulge and disk components separately, where the axes ratio corresponds to those of each component as computed by the GALFIT model. Results are shown in Table 7.
Table 7. NGC 6845: Color Analysis
| Galaxy | Component | ( ) ) |

|

|
|---|---|---|---|---|
| (1) | (2) | (3) | (4) | (5) |
| NGC 6845 C | Total | 1.04 ± 0.03 | −22.65 ± 0.02 | 0.26 |
| Bulge | 1.09 ± 0.03 | −21.27 ± 0.02 | 0.12 | |
| Disk | 1.02 ± 0.03 | −22.29 ± 0.02 | 0.45 | |
| NGC 6845 D | Total | 1.06 ± 0.03 | −21.00 ± 0.02 | 0.28 |
| Bulge | 1.43 ± 0.03 | −19.01 ± 0.02 | 0.07 | |
| Disk | 0.99 ± 0.03 | −20.81 ± 0.02 | 0.30 |
Note. (1) Individual galaxy name. (2) Model component. (3) ( ) color index, corrected for galactic and internal extinction (see main text for details). (4) Absolute i' magnitude, corrected for galactic and internal extinction. (5) Adopted internal extinction correction in (
 ), computed from 1. The uncertainties in the magnitudes and colors come from the corresponding GALFIT model components. The adopted k-corrections Ki
= 0.02 and Kg
= 0.05 were computed following Chilingarian & Zolotukhin (2012).
), computed from 1. The uncertainties in the magnitudes and colors come from the corresponding GALFIT model components. The adopted k-corrections Ki
= 0.02 and Kg
= 0.05 were computed following Chilingarian & Zolotukhin (2012).
Download table as: ASCIITypeset image
Once these values were obtained, we plotted them on a ( ) color index versus absolute i'-magnitude diagram (CMD). On investigating early-type galaxies in the Coma cluster, Gavazzi et al. (2010; G10 hereafter) built this type of CMD. This is schematically shown in Figure 12, together with the results from our photometry (note that, while our data are corrected for internal extinction, data from G10 are not). As can be seen—except for the case of the bulge of galaxy D—our data follow the red sequence and fall roughly on top of it if we consider the values without the extinction correction; the latter represented by the arrow on Figure 12. The (
 ) color for the bulge and disk components are therefore consistent with the values obtained in previous studies of S0s in dense environments (e.g., Barsanti et al. 2021, their Figure 10; Head et al. 2014, their Figures 3 and 6). For comparison, in the most recent systematic study of isolated early-type galaxies (E and S0), Karachentseva et al. (2021) found
  for the S0s (not corrected for internal extinction), i.e., a bluer value, since the uncorrected colors for galaxies C and D are ∼1.3 (see Table 7).

Figure 12. NGC 6845 C and D ( ) color indices vs. i' absolute magnitude from Table 7. Also depicted are the loci occupied by the early-type galaxies (red) and late type galaxies (a.k.a. "red" and "blue" sequences) from Gavazzi et al. (2010). The heavy straight line corresponds to the empirical separation line between the red sequence and the rest, which is parallel to the best linear fit to the red sequence (gray line). The arrow represents the average internal extinction law.
Download figure:
Standard image High-resolution imageTo further complement the analysis of the stellar content, we included some results from the observed spectra of both galaxies. The main purpose of our spectroscopic observations in the present work was the study of the internal kinematics, therefore the wavelength coverage is too limited for thorough stellar population analysis. However, some conclusions can be drawn from the available spectral features regarding their star formation history. Figure 13 shows the 1D extracted spectra for the bulge and the disk for both galaxies. The spectra for galaxy C are featureless, apart from the Ca ii absorption lines. As already mentioned the coverage is very limited (745–957 nm) since it was observed with the R831 grating. The spectra for galaxy D, which span a larger wavelength range (622–1097 nm), show  and [N ii] emission. From the ratio of the fluxes between these emission lines and the
  equivalent width, we estimated the star formation on the nucleus and the disk. To this end, we adopted the spectroscopic classification scheme based on the WHAN diagnostic diagram (Cid Fernandes et al. 2010, 2011; Owers et al. 2019), which can achieve the purpose with fewer available lines. The results are summarized in Table 8. Galaxy C is classified as a "retired" galaxy (RG)—rather than "passive"—since it does show some N[ii] emission (Olave-Rojas et al. 2015). In this case, the galaxy has stopped forming stars and the old stellar populations suffice to explain the observed line emission. According to the Owers et al. (2019) classification (based also in WHAM), galaxy C would fall in the non-star-forming category.

Figure 13. Extracted 1D spectra for NGC 6845. From top to bottom. (a) The NGC 6845 C bulge: mean spectrum over an aperture of 1''; (b) NGC 6845 C disk: mean spectrum over an aperture of 10'' at R = ±10''; (c) same as (a) but for the NGC 6845 D bulge; (d) same as (b) but for the NGC 6845 D disk over an aperture of 5''. The observed CaT, N[ii] and Hα lines are labeled.
Download figure:
Standard image High-resolution imageTable 8. NGC 6845: Spectroscopic Classification
| Galaxy | Component |

|

| Class |
|---|---|---|---|---|
| NGC 6845 C | Bulge | −0.02 | 0.4 
| RG( a ) |
| NGC 6845 D | Bulge | −0.04 | 3.5 
| wAGN ( b ) |
| Disk | −0.23 | 6.0 
| wAGN ( b ) |
Notes.
a Data and classification of NGC 6845 C from Olave-Rojas et al. (2015). b This paper.Download table as: ASCIITypeset image
On the other hand, galaxy D does show appreciable  and N[ii] emission, consistent with a weak AGN-type (wAGN) emission (Cid Fernandes et al. 2010). Following the Owers et al. (2019) classification, galaxy D falls in the intermediate class, meaning that there may be some star formation ongoing albeit relatively weak. For the observed Hα equivalent width, and considering an instantaneous star formation law, the Starburst99 modeling (Leitherer et al. 1999) implies a lower bound for the age of the burst in galaxy D of 15 Myr (for comparison, Rodrigues et al. (1999) and Olave-Rojas et al. (2015) computed ages within the range of 2–8 Myr for the H ii regions in galaxies A and B). In conclusion, the S0s in NGC 6845 are not actively forming stars and the line emission present is mainly due to non-SF ionizing radiation, which in the case of this compact group can be attributable to shocks.
Of special note are the blue stellar aggregates that appear arranged along a curved path joining galaxy D with Galaxy A. These structures seem to be a product of the interaction and the brightest of them resembles a dwarf galaxy similar to the objects that form on tidal tails described in Duc & Mirabel (1994). They follow roughly the arc-shaped H i distribution where the gas density is higher, joining galaxies D and A. Figure 14 shows our b' image of NGC 6845 together with the H i isodensity map from Rodrigues et al. (1999). These features are among the bluest structures in the group, with color indices ( ) between −0.2 and 0.41. Figure 15 shows the (
 ) color map where this can be seen. In Table 9 we show the magnitudes and colors of these stellar complexes together with their ages, which were computed from the colors considering simple stellar population models from Maraston (2005) to get a rough estimate of the timelines involved. These models were chosen since they incorporate predictions on the Sloan SDSS passbands. An instantaneous burst was considered with solar metallicity and a Salpeter IMF. Remarkably, the data show a monotonic trend of increasing age from the galaxy D to A, indicating that the aforementioned dwarf galaxy is the oldest of these structures. In any case, according to these results all of them are about 102 Myr older than the H ii complexes in galaxies B and A studied by Rodrigues et al. (1999) and Olave-Rojas et al. (2015).

Figure 14. NGC 6845 g' image with H i contour map from Rodrigues et al. (1999) superimposed. The peak flux is  . The contour levels are equally spaced, from
  to
to  . The blue circles mark the blue stellar knots (see main text for details). The tidal bridge joining galaxies D and A, outlined by the stellar knots, is roughly aligned with the H i higher density distribution. Beam size is shown at the lower left corner.
Download figure:
Standard image High-resolution image
Figure 15. NGC 6845 ( ) color map. The scale is shown on the right. The stellar complexes joining galaxies D with the tail of galaxy A (see main text for details) appear distinctly in blue colors. For the sake of clarity, the sky pixels (mean
  ) were masked in order to remove the background noise that results after making the color map. PSF matching was performed before building the color map.
Download figure:
Standard image High-resolution imageTable 9. Magnitudes and Colors for the Stellar Knots
| Region | g' |

| Aperture |

|
|---|---|---|---|---|
| 1 (dwarf galaxy)⋯ | 19.59 ± 0.05 | 0.41 ± 0.07 | 7'' | 3.0 |
| 2 ⋯ | 20.74 ± 0.05 | −0.02 ± 0.07 | 7'' | 0.9 |
| 3 ⋯ | 22.44 ± 0.05 | −0.02 ± 0.07 | 4'' | 0.9 |
| 4 ⋯ | 21.88 ± 0.05 | −0.02 ± 0.07 | 4'' | 0.9 |
| 5 ⋯ | 21.75 ± 0.05 | −0.07 ± 0.07 | 4'' | 0.56 |
| 6 ⋯ | 21.29 ± 0.05 | −0.20 ± 0.07 | 7'' | 0.34 |
Note. Numbers correspond to the labels on Figure 14. Magnitudes are corrected for atmospheric, galaxtic extinction, and k-correction.
Download table as: ASCIITypeset image
5. Implications for Galaxy Evolution
From their study of S0s in clusters ( and
and  ), D'Onofrio et al. (2015) concluded that the evidence supports the transformation of Spirals into S0s as the mechanism for the origin of S0s in clusters. However the path for the formation of the S0s observed on the present day is not unique, Deeley et al. (2020) studied the stellar and gas kinematics of 219 S0s in the SAMI Survey and concluded from their results that there are two main mechanisms for this transformation: disk fading Spirals or Spiral galaxy mergers; with the former dominating in isolated galaxies and galaxy groups, and the latter in large groups. On the other hand, Borlaff et al. (2014) and Head et al. (2014) found that disk fading would be the dominant process for S0s in the Coma cluster, ruling out major mergers. A similar conclusion was reached by Hudson et al. (2010), after investigating 922 galaxies in eight nearby clusters (
 ).
).
Although NGC 6845 is a small, compact group, the ( ) colors are consistent with the values found in previous studies for S0s in clusters, as shown above. The S0s in NGC 6845 are mostly devoided of star formation (absent in galaxy C, very weak in galaxy D), suggesting a plausible scenario where the two S0 galaxies have been stripped from their gas and thus quenched the star formation–this occurring earlier for galaxy C. Further support comes from the bluer material outside the galaxies on the tail-shaped structures joining galaxy C with A. The estimation of the ages of these structures revealed that they formed much before (0.1–1 Gyr ago) than the H ii regions on the tail joining galaxies A and B, pointing to an early stage of the interaction and consistent with the deprivation of gas from galaxies D and C. Note that the age of the dwarf galaxy (region 1) estimated above is consistent with the age of the collision—reinforcing the scenario of its formation on a first stage of the group interaction.
According to our bulge/disk decomposition, the photometric bulge/total ratio on the i' band is 0.41 for galaxy C, whereas it is 0.23 for galaxy D. This is consistent with galaxy C being closer to typical S0s. The observed kinematics of galaxy C is consistent with a fast rotator ( ). It was mentioned also that galaxy C is as massive as a present-day spiral, yet smaller in size. This is also consistent with the findings of D'Onofrio et al. (2015) at low z.
The observed properties of galaxies C and D are consistent with those observed in S0s in dense environments and favor the scenario of evolution from Spiral to S0 through gas stripping. The other proposed scenario for the formation of S0s in groups involves evolution through gravitational interactions and mergers (most notably minor mergers) as the driving mechanisms (Bekki & Couch 2011; Borlaff et al. 2014). However this does not seem to be the case in NGC 6845. Although there is certainly interaction between all group members, mergers would have been more disruptive to the kinematics and the spiral structure in the case of galaxy C (e.g Johnston et al. 2021). We also showed that the kinematics of both galaxies C and D are consistent with fast rotators. Furthermore, after subtracting from the GMOS image the bulge+disk model components computed from GALFIT, a regular spiral arms pattern is evidenced (see Figure 16), thus strengthening the case for the fading spiral originating an S0.

Figure 16. NGC 6845 C i' image after subtraction of the GALFIT bulge+disk model components. In this way a clear spiral arm pattern is recovered.
Download figure:
Standard image High-resolution image
6. Conclusions
We presented results from GMOS-S imaging and spectroscopy of early-type galaxies in the nearby compact group NGC 6845. From these observations, the surface brightness distribution, stellar rotation curves, and velocity dispersions along the major axes were derived. From the imaging and spectroscopy results, the mass distributions were derived, based on self-consistent models. The stellar rotation and velocity dispersion curves show an overall regularity, despite the morphological signs of interaction between the group member galaxies. In particular, in the case of galaxy D, there is some hint of asymmetry in the rotation curve possibly due to interaction with galaxy C. Previous work had minimized the importance of galaxies C and D in the evolution of the group; however, we have shown that there is evidence for interaction from the observed morphology of the outer regions and the internal kinematics of galaxy D. The results presented here–taken together with previous ones–are consistent with an overall scenario that points to an early stage of the group interaction and also to the possibility that it has still not reached virial equilibrium.
From the perspective of galaxy evolution, this group features a robust example of the transformation of Spirals into S0s occurring in the dense environment of compact groups: NGC 6845 C is a rotationally supported galaxy, well represented by bulge+disk components with a bulge/total ratio compatible to that of typical S0s, mostly devoid of gas, and yet showing a faded spiral arm pattern. Neither of the two galaxies studied here is actively star forming, with the last "recent" star formation episode occurring earlier than 15 Myr ago. The blue stellar condensations are consistent with the deprivation of gas from the S0s at a much earlier stage for the interaction (∼300 Myr ago). The analysis of the stellar structures on the tidal bridge joining galaxies D with A and C further supports this scenario.
More generally and taken together with the outcome of previous studies, our results suggest that the local density is the dominant driver on the transition from a spiral to a S0 galaxy via disk fading, regardless of the group or cluster size or mass. However, more studies of S0s in compact groups and small groups are needed to investigate this further.
We are grateful to the anonymous reviewer, whose comments and suggestions helped to improve the manuscript. Based on observations obtained at the international Gemini Observatory, a program of NSFÕs NOIRLab, which is managed by the Association of Universities for Research in Astronomy (AURA) under a cooperative agreement with the National Science Foundation on behalf of the Gemini Observatory partnership: the National Science Foundation (United States), National Research Council (Canada), Agencia Nacional de Investigación y Desarrollo (Chile), Ministerio de Ciencia, Tecnología e Innovación (Argentina), Ministério da Ciência, Tecnologia, Inovações e Comunicações (Brazil), and Korea Astronomy and Space Science Institute (Republic of Korea). Data acquired under programs GS-2009B-Q-81, GS-2012A-Q-72, GS-2012A-SV-201, and GS-2014B-SV-153, and processed using the Gemini IRAF package. IRAF is distributed by the National Optical Astronomy Observatories, which are operated by the Association of Universities for Research in Astronomy, Inc., under cooperative agreement with the National Science Foundation.
Appendix: The Galaxy Models
In order to describe the mass distribution of the individual galaxies, analytical models were built based on Satoh (1980) potential-density pairs for axisymmetric stellar systems. For any given component:

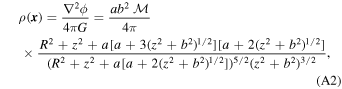
where  , G is the gravitational constant,
  is the total mass, and
  are the two model lengthscale parameters. These allow to reproduce a wide range of morphologies, from spherical galaxies to very flattened disk galaxies. For a given galaxy, the total potential and density are built by a linear superposition of terms of the form (A1) and (A2), respectively. From the Jeans equations, the relevant derived quantities are the velocity dispersion (assuming isotropy),
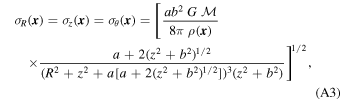
the mean rotational velocity,

However, the quantities to be compared with observations are the projected, integrated along the line of sight: the surface density

the mean projected rotational velocity

and the projected velocity dispersion
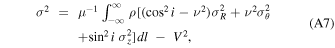
where

and (X, Y, l) are cartesian coordinates with X, Y on the plane of the sky (X along the projected major axis, l along the line of sight; Satoh 1980).
The integrals involved in the projected quantities were computed numerically via Romberg integration (Press et al. 1992). In general, two component models were adopted (one for the bulge and another for the disk).
Footnotes
- 7
- 8