


Abstract
The large time span and precise observational data of natural satellites is of great significance for updating their ephemerides and studying their dynamic characteristics. With the help of the new image-processing methods and the Gaia DR2 catalog, all CCD images of Triton taken with the 1.56 m telescope of Shanghai Astronomical Observatory during 2005–2009 were reanalyzed. The median filtering algorithm is used for image preprocessing to remove the influence of the halo of Neptune, and an upgraded modified moment, called the intensity-square-weighted centroiding method, is applied to determine the centroids of the stars and Triton. A total of 2299 positions of Triton were obtained, including 263 new observed positions and 2036 updated observed positions. Such five-year time span data with high precision will be very helpful to improve the orbit parameters of Triton.
Export citation and abstract BibTeX RIS
1. Introduction
In the solar system, there are six planetary satellite systems containing more than 200 known natural satellites. The natural satellites orbiting relatively close to the planet on prograde, uninclined circular orbits are labeled as regular satellites, which are generally thought to have been formed out of the same collapsing region of the protoplanetary disk that created its primary. In contrast, irregular satellites (generally orbiting on distant, inclined, eccentric, and/or retrograde orbits) are thought to be captured asteroids possibly further fragmented by collisions (Agnor & Hamilton 2006; Rufu & Canup 2017). Natural satellites of planets in the solar system retain some traces of early formation of the solar system, so they are widely used to explore the origin and evolution of the solar system and life, thus they have become the main targets of many deep space exploration projects.
As an irregular satellite of Neptune, Triton has many special characteristics, such as large mass, retrograde orbit, surface temperature as low as −235°C (38 K), and frequent surface activities (Smith et al. 1989), which indicate there may be an underground ocean of liquid nitrogen (Hussmann et al. 2006). Observations of the Hubble Space Telescope (HST) have verified that it has a global warming trend (Elliot et al. 1998). All of these results made Triton still an interesting research target today. Besides space observations, ground-based observations are very useful for research of Triton. Desmars et al. (2009) has shown that astrometric data spread over a large time span were better than more accurate astrometric data spread over a short interval of time for dynamical and ephemerides purposes. Since 1996, we have started regular observation on Triton with optical telescopes equipped with CCD cameras (Qiao et al. 2007, 2014), and improved its orbital parameters based on data from our observations and other authors (Jacobson 2009; Zhang et al. 2014; Emelyanov & Samorodov 2015; Tang et al. 2020). The Second US Naval Observatory CCD Astrograph Catalog (UCAC2; Zacharias et al. 2004) has been used as the reference catalog to calculate positions of Triton before 2018.
In 2018 April, ESA released the second version of the Gaia catalog, Gaia DR2. This catalog not only contains high-precision positions, but also contains the precise parallax and proper motion of stars (Gaia Collaboration et al. 2016a, 2016b, 2017, 2018). Many studies have confirmed that the Gaia DR2 catalog can greatly improve the accuracy of the positions of natural satellites (Arlot et al. 2012; Wang et al. 2017; Yu et al. 2019; Yan et al. 2020). To get more positions with higher precision and under the frame of Gaia DR2, we reprocessed all CCD images of Triton taken during 2005–2009 based on the Gaia DR2 catalog and our upgraded image-processing programs.
The content of this paper is as follows. In Section 2, the basic information of the observation from 2005 to 2009 is introduced. In Section 3, the whole process of CCD image preprocessing and reduction are given. In Section 4, both the new and historical results are compared with the latest ephemeris of Triton, and the results are presented. Finally. In Section 5, a conclusion is given.
2. Observations
During 2005–2009, mainly in August and September, when the opposition of Neptune happened, the 1.56 m telescope located in Sheshan Station of Shanghai Astronomical Observatory (N31 096, E121184, H97m, IAU code:337) was used to continuously observe Triton and Neptune. Since our purpose is to get precise positions of Triton, to obtain a good signal-to-noise ratio (S/N) of Triton, the exposure time was set from 10 to 100 s, while the images of Neptune are overexposed, so we did not calculate the positions of Neptune. The parameters of the telescope are shown in Table 1. During the observation, no filter was used. For all observations, a binning of 2 ∗ 2 was used to increase the S/N of Triton and decrease the readout time, so the spatial resolution of the single pixel of the image is 0
 64.
64.
Table 1. Parameters of the Telescope Used for the Observation of Triton
| Tele. or CCD | Parameters |
|---|---|
| (1) | (2) |
| Diameter of primary mirror | 156 cm |
| Focal length | 15,600 mm |
| Size of CCD array (pixels) | 2112 × 2048 |
| Size of pixel | 24 μm |
| Angular resolution of pixel | 032 |
| Field of view | 11 2 × 10⁸ 2 × 10⁸ |
| Bandpass of CCD (nm) | 300–1100 |
Download table as: ASCIITypeset image
The Gaia DR2 catalog contains 1693 million sources with magnitudes of 3–21. For most sources, Gaia DR2 provides basic position information (position, parallax, and proper motion), with formal uncertainties ranging from about 0.03 to 2 mas in position and parallax, and twice that in annual proper motion, depending on the magnitude. The reference epoch used for the astrometry in Gaia DR2 is J2015.5.
With Gaia DR2 as the reference catalog, 2299 positions of Triton were recalculated by standard astrometric process. Table 2 presents an extract of the observed positions of Triton. The full table will be available at the Centre de Données astronomiques de Strasbourg (CDS) and the Institut de mécanique céleste et de calcul des éphémérides (IMCCE). Here the R.A. and decl. are in topocentric coordinates, and the time of observation is given in UTC.
Table 2. Extract of the Observed Positions of Triton
| Year | Month | Day(UTC) | α(h m s) | δ(d m s) | Site |
|---|---|---|---|---|---|
| (1) | (2) | (3) | (4) | (5) | (6) |
| 2006 | 08 | 18.572998 | 21 22 28.7961 | −15 35 52.136 | 337 |
| 2006 | 08 | 18.576759 | 21 22 28.7719 | −15 35 52.170 | 337 |
| 2006 | 08 | 18.579514 | 21 22 28.7574 | −15 35 52.219 | 337 |
| 2006 | 08 | 18.591331 | 21 22 28.6938 | −15 35 52.481 | 337 |
| 2006 | 08 | 18.595093 | 21 22 28.6736 | −15 35 52.552 | 337 |
| ⋯ | ⋯ | ⋯ | ⋯ | ⋯ | ⋯ |
Note. The whole data is available in electronic form at the CDS and IMCCE.
Only a portion of this table is shown here to demonstrate its form and content. A machine-readable version of the full table is available.
Download table as: DataTypeset image
3. Measurement and Reduction
To improve the convenience and speed of image reduction, a set of programs have been developed in the past several years. The basic functions of the programs include: CCD image preprocessing, object detection, centroiding, reference star matching, plate constant fitting, and object position calculating. After several rounds of upgrades, now the programs can automatically analysis a series of CCD images in a short amount of time. All data in this paper are processed using new versions of the programs.
3.1. Image Preprocessing
For observation of the natural satellites, the halos of the major planets usually make the background around the nearby satellite uneven. Saquet et al. (2016) and Robert et al. (2017) have used a three- or five-degree polynomial to fit the local background around the satellite and effectively removed the influence of the halo of Jupiter. Here we present a more general method to remove the influence of the halo. Median filtering is used to create a background image. The uneven background in the original CCD image will become even after being subtracted from the background image.
Typically, a two-dimensional window is used for median filtering and the value of the side length of the window depends on the characteristics of the images of the stars in the CCD frame. Generally, this value can be set as (2.5–3.0) × FWHM of the star image. When this value is large, it will decrease the speed of sorting the intensity of the pixels and slow down the speed of the image preprocessing. One-dimensional median filtering is considered for fast reduction. To compare the processing speed of the two kinds of meridian filtering, the images taken on 2006 August 24 were used as a test. Table 3 shows the results of the two-dimensional median filtering and the one-dimensional median filtering. It is shown that the time cost by the two-dimensional median filtering is about 15 times longer than that by the one-dimensional median filtering, while the positional precisions of the two methods are similar. So one-dimensional median filtering was used in this paper.
Table 3. Comparison of the Results of Different Methods with Different Filtering Windows
| Filter Choice | N | μα ('') | μδ ('') | σα ('') | σδ ('') | Time Cost |
|---|---|---|---|---|---|---|
| (1) | (2) | (3) | (4) | (5) | (6) | (7) |
| 1 ∗ 15 then 15 ∗ 1 | 86 | 0.061 | −0.049 | 0.025 | 0.023 | 1 minute 57 s |
| 15 ∗ 1 then 1 ∗ 15 | 86 | 0.059 | −0.051 | 0.025 | 0.023 | 1 minute 55 s |
| 15 ∗ 15 | 86 | 0.060 | −0.049 | 0.025 | 0.023 | 29 minute 45 s |
Note. The first column is the filtering choice used during the preprocessing. 1 ∗ 15 and 15 ∗ 1 indicates that the one-dimensional median filtering window is used, and 15 ∗ 15 indicates that the two-dimensional median filtering window is used. The second column is the number of observed images, and the latter four columns are the mean value and standard deviation of the O − C of the observed positions of Triton compared with the JPL-nep096 ephemerides. The last column is the time cost of each method.
Download table as: ASCIITypeset image
Figure 1 shows one example of the whole process of image preprocessing. In the figure, panel (a) is the original image taken by the 1.56 m telescope on 2006 August 24 with an exposure time of 40 s, without using any filter; panel (b) is the background image generated by one-dimensional median filtering; panel (c) is the image after it is preprocessed; and panel (d) is the image with the results of object detection, where the green circles are the objects detected as stars by the program and the red circles are the stars that are successfully matched to the Gaia DR2 catalog. It can be seen from the figures that the image after being subtracted from the background image is more conducive to detect objects than before. Considering the observable capability of the telescope, only stars brighter than 16 mag were selected as the reference stars. Therefore, the green circles contain false stars, nonstars, and stars darker than 16 mag.
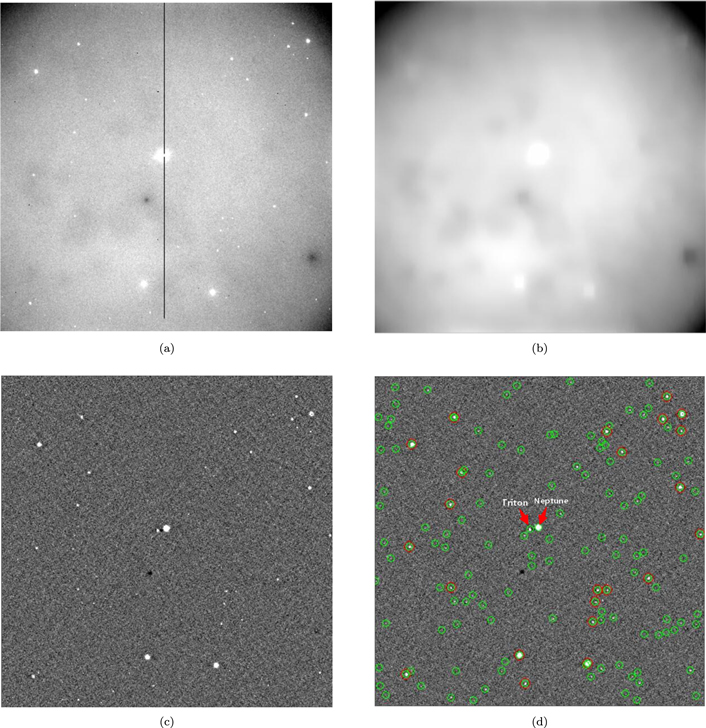
Figure 1. Example of image preprocessing. Panel (a): the original image; panel (b): the background image; panel (c): the image after it is preprocessed; and panel (d): the image with the results of object detection.
Download figure:
Standard image High-resolution image3.2. Centroiding
One of the most popular methods to calculate the center of an object in a CCD frame is the modified moment (Stone 1989), also called intensity-weighted centroiding. This method was also used in our previous image reduction. The algorithm is


In the above formula, I(x, y) is the intensity of the pixel with coordinates (x, y) in the image; T = B + s ∗ σ, where B is the average background value of the image; s is an empirical coefficient, generally 3; σ is the variance of background; and m, n are the number of rows and columns of the image, respectively.
In this paper, an upgraded modified moment, called intensity-square-weighted centroiding, was used to calculate the center of star. The algorithm is


From the equations above, it can be seen that the weight of bright pixels increased, while the weight of dark pixels, which are easily affected by noise, decreased. Experiments from examples of CCD images show that this algorithm can improve the precision of the positions of the stars.
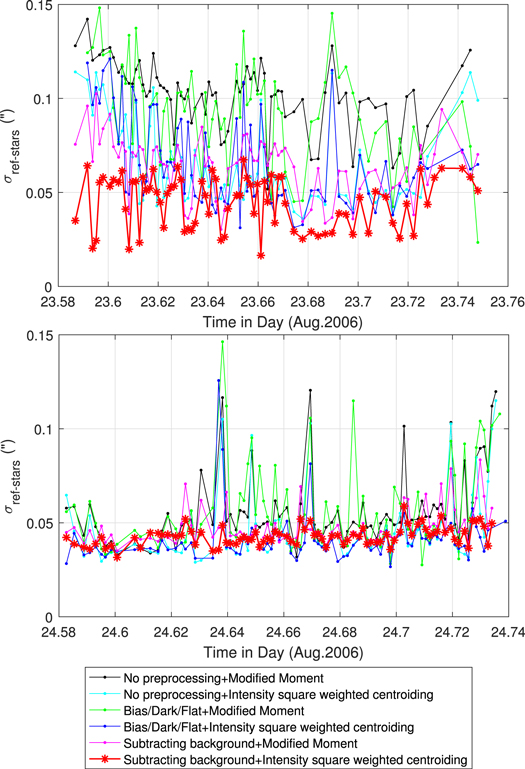
In order to clarify the improvement of image reduction by the upgraded image preprocessing and centroiding algorithm mentioned above, 164 images taken on 2006 August 23 and 24 were chosen as examples. Figure 2 shows the standard deviation of the positions of all reference stars in each CCD frame after fitting the plate constants. Considering the accuracy of the Gaia DR2 catalog is precise enough, the deviation is mainly caused by the errors of the center of the star. In Figure 2, the red curves represent the results from the methods used in this paper. It can be seen from the figure that the methods used in this paper are better than others. Figure 2 shows the results of different methods of preprocessing and centroiding. The results from the methods of subtracting background images and intensity-square-weighted centroiding are the best on both nights.
Figure 2. Standard deviations of the positions of all reference stars in each CCD frame after plate constant fitting, using different algorithms to calculate the positions of the reference stars. Top panel: results of the images taken on 2006 August 23; bottom panel: results of the images taken on 2006 August 24.
Download figure:
Standard image High-resolution image
From Figure 2, the following conclusions can be drawn: (1) no matter which centroiding algorithm is used when subtracting the background for image preprocessing, the number of effective observations will increase. (2) No matter which preprocessing method is used, the intensity-square-weighted centroiding can improve the centroiding precision of the stars. (3) Using the subtracted background image method and intensity-square-weighted centroiding together will give the best results. (4) According to the comprehensive statistics of the positional error of the reference stars, the average positional error of the reference stars of 164 CCD frames in two nights is 0043. The spatial resolution of the single pixel of the observed image is 064, so the centroiding precision is better than 1/14 pixels.
3.3. Cross-matching Reference Catalogs
The triangular arc-length matching method was used in our old programs for processing CCD images, which can work well without any prior information, but it has the disadvantages of a low matching success rate and low speed. On the other hand, after the reference stars are successfully matched, it is necessary to use another program to confirm the measurement coordinates of the target, which will limit the programs's automation. For the observation of natural satellites, there is enough prior information, especially the predicted positions of the targets from the ephemerides. The new program used in this paper makes full use of the ephemeris information (time and position).
Now the new version of the program can automatically carry out the following steps to calculate positions of Triton: (1) the corresponding position of the target is extracted at the observational epoch from the ephemerides and it is used as the pointing direction of the telescope, i.e., they are taken as (α0, δ0) when calculating the standard coordinates. (2) The linear models are used to solve the plate constants and it is assumed that the rotational angle between the axis of the measurement coordinates and that of the standard coordinates is zero degrees, i.e., plate constants are (1 0 0) and (0 1 0); then the R.A. and decl. of all of the detected stars are calculated and are matched with the reference catalog. If the number of matching stars is less than three and the sigma of the residuals of the plate constant fitting is bigger than 03, then a step is added (usually 3 degrees) to the rotational angle, and the same routine is run again until the matching result satisfies the set conditions. (3) All of the matched reference stars obtained in last step can be used to fit the plate constants of the CCD frame. (4) The position of Triton is calculated and compared with the ephemeris.
4. Comparison with Historical Results
Observation data from natural satellites is extremely important for the improvement of their ephemeris. With the improvement of observation technology, the accumulation of observation data, and new orbit models, the orbits of natural satellites have been greatly improved. Through previous papers (Qiao et al. 2014; Wang et al. 2017; Yu et al. 2019; Yan et al. 2020), we can also see that the new ephemeris matches the observation data better. The aim of this paper is to reprocess the historical observation data based on the new image-processing methods and the Gaia DR2 catalog to illustrate the effectiveness of this data processing, and to provide higher-precision observation data for subsequent orbit improvement. In this paper, we compare the historical observation data and the newly processed results with the latest Triton ephemeris.
This batch of observational data covers part of previously published results by Qiao et al. (2007, 2014) and Yan et al. (2020). The first two papers dealt with two series of data during 1996–2006 and 2007–2009, respectively, that used UCAC2 as a reference catalog. And these data were used many times in subsequent ephemerides improvement papers (Jacobson 2009; Zhang et al. 2014; Emelyanov & Samorodov 2015; Tang et al. 2020). After the Gaia DR2 catalog was released, Yan et al. (2020) reprocessed the images taken during 1996–2006 with the Gaia DR2 catalog as a reference, and the number of effective observations and the precision of the positions were improved and it was pointed out that the UCAC2 catalog was the main reason for the deviation of the previous data (Qiao et al. 2007). In this paper, we upgraded the CCD image-processing program. Combined with the use of the Gaia DR2 catalog, these images are reprocessed again. Table 4 shows the results of these three batches of positioning data compared with the ephemeris of DE431-nep096, respectively. DE431-nep096 is the latest ephemeris of Triton.
Table 4. Comparison among Three Series of Positions of Triton
| Mission | Date | N | μα ('') | μδ ('') | σα ('') | σδ ('') | N | μα ('') | μδ ('') | σα ('') | σδ ('') | N | μα ('') | μδ ('') | σα ('') | σδ ('') |
|---|---|---|---|---|---|---|---|---|---|---|---|---|---|---|---|---|
| (1) | (2) | (3) | (4) | (5) | (6) | (7) | (8) | (9) | (10) | (11) | (12) | (13) | (14) | (15) | (16) | (17) |
| 200509 | 20050905 | 25 | −0.033 | 0.054 | 0.100 | 0.087 | 34 | 0.027 | −0.043 | 0.076 | 0.073 | 34 | −0.039 | −0.032 | 0.051 | 0.062 |
| 200608 | 20060818 | 40 | 0.051 | −0.024 | 0.065 | 0.041 | 40 | 0.015 | −0.038 | 0.043 | 0.032 | 40 | −0.005 | −0.013 | 0.031 | 0.032 |
| 20060819 | 49 | 0.040 | −0.008 | 0.029 | 0.023 | 51 | 0.007 | −0.031 | 0.031 | 0.022 | 51 | 0.004 | −0.032 | 0.022 | 0.021 | |
| 20060820 | 20 | 0.025 | 0.029 | 0.028 | 0.027 | 20 | −0.016 | −0.001 | 0.026 | 0.022 | 20 | −0.021 | 0.002 | 0.019 | 0.022 | |
| 20060821 | 24 | 0.072 | 0.018 | 0.065 | 0.039 | 27 | −0.004 | −0.037 | 0.058 | 0.035 | 28 | 0.021 | −0.025 | 0.052 | 0.048 | |
| 20060822 | 50 | 0.106 | 0.004 | 0.040 | 0.032 | 54 | 0.002 | −0.039 | 0.044 | 0.031 | 56 | 0.042 | −0.041 | 0.034 | 0.026 | |
| 20060823 | 77 | 0.107 | −0.042 | 0.038 | 0.032 | 78 | −0.012 | −0.013 | 0.042 | 0.027 | 78 | 0.015 | −0.049 | 0.030 | 0.025 | |
| 20060824 | 84 | 0.140 | −0.029 | 0.029 | 0.035 | 88 | 0.039 | −0.032 | 0.040 | 0.026 | 86 | 0.064 | −0.049 | 0.025 | 0.023 | |
| 20060825 | 43 | 0.112 | −0.062 | 0.049 | 0.053 | 43 | 0.033 | −0.049 | 0.062 | 0.048 | 40 | 0.042 | −0.063 | 0.029 | 0.030 | |
| 200609 | 20060918 | 52 | 0.040 | 0.032 | 0.040 | 0.027 | 58 | 0.003 | −0.026 | 0.034 | 0.026 | 56 | 0.002 | −0.026 | 0.026 | 0.023 |
| 20060919 | 71 | 0.104 | 0.010 | 0.035 | 0.031 | 72 | 0.023 | −0.018 | 0.038 | 0.031 | 73 | 0.051 | −0.029 | 0.031 | 0.030 | |
| 20060920 | 55 | 0.074 | 0.027 | 0.021 | 0.022 | 58 | 0.005 | −0.020 | 0.029 | 0.021 | 57 | 0.018 | −0.025 | 0.017 | 0.016 | |
| 20060921 | 54 | 0.091 | 0.004 | 0.025 | 0.015 | 56 | 0.017 | −0.017 | 0.035 | 0.019 | 57 | 0.031 | −0.027 | 0.029 | 0.018 | |
| 20060922 | 63 | 0.123 | −0.002 | 0.035 | 0.032 | 66 | 0.055 | −0.017 | 0.026 | 0.026 | 65 | 0.060 | −0.028 | 0.019 | 0.022 | |
| 20060923 | 90 | 0.115 | −0.027 | 0.023 | 0.020 | 90 | 0.031 | −0.018 | 0.022 | 0.019 | 90 | 0.042 | −0.031 | 0.014 | 0.018 | |
| 20060925 | 50 | 0.113 | −0.030 | 0.031 | 0.021 | 54 | 0.032 | −0.027 | 0.041 | 0.017 | 56 | 0.028 | −0.026 | 0.031 | 0.026 | |
| 20060926 | 32 | 0.062 | −0.022 | 0.045 | 0.024 | 37 | 0.051 | −0.040 | 0.046 | 0.027 | 37 | 0.054 | −0.039 | 0.033 | 0.025 | |
| 20060927 | 58 | 0.037 | 0.001 | 0.066 | 0.035 | 59 | 0.019 | −0.023 | 0.028 | 0.018 | 60 | 0.030 | −0.025 | 0.014 | 0.016 | |
| 200708 | 20070810 | 38 | 0.041 | −0.039 | 0.044 | 0.050 | 65 | 0.025 | −0.011 | 0.041 | 0.060 | |||||
| 20070813 | 116 | 0.041 | 0.007 | 0.037 | 0.040 | 123 | 0.004 | 0.010 | 0.030 | 0.033 | ||||||
| 20070815 | 91 | 0.042 | −0.022 | 0.052 | 0.053 | 107 | 0.015 | 0.000 | 0.048 | 0.045 | ||||||
| 20070816 | 89 | 0.042 | −0.003 | 0.037 | 0.058 | 140 | 0.048 | 0.012 | 0.054 | 0.075 | ||||||
| 20070818 | 4 | 0.059 | −0.011 | 0.062 | 0.072 | 22 | 0.057 | 0.036 | 0.068 | 0.094 | ||||||
| 20070819 | 2 | −0.064 | 0.014 | 0.043 | 0.009 | 16 | 0.022 | −0.014 | 0.067 | 0.066 | ||||||
| 20070820 | 87 | 0.059 | −0.043 | 0.039 | 0.041 | 109 | 0.048 | −0.021 | 0.044 | 0.047 | ||||||
| 20070823 | 2 | 0.055 | −0.048 | 0.026 | 0.037 | 5 | −0.019 | −0.031 | 0.044 | 0.053 | ||||||
| 200709 | 20070909 | 19 | 0.112 | −0.098 | 0.030 | 0.025 | 29 | 0.079 | −0.006 | 0.024 | 0.029 | |||||
| 20070910 | 12 | 0.090 | −0.111 | 0.035 | 0.029 | 16 | 0.020 | 0.024 | 0.030 | 0.035 | ||||||
| 20070911 | 23 | 0.046 | −0.050 | 0.034 | 0.024 | 25 | −0.008 | 0.040 | 0.022 | 0.033 | ||||||
| 20070912 | 27 | 0.050 | −0.047 | 0.043 | 0.038 | 30 | 0.012 | 0.025 | 0.033 | 0.030 | ||||||
| 20070913 | 18 | 0.059 | −0.054 | 0.037 | 0.050 | 10 | 0.026 | −0.008 | 0.048 | 0.038 | ||||||
| 20070915 | 39 | 0.024 | −0.008 | 0.047 | 0.056 | 48 | 0.004 | 0.017 | 0.035 | 0.050 | ||||||
| 20070916 | 45 | 0.043 | −0.028 | 0.039 | 0.037 | 46 | 0.028 | 0.009 | 0.026 | 0.028 | ||||||
| 200808 | 20080803 | 7 | −0.015 | −0.061 | 0.092 | 0.064 | 12 | 0.020 | −0.068 | 0.092 | 0.056 | |||||
| 20080804 | 11 | −0.079 | −0.092 | 0.049 | 0.028 | 23 | −0.009 | −0.010 | 0.063 | 0.058 | ||||||
| 20080806 | 23 | −0.043 | −0.065 | 0.054 | 0.038 | 44 | 0.027 | −0.018 | 0.055 | 0.052 | ||||||
| 20080807 | 14 | −0.059 | −0.052 | 0.047 | 0.055 | 39 | 0.033 | −0.034 | 0.069 | 0.043 | ||||||
| 20080808 | 15 | −0.038 | −0.039 | 0.044 | 0.066 | 25 | 0.076 | −0.032 | 0.046 | 0.054 | ||||||
| 20080809 | 18 | −0.039 | −0.022 | 0.054 | 0.047 | 33 | 0.029 | 0.025 | 0.045 | 0.057 | ||||||
| 20080810 | 21 | −0.037 | −0.077 | 0.053 | 0.035 | 28 | 0.071 | −0.030 | 0.052 | 0.030 | ||||||
| 200809 | 20080901 | 4 | 0.097 | −0.071 | 0.021 | 0.033 | 6 | 0.065 | −0.057 | 0.063 | 0.071 | |||||
| 20080902 | 2 | −0.025 | −0.061 | 0.120 | 0.013 | 19 | 0.037 | −0.053 | 0.066 | 0.063 | ||||||
| 20080903 | 2 | −0.070 | −0.043 | 0.071 | 0.075 | 16 | 0.104 | 0.006 | 0.065 | 0.088 | ||||||
| 20080907 | 21 | −0.028 | −0.053 | 0.061 | 0.061 | 33 | 0.045 | −0.032 | 0.068 | 0.047 | ||||||
| 20080908 | 19 | −0.023 | −0.040 | 0.061 | 0.045 | 23 | 0.026 | −0.010 | 0.042 | 0.050 | ||||||
| 20080909 | 41 | −0.027 | −0.000 | 0.065 | 0.044 | 46 | 0.029 | 0.003 | 0.054 | 0.043 | ||||||
| 20080910 | 13 | −0.002 | 0.0035 | 0.058 | 0.042 | 24 | 0.052 | 0.026 | 0.069 | 0.068 | ||||||
| 200908 | 20090817 | 37 | 0.036 | −0.028 | 0.045 | 0.044 | 48 | −0.058 | −0.052 | 0.050 | 0.027 | |||||
| 20090818 | 18 | 0.007 | −0.079 | 0.066 | 0.039 | 17 | 0.110 | 0.005 | 0.059 | 0.024 | ||||||
| 20090819 | 34 | 0.026 | −0.016 | 0.059 | 0.036 | 41 | −0.014 | −0.012 | 0.055 | 0.022 | ||||||
| 20090820 | 44 | 0.076 | −0.038 | 0.032 | 0.034 | 47 | 0.017 | −0.054 | 0.032 | 0.029 |
Note. The columns (3) to (7) are results from Qiao et al. (2014, 2007), columns (8) to (12) are results from Yan et al. (2020), and columns (13) to (17) are results from this paper. For each part, the mean value μ('') and standard deviations σ('') are calculated from O − C. C is the ephemerides based on DE431 and nep096. N is the number of effective observations obtained in that night.
The 2005–2006 data has been processed three times. The first time was obtained with UCAC2 as the reference and astrometric software for image processing by Qiao et al. (2007), and the second time was obtained with the Gaia DR2 catalog as the reference and our old image-processing programs by Yan et al. (2020), while the third time was obtained in this paper. By comparing the observed data in 2005–2006, obtained by the three times, it can be found that the number of effective observations and the precision of the last two times are much better than those of the first time, which is mainly due to the use of the Gaia DR2 catalog. The difference between the results of Yan et al. (2020) and this paper is mainly caused by the usage of the upgraded image -preprocessing algorithm and centroiding algorithm. From the table, it can be found clearly that the results in this paper are more accurate, especially in the direction of R.A. For the reprocessing of observational data during 2007–2009, on the basis of the UCAC2 catalog and our old version of the image-processing program, a large number of images failed to obtain the Triton position because the number of reference stars was insufficient or the Triton image could not be detected (Qiao et al. 2014). And in this paper, because of the use of the Gaia DR2 catalog, the new image-preprocessing algorithm, and the star centroiding algorithm, more stars are detected, so we get a total of 1358 positions of Triton, which is nearly 25% more than the previous paper (Qiao et al. 2014).
5. Conclusion
We present new 2299 positions of Triton during 2005–2009, which are available in electronic form at the CDS and IMCCE. All images were taken with the 1.56 m telescope at Sheshan Station of the Shanghai Astronomical Observatory. With the Gaia DR2 catalog as the reference and upgraded CCD image-processing programs, positions of Triton were improved significantly. The upgraded CCD image-processing programs will be used in the processing of images of other natural satellites, especially those close to the major planets, such as Uranus and Saturn. It can be expected that these five-year time span data will be valuable for future improvements of the knowledge of Triton, especially for its orbital parameters. In the future, we plan to do more regular observations on Triton by more telescopes.
This work has made use of data from the European Space Agency (ESA) mission Gaia (https://www.cosmos.esa.int/gaia), processed by the Gaia Data Processing and Analysis Consortium (DPAC, https://www.cosmos.esa.int/web/gaia/dpac/consortium). Funding for the DPAC has been provided by national institutions, in particular the institutions participating in the Gaia Multilateral Agreement. We acknowledge the support of the staff of the Sheshan Station who work on 1.56 m telescope. This work was carried out with the financial support of the National Science Foundation of China (grant Nos. 11803019, 12073062, and 11703007).