


Abstract
Spectroscopic orbits of main-sequence stars HIP 3150A, 6873B, 11537A, 22531A, 22534B, 31089B, 49336A, 104833C, and 107731A belonging to eight multiple systems are determined from high-resolution spectra taken with CHIRON. Two of those are twins with mass ratios above 0.95. HIP 11537 is a young three-tier quadruple system with inner periods of 22.3 and 1146 days and the outer period of 3 kyr. HIP 22531 (ι Pic) is the brightest star in a hierarchical system with six components. It is a spectroscopic binary with periods of 1.56 days and 2.75 yr, as well as a γ Dor variable with a period of 0.67 day, possibly in a 7:3 resonance with the inner orbit. HIP 22534, also member of this system, is a double-lined binary with a period of 208 days. For HIP 31089, both the spectro-interferometric 32 yr outer orbit and the 213 day orbit of the subsystem are determined. HIP 107731 is a triple system with an inner period of 470 days and a fast spatial motion, likely metal-poor. New orbits contribute to the statistics of hierarchical multiplicity in the solar neighborhood.
Export citation and abstract BibTeX RIS
1. Introduction
Statistical studies of the architecture of hierarchical stellar systems are useful as a constraint on theories of their formation and dynamical evolution (e.g., Hamers 2019). Even in the solar neighborhood, there are many hierarchies where the existence of inner subsystems is established but their orbits remain unknown. To fill this lacuna, I monitor radial velocities (RVs) and compute orbits. This paper continues the series of publications that describe goals of this program and report its results (Tokovinin 2016a, 2016b, 2018b, 2018c, 2019a, 2019b). The first papers of this series covered mostly short-period subsystems. Accumulation of RV measurements for six years, from 2014 to 2020, allows calculation of longer orbital periods. New orbits augment the collection of data on known hierarchies in the Multiple Star Catalog (Tokovinin 2018a).
Hierarchical systems studied here are listed in Table 1. The data are collected from Simbad and Gaia DR2 (Gaia Collaboration et al. 2016), the RVs are mostly determined here. The first column gives the Washington Double Star (WDS; Mason et al. 2001) code based on the J2000 coordinates. The HIP and HD identifiers, spectral types, and photometric and astrometric data refer either to the individual stars or to the unresolved subsystems.
Table 1. Basic Parameters of Observed Multiple Systems
| WDS | Comp. | HIP | HD | Spectral | V | V − K |

|
μδ | RV | ϖa |
|---|---|---|---|---|---|---|---|---|---|---|
| (J2000) | type | (mag) | (mag) | (mas yr−1) | (km s−1) | (mas) | ||||
| 00400 + 1016 | A | 3150 | 3714 | G5 | 8.71 | 1.76 | −43 | −82 | −19.9 | 5.98 |
| B | ... | ... | ... | 12.50 | 2.24 | −43 | −82 | ... | 5.99 | |
| 01284 + 0758 | A | 6868 | 8949 | K1III | 6.21 | 2.18 | 113 | −8 | 2.6 | 8.38 |
| B | 6873 | 8956 | F8IV-V | 8.04 | 1.36 | 114 | −6 | 5.7 | 8.3: | |
| 02287−3114 | A | 11537 | 15478 | G5V | 9.45 | 2.20 | 97 | −12 | 6.8 | 13.7: |
| B | ... | ... | ... | 14.61 | 3.88 | 86 | −38 | ... | 14.96 | |
| 04509–5328 | A | 22531 | 31203 | F0V | 5.23 | 0.43 | −99 | 66 | 12.6 | 24.9: |
| B | 22534 | 31204 | F4V | 6.19 | 1.00 | −81 | 86 | 9.3 | 25.66 | |
| C | 22562 | 31261 | K2V | 9.01 | 2.06 | −82 | 84 | 10.8 | 26.31 | |
| 06314 + 0749 | AB | 31089 | 46055 | G5? | 8.28 | 1.53 | 31 | −2 | 13.3 | 15.1: |
| 10043−2823 | AB | 49336 | 87416 | F6V | 7.29 | 1.19 | −37 | −24 | −13.3 | 10.07 |
| 21143−3835 | AB | 104835 | 201991 | F2 | 8.38 | 1.16 | −22 | −21 | −7.6 | ... |
| C | 104833 | ... | F2 | 9.48 | 1.12 | −7 | −13 | −7.1 | 4.83 | |
| 21494−4759 | A | 107731 | 207314 | G1V? | 8.64 | 1.69 | −93 | −352 | 68.1 | 14.3: |
| B | ... | ... | ... | 14.55 | 4.01 | −99 | −357 | 74.9: | 15.68 | |
Note.
aPMs and parallaxes are from the Gaia DR2 (Gaia Collaboration et al. 2016).Download table as: ASCIITypeset image
This paper is organized similarly to the previous ones. The data and methods are briefly outlined in Section 2, where the orbital elements are also given. Then each system is discussed in Section 3. The paper closes with a short summary in Section 4.
2. Observations and Data Analysis
2.1. Spectroscopic Observations
The spectra used here were taken with the 1.5 m telescope sited at the Cerro Tololo Inter-American Observatory (CTIO) in Chile and operated by the Small and Moderate Aperture Research Telescopes System (SMARTS) Consortium.2 Twenty hours of observing time were allocated to this program per semester. Observations were made with the CHIRON optical echelle spectrograph (Tokovinin et al. 2013) by the telescope operators in service mode. The RVs are determined from the cross-correlation function (CCF) of echelle orders with the binary mask based on the solar spectrum, as detailed in Tokovinin (2016a). The RVs derived by this method should be on the absolute scale; a small offset of +0.15 km s−1 relative to the established RV standards was found in Tokovinin (2018b); it is not applied to the RVs given here. The RV errors depend on several factors such as the width and contrast of the CCF dip, presence of other dips, and signal-to-noise ratio. The rms residuals from the orbits can be as low as 0.007 km s−1, but typically are between 0.1 and 0.5 km s−1 for the systems studied here. I assign the RV errors (hence weights) to match roughly the residuals, with larger errors assigned to blended or noisy dips.
The width of the CCF dip is related to the projected rotation velocity V sin i, while its area depends on the spectral type, metallicity, and, for blended spectra of several stars, on the relative flux. Table 2 lists average parameters of the Gaussian curves fitted to the CCF dips. It gives the number of averaged measurements N (blended CCFs were ignored), the dip amplitude a, its dispersion σ, the product aσ proportional to the dip area (hence to the relative flux), and the projected rotation velocity V sin i, estimated from σ by the approximate formula given in Tokovinin (2016a) and valid for σ < 12 km s−1. The last column indicates the presence or absence of the lithium 6708 Å line in individual components.
Table 2. CCF Parameters
| HIP | Comp. | N | a | σ | a σ |

|
Li |
|---|---|---|---|---|---|---|---|
| (km s−1) | (km s−1) | (km s−1) | 6708 Å | ||||
| 3150 | Aa | 12 | 0.210 | 3.511 | 0.736 | 1.6 | N |
| 3150 | Ab | 12 | 0.164 | 4.449 | 0.729 | 5.2 | N |
| 6873 | Ba | 10 | 0.153 | 5.216 | 0.795 | 7.1 | N |
| 6873 | Bb | 10 | 0.116 | 4.823 | 0.558 | 6.2 | N |
| 11537 | Aa | 19 | 0.388 | 3.584 | 1.392 | 2.0 | Y |
| 11537 | Ab | 19 | 0.029 | 4.851 | 0.140 | 6.2 | ... |
| 22531 | Aa | 19 | 0.046 | 14.474 | 0.665 | 25.3: | N |
| 22534 | Ba | 18 | 0.076 | 12.043 | 0.919 | 20.8: | N |
| 22534 | Bb | 18 | 0.030 | 3.843 | 0.115 | 3.2 | N |
| 22562 | C | 1 | 0.503 | 3.985 | 2.006 | 3.7 | N |
| 31089 | Aa | 7 | 0.212 | 3.464 | 0.734 | 1.2 | Y |
| 31089 | B | 7 | 0.170 | 3.454 | 0.587 | 1.1 | Y? |
| 49336 | Aa | 12 | 0.112 | 4.091 | 0.458 | 4.1 | N |
| 49336 | Ab | 12 | 0.027 | 6.900 | 0.185 | 10.8 | N |
| 49336 | B | 12 | 0.086 | 5.876 | 0.505 | 8.6 | N |
| 104835 | AB | 3 | 0.182 | 6.321 | 1.148 | 9.6 | N |
| 104833 | Ca | 12 | 0.057 | 15.133 | 0.857 | 26.5: | N |
| 107731 | Aa | 13 | 0.270 | 3.386 | 0.916 | 0.0 | N |
| 107731 | Ab | 13 | 0.037 | 3.752 | 0.140 | 2.9 | ... |
Download table as: ASCIITypeset image
2.2. Orbit Calculation
As in the previous papers of this series, orbital elements and their errors were determined by the least-squares fits with weights inversely proportional to the square of adopted errors. The IDL code orbit3
was used (Tokovinin 2016c). It can fit spectroscopic, visual, or combined visual/spectroscopic orbits. The elements of spectroscopic orbits are given in Table 3 in standard notation. Its last column contains the masses  for double-lined binaries. For single-lined systems, the mass of the primary star (listed with colons) is estimated from its absolute V magnitude, and the minimum mass of the secondary that corresponds to the 90° inclination is derived from the orbit. Table 4, published in full electronically, provides individual RVs. The Hipparcos number of the primary star and the system identifier (components joined by comma) in the first two columns define the pair, then follow the Julian date, the RV, its adopted error σ (blended CCF dips are assigned large errors), and the residual to the orbit (O − C). The last column specifies to which component this RV refers ("a" for the primary, "b" for the secondary, "c" for the tertiary). The RVs of other visual components are provided, for completeness, in Table 5. It contains the HIP number, the component letter, the Julian date, and the RV.
Table 3. Spectroscopic Orbits
| HIP | System | P | T | e | ωA | K1 | K2 | γ | rms1,2 |

|
|---|---|---|---|---|---|---|---|---|---|---|
| (day) | (JD +2,400,000) | (deg) | (km s−1) | (km s−1) | (km s−1) | (km s−1) | ( ) ) |
|||
| 3150 | Aa,Ab | 172.498 | 58435.61 | 0.182 | 4.7 | 24.981 | 25.405 | −19.920 | 0.07 | 1.09 |
| ±0.048 | ±0.27 | ±0.002 | ±0.4 | ±0.046 | ±0.046 | ±0.022 | 0.09 | 1.08 | ||
| 6873 | Ba1,Ba2 | 115.6091 | 58728.303 | 0.6505 | 316.66 | 30.213 | 31.784 | 5.739 | 0.15 | 0.65 |
| ±0.0005 | ±0.026 | ±0.0018 | ±0.21 | ±0.111 | ±0.151 | ±0.039 | 0.28 | 0.62 | ||
| 11537 | Aa,Ab | 22.26112 | 58380.377 | 0.1098 | 261.4 | 17.893 | 26.071 | ... | 0.09 | 0.11 |
| ±0.00004 | ±0.063 | ±0.0015 | ±1.0 | ±0.027 | ±0.176 | ... | 0.80 | 0.08 | ||
| 11537 | Aab,Ac | 1146.44 | 57684.7 | 0.364 | 350.9 | 6.177 | ... | 6.814 | ... | 1.63: |
| ±1.31 | ±11.1 | ±0.010 | ±0.4 | ±0.207 | ±0.176 | ±0.032 | ... | >0.45 | ||
| 22531 | Aa,Ab | 1.56445 | 58194.2424 | 0.0 | 0.0 | 23.20 | ... | ... | 0.55 | 1.56: |
| ±0.00001 | ±0.0033 | fixed | fixed | ±0.47 | ... | ... | ... | >0.18 | ||
| 22531 | Aab,Ac | 1003 | 58875 | 0.60 | 138.8 | 3.88 | ... | 12.56 | 0.55 | 1.75: |
| ±31 | ±11 | ±0.06 | ±9.3 | ±0.33 | ... | ±0.27 | ... | >0.23 | ||
| 22534 | Ba,Bb | 208.29 | 58311.73 | 0.424 | 64.0 | 13.213 | 22.988 | 9.253 | 0.50 | 0.48 |
| ±0.31 | ±1.08 | ±0.007 | ±1.4 | ±0.182 | ±0.199 | ±0.092 | 0.70 | 0.28 | ||
| 31089 | Ba,Bb | 212.85 | 58380.39 | 0.414 | 171.0 | 6.004 | ... | ... | 0.09 | 0.96: |
| ±0.30 | ±1.42 | ±0.020 | ±2.3 | ±0.166 | ... | ... | ... | >0.42 | ||
| 31089 | A,B | 11568 | 57112.8 | 0.286 | 143.6 | 4.550 | 3.479 | 13.343 | 0.11 | 1.12 |
| ±54 | ±114 | ±0.007 | ±1.0 | ±0.490 | ±0.444 | ±0.46 | 0.09 | 1.46 | ||
| 49336 | Aa,Ab | 44.5156 | 58876.165 | 0.8294 | 90.74 | 65.400 | 80.300 | −13.279 | 0.06 | 1.37 |
| ±0.0009 | ±0.001 | ±0.0005 | ±0.04 | ±0.047 | ±0.217 | ±0.020 | 0.91 | 1.11 | ||
| 104833 | Ca,Cb | 11.3391 | 58704.0781 | 0.229 | 78.2 | 36.193 | ... | −7.085 | 0.22 | 1.35: |
| ±0.0005 | ±0.0201 | ±0.004 | ±0.7 | ±0.099 | ... | ±0.080 | >0.58 | |||
| 107731 | Aa,Ab | 469.92 | 58754.893 | 0.5667 | 85.22 | 16.311 | 22.180 | 68.051 | 0.007 | 0.89 |
| ±0.20 | ±0.054 | ±0.0002 | ±0.13 | ±0.005 | ±0.239 | ±0.016 | 0.57 | 0.65 |
Download table as: ASCIITypeset image
Table 4. RVs and Residuals (Fragment)
| HIP | System | Date | RV | σ | (O − C) | Comp. |
|---|---|---|---|---|---|---|
| (JD +2,400,000) | (km s−1) | |||||
| 3150 | Aa,Ab | 57985.7632 | −1.25 | 0.10 | 0.06 | b |
| 3150 | Aa,Ab | 57985.7632 | −38.37 | 0.10 | 0.00 | a |
| 3150 | Aa,Ab | 57986.7950 | −38.63 | 0.10 | 0.00 | a |
| 3150 | Aa,Ab | 57986.7950 | −0.98 | 0.10 | −0.09 | b |
Only a portion of this table is shown here to demonstrate its form and content. A machine-readable version of the full table is available.
Download table as: DataTypeset image
Table 5. RVs of Other Components
| HIP | Comp. | Date | RV |
|---|---|---|---|
| (JD +2,400,000) | (km s−1) | ||
| 22562 | C | 57986.8844 | 10.771 |
| 49336 | B | 58193.6675 | −6.6: |
| 49336 | B | 58831.8635 | −10.974 |
| 49336 | B | 58837.8644 | −11.086 |
| 49336 | B | 58876.7057 | −12.052 |
| 49336 | B | 58881.8303 | −12.176 |
| 49336 | B | 58887.8585 | −12.573 |
| 49336 | B | 58888.8572 | −12.546 |
| 49336 | B | 58912.6727 | −13.146 |
| 49336 | B | 58919.6566 | −12.951 |
| 49336 | B | 58921.8169 | −13.230 |
| 104835 | AB | 57986.6558 | −7.573 |
| 104835 | AB | 58698.7170 | −7.628 |
| 104835 | AB | 58709.7297 | −7.441 |
Download table as: ASCIITypeset image
2.3. Gaia DR2 Astrometry
I used here data from the second Gaia data release, DR2 (Gaia Collaboration et al. 2016). Detection of astrometric subsystems by the difference between the short-term proper motion (PM) measured by Gaia and the long-term PM  deduced from the Gaia and Hipparcos positions was demonstrated by Brandt (2018), continuing the work by Makarov & Kaplan (2005) at a new level of accuracy. However, Gaia astrometry of multiple systems is often compromised by acceleration and/or unresolved companions. These caveats are revealed below in the discussion of individual systems. Uncertain Gaia parallaxes are marked by colons in Table 1.
3. Individual Objects
For each observed system, the corresponding figure shows a typical CCF (the Julian date and individual components are marked on the plot) together with the RV curve representing the orbit. In the RV curves, squares denote the primary component, triangles denote the secondary component, while the full and dashed lines plot the orbit. Typical error bars are smaller than the symbols. Masses of stars are estimated from absolute magnitudes, orbital periods of wide pairs from their projected separations (see Tokovinin 2018a).
3.1. HIP 3150 (Triple)
The outer 20'' visual pair PLQ 7 had been known since 1897. Despite the substantial PM of 0 1 yr−1, it remains at a fixed position. Gaia astrometry confirms that this is a bound system; its estimated period is ∼105 yr. The double-lined nature of the component A was discovered by Nordström et al. (2004). Here its orbit with a period of 172 days is determined from 12 spectra taken with CHIRON. The components Aa and Ab are nearly equal (mass ratio q = 0.983), therefore the photocentric motion caused by the subsystem is tiny and does not distort the Gaia astrometry that yields parallaxes of 5.98 ± 0.05 mas and 5.99 ± 0.04 for A and B, as well as almost identical PMs.
Twin stars Aa and Ab are located ∼1.8 mag above the main sequence in the  color–magnitude diagram (CMD), while B is right on it, corresponding to a K3V dwarf of 0.8
  . The CMD roughly matches a 4 Gyr isochrone. The stars are just starting to leave the main sequence and expand. The masses of Aa and Ab estimated from the luminosity or from the isochrone are about 1.3
  , hence the orbital inclination is
  . The semimajor axis of Aa,Ab is 5 mas, so it should not be resolvable by speckle interferometry, but could be an easy target for long-baseline interferometers. Interestingly, the projected rotational velocities of Aa and Ab are different, despite their nearly equal masses (note the wider and shallower dip of Ab in Figure 1).

Figure 1. CCF (top) and RV curve (bottom) of HIP 3150 Aa,Ab. In this and the following figures, the upper panel shows a typical CCF, with the Julian date of the observation indicated. The lower panel presents the phased RV curve where the full line and squares denote the orbit and RVs of the primary component, and the dashed line and triangles refer to the secondary component.
Download figure:
Standard image High-resolution image3.2. HIP 6868 and 6873 (Quadruple)
Two bright stars, HIP 6868 (HR 426) and HIP 6873, located at 69'' from each other, share common PM and parallax and form a wide physical pair S 398 with an estimated period of 300 kyr. Star A (HR 426) is a K1III giant. Its acceleration is compatible with zero and its RV is constant, suggesting the lack of subsystems. In contrast, the fainter star B (HIP 6873) is at least triple. It contains the 05 resolved pair Ba,Bb (YR 4) which turned by 19° in 12 yr since its discovery (as expected from the estimated period of ∼200 yr) and a double-lined subsystem Ba1,Ba2. The inner subsystem was discovered by Nordström et al. (2004). Its spectroscopic orbit with a period of 115.6041 days based on the Coravel RVs has been published by Halbwachs et al. (2012). This fact was overlooked when the star was placed on the CHIRON program, otherwise it would not be observed.
The new orbit deduced from 10 CHIRON spectra benefits from the higher spectral resolution and RV accuracy and, while being similar to the published one, differs appreciably in the mass ratio and systemic velocity. In the orbital fit, I used the subset of RVs from Halbwachs et al. (2012) where both components were resolved and applied a correction of +1 km s−1 to account for potential motion in the visual orbit. The resulting accurate elements are given in Table 3. The rms residuals of CHIRON RVs are 0.15 and 0.38 km s−1 for Ba1 and Ba2, respectively; only CHIRON RVs are plotted in Figure 2. After correction of the Coravel zero-point, there is no evidence of a systematic trend in the residuals to this orbit during the 41 yr covered by the combined data.
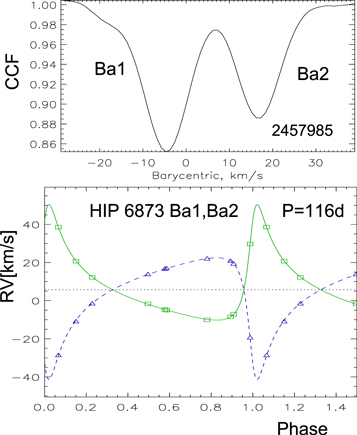
Figure 2. CCF (top) and RV curve (bottom) of HIP 6873 Ba1,Ba2.
Download figure:
Standard image High-resolution imageBa1,Ba2 is a twin pair with q = 0.95 and a semimajor axis of 5.4 mas. The components are located slightly above the main sequence in the CMD, in agreement with the subgiant spectral type F8IV-V. Comparison between estimated (1.36  ) and spectroscopic (0.65
  ) masses of Ba1 implies an inclination of
  . Some CCFs suggest the presence of a third faint dip that could be associated with Bb, but it is always blended with Ba1 and Ba2 and, at present, is simply ignored. Speckle photometry indicates that Bb is fainter than Ba by ∼3 mag.
The orbital velocity in the subsystem Ba,Bb is of the order of 10 mas yr−1 or 6 km s−1. The difference between the systemic RV of Ba, 5.74 km s−1, and the RV of A measured by Gaia, 2.57 ± 0.13 km s−1, could arise from the motion in this orbit. The astrometric acceleration of B measured by Brandt (2018), (1.1, 4.2) mas yr−1, could be of the same origin despite the long period of Ba,Bb. However, Gaia astrometry of B has large errors possibly caused by the unresolved companion Bb.
3.3. HIP 11537 (Quadruple)
This is a young quadruple system. Youth is inferred from the chromospheric activity (X-ray source) and the presence of lithium (Torres et al. 2006). The outer 4'' pair A,B (TOK 73) was found in the Two Micron All Sky Survey (2MASS) catalog and was confirmed as physical by the fact that this pair keeps a fixed position despite the fast PM (Tokovinin 2011; Tokovinin et al. 2012). Gaia also confirms that the two stars are bound; the period of this pair is ∼3 kyr and the mass of B inferred from its luminosity is about 0.22  . It is fainter than A by 5.5 mag in the V band and by 3.5 mag in K (Tokovinin et al. 2012; the 2MASS photometry of B is unreliable owing to close separation).
Hipparcos detected astrometric acceleration of star A (Makarov & Kaplan 2005), now confirmed by Brandt (2018). First observations in 2010 revealed that A has double lines (Tokovinin 2015). A very small dip in the CCF (Figure 3) varies in anti-phase with the RV of Aa, hence it belongs to the spectroscopic secondary component Ab. The period of this pair, 22 3, is too short to cause the acceleration. However, the RVs of both components revealed large and correlated deviations from the orbit caused by the astrometric subsystem. After monitoring for 10 yr, sufficient data have been accumulated to determine the outer spectroscopic orbit of Aab,Ac with the period of 1146 days (3.14 yr). Both orbits were fitted simultaneously using the code orbit3 (Tokovinin & Latham 2017; Tokovinin 2017).4
The estimated semimajor axis of the 3 yr subsystem is 37 mas; it is apparently responsible for the acceleration, as well as for the discrepancy between Gaia parallaxes and PMs of A and B.
3, is too short to cause the acceleration. However, the RVs of both components revealed large and correlated deviations from the orbit caused by the astrometric subsystem. After monitoring for 10 yr, sufficient data have been accumulated to determine the outer spectroscopic orbit of Aab,Ac with the period of 1146 days (3.14 yr). Both orbits were fitted simultaneously using the code orbit3 (Tokovinin & Latham 2017; Tokovinin 2017).4
The estimated semimajor axis of the 3 yr subsystem is 37 mas; it is apparently responsible for the acceleration, as well as for the discrepancy between Gaia parallaxes and PMs of A and B.
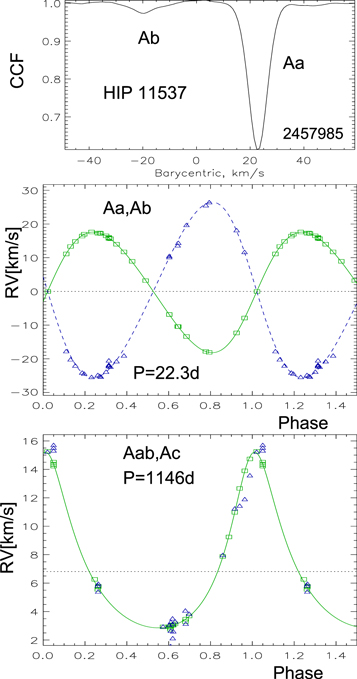
Figure 3. CCF (top) and RV curves of the inner (middle) and outer (bottom) subsystems of HIP 11537A. Contribution of the other orbit is subtracted from each RV curve.
Download figure:
Standard image High-resolution imageThe mass of Aa estimated from its luminosity, 0.97  , matches the G5V spectral type and is much larger than the spectroscopic mass, 0.11
  . Hence, the orbit of Aa,Ab has a small inclination of
  . The mass sum of Aa,Ab, 0.97 + 0.67
  , implies the minimum mass of 0.45
  for Ac. The lines of Ac are not seen, therefore its mass is smaller than that of Ab, and the inclination of the Aab,Ac orbit cannot be as small as 29°; the two orbits are not coplanar, despite the short 3 yr outer period.
The best estimate of the PM of A, (90.5, −28.8) mas yr−1, is obtained by Brandt (2018) from the Gaia and Hipparcos positions. Its combination with the parallax and the center-of-mass RV measured here corresponds to the heliocentric velocity of (U, V, W) = (−15.3, −29.4, 5.5) km s−1. This velocity does not match any known moving group. I confirm the presence of lithium in the spectrum of Aa, discovered by Torres et al. (2006); its equivalen width is 40 ± 3 mÅ. However, the projected axial rotation of Aa is quite slow, 2 km s−1. If the system is young, as evidenced by lithium, flux modulation by starspots should be detectable, allowing for the determination of the rotation period. However, the relative flux variation measured by the Transiting Exoplanet Survey Satellite (TESS; Ricker et al. 2014) is only 0.0006 rms and it is rather slow; a period around 11 days is possible, but it cannot be confirmed from one month of TESS data.
3.4. HIP 22531, 22534, and 22562 (Sextuple)
The main component A of this nearby (38 pc) multiple system is a bright star ι Pictoris (HR 1563, F0V). Together with its sister B (HR 1564, F4V), it has been known since 1826 as a 126 visual binary DUN 18. The 9th magnitude K2V star C at 5 arcminutes from AB (projected distance 12 kau) also belongs to the system. All three resolved stars have individual Hipparcos numbers (Table 1). Estimated periods of A,B and AB,C are 6 kyr and 600 kyr, respectively. Stars A and B are themselves spectroscopic binaries according to Nordström & Andersen (1985); their orbits are determined here. Moreover, star A has a large astrometric acceleration indicative of yet another companion (Brandt 2018). Therefore, this system contains no less than six stars. Components A, B, and C are located on the main sequence in the Hertzsprung–Russell diagram (Figure 4(a)), where Gaia effective temperatures are used (7047, 6422, and 5082 K for A, B, and C respectively). The isochronal age is about 1.5 Gyr.
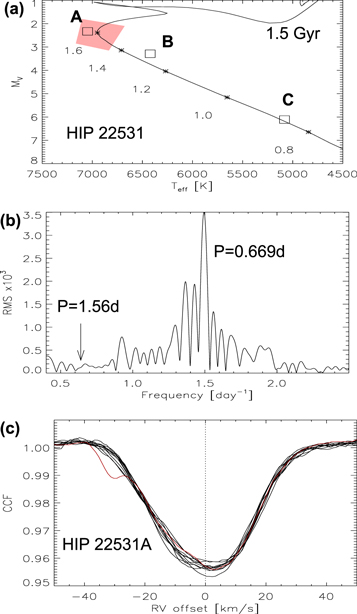
Figure 4. Location of components of the HIP 22531 system (squares) on the Hertzsprung–Russell diagram (a). Asterisks and numbers mark masses on the 1.5 Gyr solar-metallicity isochrone (Bressan et al. 2012), the pink area shows the γ Dor instability strip according to Handler & Shobbrook (2002). The periodogram of normalized flux fluctuations in one TESS sector is shown in (b); arrow indicates the orbital frequency. Ten recentered CCFs of component A are overplotted in (c) to illustrate its variability. The CCF with a detail on the left observed on JD 2,458,194 is highlighted in red.
Download figure:
Standard image High-resolution imageSpectral types of A and B are F0V and F4V, respectively. Their CCF dips are wide and shallow, resulting in the poor RV accuracy. The projected rotation of A estimated here from the CCF width, V sin i ≈ 25 km s−1, agrees with 26.0 km s−1 measured by Pribulla et al. (2014). Moreover, the CCF dips of A and B have variable shape, another source of RV errors. The late-type star C, on the contrary, has a narrow and high-contrast dip. According to Nordström et al. (2004), Gaia, and our measurement its RV is constant.
Star A is a single-lined binary with a short period of 1.56 days (Figure 5, top). However, residuals of 19 CHIRON RVs from the circular orbit are uncomfortably large, 2.7 km s−1. Much smaller residuals are obtained using portions of the data and adjusting only the systemic velocity. A component that produces astrometric acceleration also explains slowly varying RV residuals. A period of 1003 days (2.75 yr) was found and a tentative orbit of the tertiary component Ac around Aab was fitted jointly with the inner orbit using orbit3 (Figure 5, bottom). The residuals to the two-orbit solution are 0.55 km s−1. Two RVs measured by Pribulla et al. (2014) are used, while one RVs from Tokovinin et al. (2015) deviating by 4 km s−1 is ignored. Four RVs from Nordström & Andersen (1985) extend the time coverage to 45 yr and match the orbits after a zero-point correction of +3 km s−1. I decided not to use those early measurements because of uncertain zero-point and phasing (the 2.75 yr period is still tentative). The minimum mass of Ac is 0.2  .
.
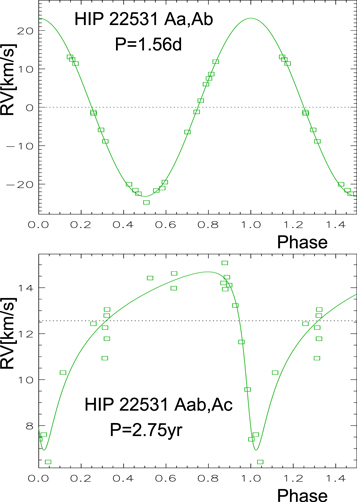
Figure 5. RV curves of HIP 22531 Aa,Ab (top) and Aab,Ac (bottom). Contribution of the other orbit is subtracted from each curve.
Download figure:
Standard image High-resolution imageAssuming a radius of 1.5 R⊙ for Aa, its rotation synchronous with the orbit corresponds to 48 km s−1 at the equator. Comparison with the projected rotation indicates an inclination of  . Attempting to evaluate the rotation period from photometry, I downloaded one sector of TESS data (duration 20 days). Large pixels of TESS mean that it measures the combined flux of A and B. Flux modulation with a period of 0.669 day and an amplitude of ∼1% is found (Figure 4(b)). Although the TESS aperture contains five stars belonging to this system, I attribute flux modulation to the brightest star Aa. It is located in the instability zone of γ Dor pulsations and this period is indeed typical for such variables (Handler & Shobbrook 2002). Distortions of the CCFs are likely related to pulsations (Figure 4(c)). The ratio of pulsation and orbital periods, 2.337, suggests a 7:3 resonance. Further investigation of pulsations is outside the scope of this study. TESS photometry proves absence of eclipses, in agreement with the estimated inclination of the inner orbit.
The tentative orbit of Aab,Ac with a period of 2.75 yr corresponds to a semimajor axis of 60 mas. The duration of Gaia DR2 observations is 1.2 yr, about half of the orbital period, so orbital displacement can be as large as μorb ∼ 100 mas yr−1, and star A would move with a speed of qAab,Ac μorb, where qAab,Ac ∼ 0.2 is the mass ratio. The PM anomaly of A computed by Brandt (2018) for 2015.5 and 1991.25 has opposite signs, (−13.5, −16.0) and (4.9, 5.7) mas yr−1 respectively. It agrees qualitatively with the preliminary spectroscopic orbit of Aab,Ac. Although Gaia astrometry of this bright star is not very accurate, the PM anomaly of A is highly significant; in contrast, the PM anomalies of B and C are compatible with zero. The Gaia parallax of A, 24.92 ± 0.16 mas, is formally discrepant with the more accurate parallax of C, 26.31 ± 0.02 mas, and illustrates how astrometric companions bias the parallax. No close companions to A and B were found by adaptive optics imaging (Tokovinin et al. 2010), but star Ac is too faint and too close to be detectable.
The RV of B (Figure 6) changes less rapidly, with a period of 208 days. A small narrow detail in its CCFs belongs to the secondary component Bb, of later spectral type. Large disparity between dip areas of Ba and Bb agrees with the mass ratio of 0.58 derived from the RV amplitudes; the mass of Bb is about 0.81  . Some CCFs were fitted with fixed dip parameters because free fits of two components lead to large RV residuals. Two of the three RVs published by Nordström & Andersen (1985) match the orbit after a slight period adjustment, but the third one is discrepant, so I decided not to use their data. Given the estimated mass of Ba, 1.4
  , the RV amplitudes correspond to the inclination iBa,Bb = 44°.
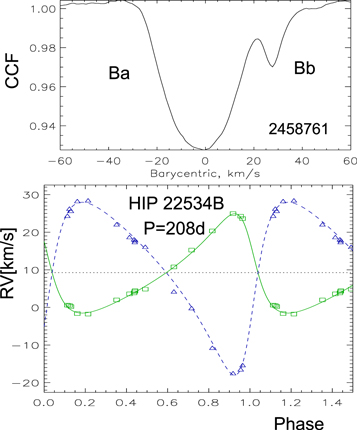
Figure 6. CCF (top) and RV curve (bottom) of HIP 22534 Ba,Bb.
Download figure:
Standard image High-resolution imageThe most accurate estimate of the spatial motion (U, V, W) = (−12.9, 4.0, −19.6) km s−1 is obtained using the astrometry and RV of star C unaffected by inner subsystems; the velocities of A and B are similar. The velocity does not match known moving groups.
3.5. HIP 31089 (Triple)
This tight triple system is located at 67 pc from the Sun. The outer pair A 2817, discovered by R. Aitken in 1914, has a good-quality visual orbit with a period of 32 yr and a semimajor axis of 0194. The visual binary explains the large error of the Gaia parallax, 15.09 ± 0.42 mas.
The CHIRON spectra show double lines, most often blended. Fainter lines belong to the visual secondary B and move with a period of 213 days, while stronger lines of A have almost constant RV. The double-lined nature was noted by Nordström et al. (2004), although they derived an incorrect mass ratio q = 0.34 by assuming that both components belong to the same spectroscopic system.
I determined initially the single-lined spectroscopic orbit of Ba,Bb while neglecting the outer orbit. However, the RVs of A show a slow drift. So, for the final fit I used again orbit3 and fitted the inner and outer orbits jointly. All available visual measurements of A,B are used. The spectroscopic elements of both orbits are found Table 3, and the RV curves are shown in Figure 7. The remaining visual elements of A,B are a = 01941 ± 00048, Ω = 233 7 ± 13,
  P = 31.67 ± 0.15 yr, and T = 2015.24 ± 0.31.

Figure 7. CCF (top) and RV curves of HIP 31089 Ba,Bb (middle) and A,B (bottom), where the contribution of the other orbit is subtracted.
Download figure:
Standard image High-resolution imageThe combined outer orbit corresponds to the orbital parallax of 14.05 ± 0.33 mas and the masses of 1.12 and 1.46  for A and B, respectively. Owing to the small inclination of A,B and small RV amplitudes, these masses are only approximate. The effective temperature of 5763 K estimated by both Gaia and the V − K color corresponds to the spectral type G1V, rather than G5 listed in Simbad. The visual magnitudes of A and B, 8.76 and 9.41 (ΔV = 0.65 mag, combined V = 8.28 mag), imply masses of 1.07 and 0.97
  for A and Ba if they are normal main-sequence stars. The minimum mass of Bb is then 0.42
  . Given that Bb is not detected in the spectra, its mass cannot be much larger, hence the inclination of the Ba,Bb orbit should not be small. Its estimated axis is 11 mas. I tried to determine the orientation of the inner orbit by the wobble in the motion of A,B. However, the wobble amplitude of ∼2 mas is comparable to the measurement noise, leading to an uncertain result. The masses of 1.1, 0.97, and 0.43
  for A, Ba, and Bb, respectively, fit all available data and correspond to the dynamical parallax of 14.2 mas. A weak (33 mÅ) lithium line detectable in the spectra can be attributed to A.
Brandt (2018) measured the PM anomaly of (+7.0, −4.2) mas yr−1, while B moved on its orbit relative to A with the speed of (−45.2, 21.0) mas yr−1 in 2015.5. The ratio of these speeds gives the wobble factor (ratio of astrometric and full semimajor axes) for the outer orbit fAB ≈ 0.16. The masses adopted here and ΔVA,B = 0.65 mag lead to fAB = 0.20, in qualitative agreement with Gaia. Unfortunately, the PM and parallax measured by Gaia can be biased, precluding an accurate estimate of the mass ratio and mass sum in the outer system.
3.6. HIP 49336 (Quadruple)
The outer pair A,B is a classical visual binary I 292 known since 1882. Its visual orbit with P = 823 yr (Seymour & Mason 2000) has been recently revised to P = 380 yr, a = 0869, and e = 0.718 (A. Tokovinin 2020, in preparation). Nordström et al. (2004) observed this star twice, noting double lines and a large RV variability. The fact that Gaia did not measure the RV is indirect proof of the double-lined spectrum.
Monitoring with CHIRON reveals a CCF with three dips that are sometimes blended (Figure 8). The strongest and weakest dips belong to the spectroscopic subsystem Aa,Ab with a period of 44.5 days and a large eccentricity e = 0.83, while the RV of the intermediate dip that belongs to the visual component B is relatively constant, in agreement with the long period of A,B.

Figure 8. CCF (top) and RV curve (bottom) of HIP 49336 Aa,Ab.
Download figure:
Standard image High-resolution imageEstimated masses of Aa and Ab correspond to a large inclination of the inner pair, while the outer inclination is  . Therefore the orbits are not coplanar. Their orientation could be determined by the wobble in the motion of A,B, although the estimated wobble amplitude is small, ∼1 mas.
The updated visual orbit predicts an RV difference between A and B of 4 km s−1 in 2020.0, while the measured one is 1 km s−1. The RVs of B show a negative trend. The first, most discrepant RV of B in Table 5 is derived from a heavily blended CCF and is therefore uncertain, but it matches the overall trend. Therefore, there is a subsystem Ba,Bb with yet unknown period, possibly of the order of a year. The orbit of A,B is poorly constrained; moreover, the Gaia parallax of this pair, 10.07 ± 0.34 mas, is not very accurate and might be biased. Therefore, a slight excess of the mass sum calculated from the orbit, 4.46  , over the total estimated mass of three stars, 4.38
  , is not meaningful. The Hipparcos parallax of 12.2 ± 1.0 mas corresponds to the mass sum of 2.5
  .
.
3.7. HIP 104835 and 104833 (Quadruple)
This system is quadruple. The outer 104 pair is composed of HIP 104835 (AB) and HIP 104833 (C). The Gaia parallax of AB, 17.3 ± 1.0 mas, as well as PM, are discrepant with those of C because the 081 pair A,B (B 520, estimated period 1.3 kyr) has not been resolved. For comparison, the original Hipparcos parallax of this star is 2.4 ± 3.3 mas. I ignore the Gaia astrometry of AB, use the parallax of C, 4.83 ± 0.05 mas, as the distance to both stars, and assume that AB,C (HJ 5253 AB,C) is a bound pair with a period of ∼40 kyr, considering their matching RVs and the low probability of finding two unrelated bright stars so close to each other in the sky region with a low stellar density.
Stars AB and C were observed with CHIRON (Tokovinin 2015), discovering RV variability of component C. Here the orbit of Ca,Cb with a period of 11 days is determined (Figure 9). However, the wide and shallow CCF of C leads to large RV errors (rms residuals 0.22 km s−1). On the other hand, the CCF dip of the combined light of AB is less wide, and three spectra of AB give a consistent RV of −7.55 km s−1 with a 0.1 km s−1 rms scatter.

Figure 9. CCF (top) and RV curve (bottom) of HIP 104833 Ca,Cb.
Download figure:
Standard image High-resolution imageThe V − K colors of AB and C are similar and correspond to the spectral type F5V. Assuming that the V − K colors of A and B equal their combined color and that ΔVAB = 0.9 mag, the stars can be placed on the CMD. Their location corresponds to the turn-off at the age of ∼3 Gyr and masses of 1.42, 1.35, and 1.30  for A, Ca, and B, respectively. The minimum mass of Cb is then 0.58
  . The small but statistically significant acceleration of C found by Brandt (2018), (+0.7, −1.7) mas yr−1, might be spurious, caused by the complexity of modeling Hipparcos data by three point sources.
3.8. HIP 107731 (Triple)
This star with a fast PM of 037 yr−1 belongs to the thick disk population in the solar neighborhood (distance 64 pc). A faint visual companion B at 56 separation (SKF 1175, period ∼4 kyr), originally found in 2MASS, is physical, as revealed by its fixed position and matching parallax. Hipparcos detected acceleration (Makarov & Kaplan 2005), hence the system is triple. The Gaia parallax of B, 15.68 ± 0.05 mas, is more accurate than the parallax of A biased by the acceleration, 14.25 ± 0.34 mas. The V magnitude of B is determined by Gaia, and its K magnitude from the differential photometry in Tokovinin et al. (2013) because the 2MASS photometry of B is biased by the small separation.
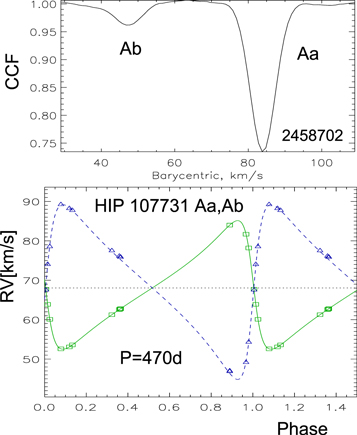
Double lines in the spectrum of A were detected with CHIRON in 2017. Slow RV variation required long-term monitoring. Finally, the double-lined orbit with P = 470 days (Figure 10) is determined from 14 spectra taken during 2.3 yr. Note the small RV residuals of Aa, 0.007 km s−1, owing to its narrow and high-contrast CCF dip. The 80× larger residuals of Ab are explained by the weakness of its dip and blending with the lines of Aa. The ratio of the dip areas suggests  mag, in agreement with the mass ratio q = 0.735. The estimated masses of Aa and Ab, 1.02 and 0.75
  , and the spectroscopic masses in Table 3 imply an inclination of
  . The referee, K. Fuhrmann, noted that these metal-poor stars likely have somewhat smaller masses, hence the inner orbit is close to the edge-on orientation. The semimajor axis is 22 mas. Direct resolution of Aa,Ab by speckle interferometry will be very difficult, although possible in principle. The maximum expected separation is about 20 mas, but owing to unfavorable orbit orientation most of the time the separation is smaller. The center-of-mass RV and the average PM from Brandt (2018) lead to the heliocentric velocity of (U, V, W) = (66.1, −110.9, −16.7) km s−1. The stars are located on the CMD slightly below the main sequence, suggesting subsolar metallicity. The dip of Aa has a smaller area compared to stars of the same color.
Figure 10. CCF (top) and RV curve (bottom) of HIP 107731 Aa,Ab.
Download figure:
Standard image High-resolution image
The inner subsystem certainly modulates the photocenter position with an amplitude of ∼9 mas. However, its 1.3 yr period is shorter that the 3.2 yr duration of the Hipparcos mission, meaning that the acceleration astrometric model is inadequate. This is not a unique case: many Hipparcos acceleration binaries with known visual orbits have periods shorter than 3.2 yr. This fact sends a cautionary message to the Gaia team: acceleration solutions fitted to one-dimensional scans might be spurious.
4. Summary
This paper clarifies architecture of eight hierarchical systems (three triples, four quadruples, and one sextuple) containing 31 stars in total. Two inner pairs are twins with mass ratios >0.95, similar to other twins found in previous papers of this series. Several other inner pairs are also double-lined, with components of comparable masses. This trend can be explained if shrinkage of inner orbits is caused mostly by accretion which also equalizes stellar masses (Tokovinin & Moe 2020). In this mechanism, inner pairs form first and migrate, while outer companion(s) form later from the continuing gas infall. However, sequential formation of components envisioned by Tokovinin & Moe (2020) cannot explain quadruple systems composed of two pairs (2+2 hierarchy) and wide hierarchies. In this case, subsystems or distant components form at wide separations. However, gas-assisted migration should still work, helping to shrink both outer and inner orbits. Non-coplanar orbits found in many hierarchical systems imply a complex dynamical history.
Modern astronomy is driven by large surveys and large data. Individual case-by-case studies of hierarchical systems cannot compete with data factories like Gaia. However, Gaia often fails to provide reliable astrometry owing to complexity of these systems. Similarly, automatic recovery of RVs from multicomponent spectra is unlikely. Even for single-lined systems, limited time coverage and cadence of Gaia will restrict the range of accessible spectroscopic orbits. Hence, continued complementary ground-based monitoring and individual analysis of each hierarchical system remain relevant.
I thank operators of the 1.5 m telescope for executing observations of this program and the SMARTS team for scheduling and pipeline processing.
This work used the SIMBAD service operated by Centre des Données Stellaires (Strasbourg, France), bibliographic references from the Astrophysics Data System maintained by SAO/NASA, and the Washington Double Star Catalog maintained at USNO. This paper includes data collected by the TESS mission funded by the NASA Explorer Program. This work has made use of data from the European Space Agency (ESA) mission Gaia (https://www.cosmos.esa.int/gaia), processed by the Gaia Data Processing and Analysis Consortium (DPAC, https://www.cosmos.esa.int/web/gaia/dpac/consortium). Funding for the DPAC has been provided by national institutions, in particular the institutions participating in the Gaia Multilateral Agreement.
Facilities: CTIO:1.5 m - , Gaia - , TESS. -
Footnotes
- 2
- 3
Codebase: http://www.ctio.noao.edu/~atokovin/orbit/ and 10.5281/zenodo.61119.
- 4
Codebase: 10.5281/zenodo.321854.