


Abstract
We report the discovery of a lithium-rich giant, HD 150382, a post-red-giant-branch clump star. The atmospheric parameters, the chemical abundances for 17 elements, and the isotopic ratio 12C/13C were determined using the equivalent width and the spectral synthesis methods. The lithium abundance was determined via spectral synthesis of the Li i resonance doublet at λ 6708 yielding log  (Li)NLTE = 2.55. The excited-state line at λ 6104 also was analyzed. In addition, we have used theoretical evolutionary tracks to determine the mass and luminosity of HD 150382 and compare it with other well-known lithium-rich giants in the literature. Our results show that HD 150382 is a slowly rotating K-giant star having near-solar metallicity. We also show that HD 150382 is not s-process enriched, which is in agreement with its evolutionary status. Finally, based on the abundance results, we study the possible scenarios of the lithium enrichment.
Export citation and abstract BibTeX RIS
1. Introduction
The dilution of main-sequence remaining Li occurs during the first ascent to the red giant branch (RGB), due to the development of an extensive convective envelope. Hence, it is estimated that objects with an exceptional amount of Li in their atmospheres (log (Li) ≥ 1.5), the so-called lithium-rich giants, consist of only 1%–2% of the RGB stars (Wallerstein & Sneden 1982; Brown et al. 1989; Kumar et al. 2011; Smiljanic et al. 2018; among others).
Lithium atoms can be synthesized via the Cameron–Fowler mechanism (Cameron & Fowler 1971), but this scenario requires physical and chemical conditions for beryllium to be produced and quickly transported to cool regions where lithium could finally be created [3He(α,γ)7Be(e−, ν) 7Li]. This mechanism, also called 7Be–transport, occurs in the bump in the luminosity function for stars on the RGB (Iben 1968; Christensen-Dalsgaard 2013) and it is possible that some giants become lithium-rich at the core-He burning phase, since most of these peculiar objects are classified as RGB clump stars (Kumar et al. 2011; Casey et al. 2019; Deepak & Reddy 2019).
The cool bottom processing (CBP), as a consequence of a deep extra mixing, is the most likely answer for the material that is subjected to partial nuclear processing in the neighborhood of the outer edge of the H-burning shell and back to the envelope in low-mass stars (Boothroyd & Sackmann 1999; Sackmann & Boothroyd 1999). One of the important products of this extra mixing is the destruction of 3He and the creation of 7Be, but its efficiency depends on complex parameters such as mixing speeds, geometry, and episodicity. Additionally, to find a possible solution for the high 7Li abundance in low-mass star atmospheres (≤2.5 M⊙), the CBP is (also) commonly invoked to explain the low 12C/13C ratio in red giant stars. Nevertheless, CBP is not related to any physical explanation that supports its predictions in stellar surface abundances. More complete and literature-based processes, such as Thermohaline Mixing, fail to predict the lithium abundances found on the surface of these classes of chemically peculiar giants before the thermally pulsing asymptotic giant branch (TP-AGB; Cantiello & Langer 2010; Charbonnel & Lagarde 2010; Lagarde et al. 2019). Smith & Lambert (1989, 1990) showed that the existence of Li-rich stars in the TP-AGB stage also occurs via the Cameron–Fowler mechanism. The lithium content in these luminous stars are in good agreement with the theoretical predictions considering hot bottom burning, which consists in a H-burning shell condition in which the outer part of the shell is included in the envelope convection (Sackmann et al. 1974; Scalo et al. 1975; Herwig 2005). Therefore, lithium self-enrichment is also possible to occur in luminous stars at the TP-AGB phase of intermediate-mass stars (≥4.0–7.0 M⊙).
The discovery of Li-rich stars in the early-AGB phase proves to be a difficult task. Gratton & D'Antona (1989) reported an example of a metal-poor giant ([Fe/H] = −0.5) with strong lithium lines, HD 39853. Today this well-studied giant dissociates from the others Li-rich stars because it is a low-mass star that has low surface gravity and effective temperature (respectively, 1.5 M⊙; 1.16 dex; 3900 K). However, the authors showed that HD 39853 is not as lithium-rich [log (Li) = 2.8] compared to some other stars at the RGB clump, such as IRAS 13539−4153 [log (Li) = 4.10; Reddy & Lambert 2005]. Another reported Li-rich star at the early-AGB phase was investigated by Reddy & Lambert (2005), IRAS 12327−6523, which presents a small lithium enrichment [log (Li) = 1.60]. In a more recent discovery, Alcalá et al. (2011) show that IRAS 12556−7731 is the first M-type Li-rich star. The metallicity found by them is close to solar ([Fe/H] = −0.05) and the lithium abundance is similar to that of HD 39853 [log (Li) = 2.4]. Withal, IRAS 12556−7731 is a low-mass star (1.0 M⊙; Alcalá et al. 2011). Therefore, it is possible that the preservation and/or production of lithium occurs after the RGB-bump phase due to the He-core flash or extra-mixing events that could explain the existence of these low-mass objects in more advanced stages of stellar evolution such as early-AGB stars. The fact is that these giants are less enriched, or have not fully depleted the manufactured lithium or received in stages previous to the AGB stage.
In this work, we reported the discovery of a new lithium-rich star, HD 150382, which is probably at the early-AGB phase. HD 150382 was selected for observation after a search in the literature for K-giant stars that have not yet been spectroscopically observed with high resolution with the aim to find some stars with chemical peculiarities, such as those with enrichment of the s-process elements, lithium enrichment, or new weak G-band stars. HD 150382 is a bright star (V = 6.83) classified as K3/4 III (Houk & Swift 1999) and is located in Ophiuchus, (ℓ, b) = (05 79, +2205), at a distance of 0.320 kpc (Gaia Collaboration et al. 2018). Here, we present the first chemical analysis of this giant star.
2. The Giant HD 150382
2.1. Observation
The spectroscopic observation was carried out on 2016 April 11, and was made using the Fiber-fed Extended Range Optical Spectrograph (FEROS; Kaufer et al. 1999) at the 2.2 m Max Planck Gesellschaft/European Southern Observatory (ESO) Telescope in La Silla, Chile. The FEROS provides a resolving power of R ≈ 48,000 and a full wavelength coverage between 3800–9200 Å. The exposure time for HD 150382 was 300 s to a typical signal-to-noise ratio (S/N) = 100–150. Further, the reduction was performed using the FEROS Data Reduction System pipeline.
2.2. Atmospheric Parameters
The atmospheric parameters of HD 150382, namely the effective temperature (Teff), surface gravity (log g), microturbulence (ξ), and metallicity ([Fe/H]) (we use the notation [X/H] = log(NX/NH)⋆ − log(NX/NH)⊙), were determined in the same way as in Holanda et al. (2019) in the study of K-giants of the open cluster NGC 2345. The absorption lines selected for this task were taken from Lambert et al. (1996). In particular, for the atmospheric analysis we adopted the local thermodynamic equilibrium (LTE), the model atmospheres of Kurucz (1993), and the spectral analysis code MOOG (2013 version; Sneden 1973) to analyze the absorption spectrum of HD 150382.
The effective temperature (Teff) was obtained requiring that the abundance of Fe i lines does not depend on the lower-level excitation potential (χ). Furthermore, the microturbulence velocity (ξ) was found requiring that the abundance of Fe i lines does not also depend on the reduced equivalent width (EW/λ). These two conditions are seen in Figure 1, where it shows, respectively, the diagrams that correspond to the abundances of individual Fe i lines plotted versus the excitation potential and the reduced line strength for the atmospheric parameters adopted for HD 150382. Also, the surface gravity (log g) was determined based on the ionization equilibrium requiring [log (Fe i) ≈ log (Fe ii)].
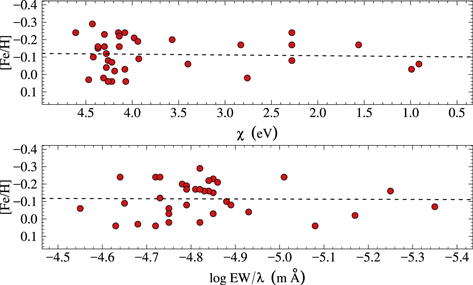
Figure 1. Fe i abundances vs. excitation potential (top) and vs. reduced equivalent width  (bottom). Dashed lines represent the linear regression with the angular coefficient close to zero.
Download figure:
Standard image High-resolution imageThe uncertainties in the atmospheric parameters were estimated following the same methodology as Holanda et al. (2019), i.e., the error in effective temperature was estimated from the uncertainty in the slope of relation [Fe i/H] versus the excitation potential, while the error in the microturbulent velocity was estimated from the uncertainty in the slope of [Fe i/H] versus log EW/λ. For gravity, the error is estimated by changing the log g value until the difference in the average abundances of Fe i and Fe ii equals the standard deviation of the mean [Fe i/H].
In this context, we compare the derived spectroscopic gravity with the evolutionary gravity log g⋆ using the previously determined mass M from the isocrone adjustment (details in Section 3) using the equation
In the equation above, V, AV, BCV,  , and r are the visual magnitude, interstellar absorption in the V band (Chen et al. 1999), bolometric correction (Alonso et al. 1999), photometric temperature in the (B − V) color (Alonso et al. 1999), and distance (Gaia Collaboration et al. 2018), respectively. The solar values used are Mbol = 4.75, log g = 4.44 dex, and Teff = 5777 K. The result is log g⋆ = 1.37 dex, which is in good agreement with the spectroscopic result. Based on (B−V)0 we determined a temperature of 3715 K, but this color index is no longer useful for cool giants (Teff < 4000 K; Alonso et al. 1999; da Silva et al. 2006). On other hand, we also derive photometric temperature through (V−K)0 and find a similar value. However, some authors caution that stars with K < 3.0 are saturated (HD 150382 has K = 2.6), and the error of their colors is huge (Cutri et al. 1993; da Silva et al. 2006). For these results and limitations, we adopted our spectroscopic temperature.
Additionally we determined the projected rotational velocity (v sin i) and the radial velocity of HD 150382. The projected rotational velocity was obtained based on the spectral synthesis of the Fe i 6151.6 Å line. In this procedure, was adopted the macroturbulent velocity of 3.0 km s−1 (Fekel 1997) and FWHM of 13.0 m Å (corresponding to the FWHM thorium-argon lines used for the wavelength calibration for FEROS). Thus, with the atmospheric parameters previously determined, we find the v sin i = 3.7 ± 0.8 km s−1. The radial velocity was obtained by measuring the Doppler shifts of the Fe i lines used to determine the atmospheric parameters. The final atmospheric parameters and other basic information for HD 150382 are listed in Table 1.
Table 1. Main Parameters of HD 150382
| Parameter | Value | Reference |
|---|---|---|
| ℓ | 0579 |
⋯ |
| b | +2205 |
⋯ |
| log t (Gyr) | 9.00 ± 0.20 | This work |
| RGC (kpc) | 7.65 ± 0.05a | This work |
| Teff (K) | 4070 ± 80 | This work |
| log g (dex) | 1.35 ± 0.08 | This work |
| ξt (km s−1) | 1.64 ± 0.08 | This work |
| [Fe/H](dex) | −0.09 ± 0.10 | This work |
| v sin i (km s−1) | 3.70 ± 0.80 | This work |
 (km s−1) (km s−1) |
5.36 ± 0.48 | This work |
 (km s−1) (km s−1) |
4.44 ± 0.12 | Gaia Collaboration et al. (2018) |
| d(pc) | 320.8 ± 4.1 | Gaia Collaboration et al. (2018) |
| Classification | K3/4 III | Houk & Swift (1999) |
Note.
aWe adopted RGC⊙ = 7.95 kpc.Download table as: ASCIITypeset image
2.3. Stellar Abundances
The chemical abundances of the elements sodium to nickel (Na, Mg, Al, Ca, Ti, Cr, and Ni), the elements whose solar system abundances have been predominantly synthesized in the s-process (Y, Zr, Ce, and Nd), and an element whose solar system abundance are predominantly attributed to the r-process (Eu) was determined in the same way as in Holanda et al. (2019) where we also applied the line-synthesis code MOOG. The equivalent widths of the absorption lines are given in Table 6. In addition, the abundances of lithium, carbon, nitrogen, oxygen, europium, and the isotopic ratio 12C/13C were determined using the spectral synthesis technique. All abundances determined here were normalized using the solar abundances of Asplund et al. (2009).
The lithium abundance was determined using the Li i resonance doublet at λ 6708 and the excited line at λ 6104, which assumes LTE conditions. The wavelengths and oscillator strengths for the individual components for the lithium lines were taken from Smith et al. (1998) and Hobbs et al. (1999), and the Vienna Atomic Line Database (VALD; Kupka et al. 1999) for the λ 6104 and λ 6708 lines. The resolution of the FEROS spectrum is not sufficient to rule out a contribution from 6Li at λ 6708, but we estimated an upper limit of 6Li/7Li = 0.04. Later, the correction for non-LTE (NLTE) effects was applied using data from Lind et al. (2009). These corrections were based on the model Teff = 4000 K, log g = 1.0 dex, ξ = 2.0 km s−1, and [Fe/H] = 0.0 where positive and particular corrections were found for each absorption line (Δlog (Li)λ 6104 = +0.28 and Δlog (Li)λ 6708 = +0.05).
The carbon and nitrogen abundances were obtained through C2 (λ 5635 region) and CN (λ 8003 region) using the same line lists as described in Holanda et al. (2019), as well as to obtain the isotopic ratio 12C/13C. The oxygen abundance was obtained based on the [O i] forbidden line at 6300 Å where we adopted log gf = −9.72 from Allende Prieto et al. (2001). We also take into account the contribution of CN and Ni i (Kupka et al. 1999) in the region of the oxygen absorption line. The europium abundance was based on the absorption lines at 6645 Å (Kupka et al. 1999; Mucciarelli et al. 2008).
Figure 2 shows the observed and synthetic spectra around the lithium lines at 6708 and 6104 Å, while Figure 3 shows the fit around the oxygen forbidden line, the CN lines between 8002 and 8005 Å, and the europium line at 6645 Å. In all of these cases, the dots represent the normalized observed spectra and the solid lines represent the synthetic spectra.

Figure 2. Observed (black dots) and synthetic spectra (gray, green, red, and blue solid lines) in the region of the lithium lines at 6103.6 Å (top) and at 6707.8 Å(bottom).
Download figure:
Standard image High-resolution image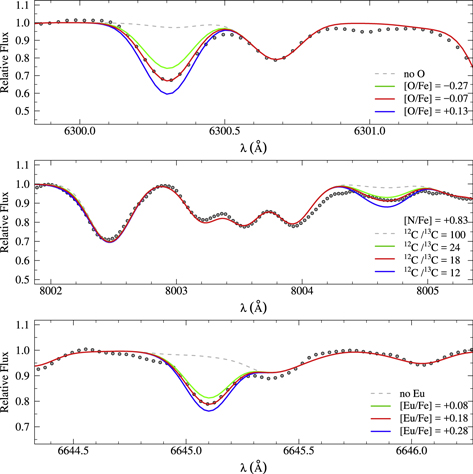
Figure 3. Observed (black dots) and synthetic spectra (gray, green, red, and blue solid lines) in the region of the oxygen forbidden line (top), in the region of the CN lines used to determine the nitrogen abundance and the 12C/13C ratio (middle), and in the region of the europium line (bottom) of HD 150382.
Download figure:
Standard image High-resolution imageWe used atomic data and NLTE corrections given by Lind et al. (2011) for two lines used to determine the sodium abundance (λ 6154 and λ 6161). Therefore, we had a slight decrease in the final sodium abundance for HD 150382 (Δlog (Na) = −0.16). Table 2 provides the results in notation relative to iron, except in the case of lithium ( ).
).
Table 2. Chemical Abundances of the Elements Derived for HD 150382
| Species | Abundances | n |
|---|---|---|

|
+2.08 | syn |

|
+2.36 | ⋯ |

|
+2.50 | syn |

|
+2.55 | ⋯ |
| [C i/Fe] | −0.22 | syn |
| [N i/Fe] | +0.83 | syn |
| [O i/Fe] | −0.07 | syn |
| 12C/13C | 18 | syn |
| [Na i/Fe] | +0.28 | 2 |
| [Na i/Fe]NLTE | +0.12 | 2 |
| [Mg i/Fe] | +0.18 ± 0.11 | 5 |
| [Al i/Fe] | +0.15 ± 0.11 | 5 |
| [Ca i/Fe] | +0.03 | 2 |
| [Ti i/Fe] | +0.08 ± 0.05 | 3 |
| [Cr i/Fe] | +0.07 ± 0.09 | 10 |
| [Fe i/H] | −0.09 ± 0.10 | 35 |
| [Fe ii/H] | −0.08 ± 0.08 | 5 |
| [Ni i/Fe] | +0.00 ± 0.10 | 10 |
| [Y ii/Fe] | +0.04 | 2 |
| [Zr i/Fe] | +0.19 ± 0.12 | 13 |
| [Ce ii/Fe] | +0.19 ± 0.07 | 3 |
| [Nd ii/Fe] | +0.09 ± 0.13 | 5 |
| [Eu ii/Fe] | +0.18 | syn |
| [α/Fe] | +0.10 ± 0.08 | ⋯ |
| [s/Fe] | +0.13 ± 0.08 | ⋯ |
Note. The second column gives the abundance in the notation [X/Fe] with the respective abundance dispersion among the lines of the elements with more than three available lines. The last column refers whether the abundances were derived either using the spectrum synthesis technique (syn) or based on the equivalent width measurements. In this latter case we provide the number of lines (n) used for the abundance determination. For lithium and sodium we also provide the NLTE abundances.
Download table as: ASCIITypeset image
2.4. Abundance Uncertainties
Tables 3 and 4 show the influence of the uncertainties of the atmospheric parameters over the chemical abundances for HD 150382. In Table 3 we also show the abundance variations due to the uncertainty of 3.0 mÅ in the equivalent width of the observed lines for all chemical species (ΔEW), considering the FEROS spectral resolution and the S/N (Cayrel et al. 1988). Also, the last column in Table 3 provides the abundance dispersion between the lines for each element with more than three available lines. The seventh column of Table 3 and the last column of Table 4 provide the total abundance uncertainty calculated as the root square of the sum of the various sources of uncertainties [(Σ σ2)1/2].
Table 3. Effects on Derived Abundances Resulting from Model Changes
| ΔTeff (K) | Δ log g | Δ ξ | Δ [Fe/H] | Δ EW | (Σ σ2)1/2 | σobs | |
|---|---|---|---|---|---|---|---|
| Species | (+80 K) | (+0.08) | (+0.08 km s−1) | (+0.10 dex) | (+3 mÅ) | ||

|
+0.03 | +0.02 | −0.03 | +0.03 | ⋯ | ±0.06 | ⋯ |

|
+0.04 | +0.01 | −0.04 | +0.03 | ⋯ | ±0.06 | ⋯ |
| [Na i/Fe] | +0.07 | +0.00 | −0.04 | +0.00 | +0.05 | ±0.09 | ⋯ |
| [Mg i/Fe] | −0.03 | +0.00 | −0.02 | +0.00 | +0.05 | ±0.06 | ±0.11 |
| [Al i/Fe] | +0.04 | −0.01 | −0.02 | −0.01 | +0.04 | ±0.06 | ±0.11 |
| [Ca i/Fe] | +0.07 | −0.01 | −0.03 | −0.01 | +0.04 | ±0.09 | ⋯ |
| [Ti i/Fe] | +0.09 | +0.00 | −0.08 | +0.00 | +0.06 | ±0.13 | ±0.05 |
| [Cr i/Fe] | +0.07 | +0.01 | −0.03 | +0.01 | +0.06 | ±0.10 | ±0.09 |
| [Fe i/H] | −0.03 | +0.01 | −0.05 | +0.00 | +0.05 | ±0.08 | ±0.10 |
| [Fe ii/H] | −0.16 | +0.03 | −0.03 | +0.01 | +0.07 | ±0.18 | ±0.08 |
| [Ni i/Fe] | −0.02 | +0.02 | −0.04 | +0.02 | +0.06 | ±0.08 | ±0.10 |
| [Y ii/Fe] | +0.00 | +0.02 | −0.05 | +0.03 | +0.06 | ±0.09 | ⋯ |
| [Zr i/Fe] | +0.13 | +0.01 | −0.05 | +0.01 | +0.06 | ±0.15 | ±0.12 |
| [Ce ii/Fe] | +0.01 | +0.03 | −0.05 | +0.03 | +0.07 | ±0.10 | ±0.08 |
| [Nd ii/Fe] | +0.02 | +0.03 | −0.02 | +0.04 | +0.06 | ±0.08 | ±0.13 |
| [Eu ii/Fe] | +0.00 | +0.03 | −0.03 | +0.02 | ⋯ | ±0.05 | ⋯ |
Download table as: ASCIITypeset image
Table 4. Influence of the Errors in Atmospheric Parameters over the Abundances of CNO Elements
| Δ Teff (K) | Δ log g | Δ ξ | [Fe/H] | Δ log(C) | Δ log(N) | Δ log(O) | (Σ σ2) 1/2 | |
|---|---|---|---|---|---|---|---|---|
| Species | +80 K | +0.08 dex | +0.08 km s−1 | +0.10 dex | +0.20 dex | +0.20 dex | +0.20 dex | |
| [C/Fe] | +0.02 | +0.06 | −0.02 | −0.08 | ⋯ | −0.02 | +0.08 | ±0.13 |
| [N/Fe] | −0.08 | +0.03 | −0.02 | +0.02 | −0.43 | ⋯ | +0.30 | ±0.53 |
| [O/Fe] | +0.07 | +0.02 | −0.02 | +0.02 | −0.02 | +0.02 | ⋯ | ±0.08 |
Download table as: ASCIITypeset image
Table 3 reveals that neutral species exhibit higher sensitivity to temperature variation while ionized species exhibit greater differences due to the uncertainties in the surface gravities. The uncertainties in the carbon abundance affect the nitrogen and oxygen abundances and vice versa once we used 12CN and C2 molecular lines for carbon and nitrogen abundance determinations.
3. Discussion
3.1. The Position of HD 150382 in the log g–Teff Diagram
Figure 4 shows the position of HD 150382 and other known Li-rich giants (the main parameters are listed in Table 5) in the log g–Teff diagram. In this diagram, evolutionary tracks were taken from Girardi et al. (2000) for a metallicity of Z = 0.019 for stars with masses between 1.0 and 4.0 M⊙. Based on the position in the diagram we obtained a mass of 2.20 ± 0.30 and hence log L/L⊙ = 2.86 ± 0.10 for our giant.
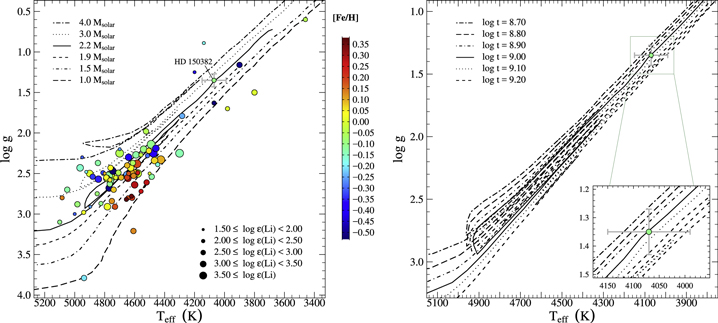
Figure 4. Position of HD 150382, other Li-rich stars and evolutionary tracks for a metallicity of Z = 0.019 for masses between 1.0 and 4.0 M⊙ in the log g–Teff diagram (left), and the position of HD 150382 with isochrone fits for ages between log t = 8.7 and 9.2 in the log g–Teff diagram (right). Evolutionary tracks and isochrones were taken from Girardi et al. (2000). In the left diagram, the size of the circles indicates the Li abundance of a star as shown in the legend at the bottom. Typical error bars are ±100 K in Teff and ±0.10 dex in log g.
Download figure:
Standard image High-resolution imageFurthermore, using the theoretical isochrones of Girardi et al. (2000) for the same metallicity considered, we determined the age of HD 150382 as log t = 9.00 ± 0.20. An important fact that helps us estimate the evolutionary status of HD 150382 is that for these isochrones Girardi and colleagues estimate that the end of the core-He burning phase occurs at log L/L⊙ ≈ 2.06 and the TP-AGB phase begins at log L/L⊙ ≈ 3.40.
Apart from that, we also obtained abundances of elements heavier than iron that are produced through neutron-capture processes, since TP-AGB stars are mainly responsible for the creation of these elements. Figure 5 presents the literature determinations for disk red clump giants (Mishenina et al. 2006; open diamonds) and local disk field giants (Luck & Heiter 2007; yellow filled triangles) as well as dwarf stars in the solar neighborhood (Battistini & Bensby 2016; blue open triangles). HD 150382 is located inside the cloud of objects from the three samples and, therefore, does not present chemical indications of production of the s-process elements. The mean of s-elements over iron is defined as ![$[{\rm{s}}/\mathrm{Fe}]=\tfrac{1}{4}$](https://content.cld.iop.org/journals/1538-3881/159/1/9/revision1/ajab5528ieqn12.gif) ([Y ii/Fe] + [Zr i/Fe] + [Ce ii/Fe] + [Nd ii/Fe]).
([Y ii/Fe] + [Zr i/Fe] + [Ce ii/Fe] + [Nd ii/Fe]).

Figure 5. Abundance radio [s/Fe] vs. [Fe/H] for HD 150382 comparative to literature values. The yellow filled triangles and open diamonds represent the giants analyzed by Luck & Heiter (2007) and Mishenina et al. (2006), respectively, while the blue open triangles represent the dwarfs studied by Battistini & Bensby (2016). Dashed lines indicate the solar value.
Download figure:
Standard image High-resolution imageThere are a few Li-rich stars classified as early-AGB stars or as possible AGB stars with masses ≤4.0 M⊙ studied in the literature (marked with an asterisk in Table 5). Among them, also based on Figure 4, we included HD 150382. Note that among the 83 lithium-rich giants, there are only seven early-AGB stars. Therefore, the Li-rich giants that are at or near the AGB stage constitute a small and interesting subgroup. But, what do these early-AGB Li-rich stars have in common? And, what is the most likely lithium maintenance or enrichment scenario for these evolved stars?
3.2. The Early-AGB Lithium-rich Stars
Based on the abundance pattern for the light elements, HD 150382 presents the abundances of carbon and nitrogen affected (i.e., 12C reduced and 14N increased). Further, the 12C/13C isotopic ratio is useful for understanding what is happening in the stellar interior, so we determined a low value of 12C/13C = 18 for HD 150382. Hereupon, there are few studies in the literature that have determined the 12C/13C isotopic ratio for lithium-rich giants and this seems to be a blind spot in the surveys that uncover a large number of stars.
Figure 6 displays two interesting distributions that can help map a common profile of early-AGB lithium-rich stars—the v sin i as a function of the carbon isotopic ratio (left panel) and v sin i as a function of the lithium abundance (right panel). In these panels, the red dashed line represents the limit v sin i, where rotational velocities higher than 8.0 km s−1 are considered as fast rotators and otherwise those below are considered as slow rotators (using the definition by Drake et al. 2002). The red circles (Figure 6) represent values for HD 150382, and the gray symbols and the blue circles represent the RGB and early-AGB lithium-rich giants, respectively, with data taken from the literature. It is worth mentioning that there is a lack of 12C/13C isotopic ratio determination among fast rotators, which would be a good indication of atypical events in standard evolutionary theory. But, within the particular class of slow rotator Li-rich giants, HD 150382 has typical values of the 12C/13C isotopic ratio and log (Li). The high 12C/13C isotopic ratio (when compared to other early-AGBs) may be due to recent initiation of the early-AGB phase or due to the still incomplete performance of a mechanism responsible for its chemical peculiarities.

Figure 6. v sin i as a function of the isotopic ratio 12C/13C (left) and lithium abundance log (Li) (right) for lithium-rich giants. The horizontal red line is fixed in  , adopted as the limit for slow (<8.0 km s−1) and fast (>8.0 km s−1) rotators. HD 150382 is represented by red circles (after correction from NLTE effects for lithium). For those objects whose abundances were taken from the literature triangles represent the upper limits.
Download figure:
Standard image High-resolution imageAs far as sodium is concerned, it can be classified as a tracer of a convective mixing event. We obtained a high [Na/Fe] ratio, +0.28 (Table 2), which after correcting for NLTE effects we obtained +0.12 ± 0.06. Furthermore, it is possible that in intermediate-mass giants sodium enrichment occurs when the evolved stars experience a deep mixing and their product is brought to the surface (Lagarde et al. 2012). In this case, it is quite possible that HD 150382 has experienced an extra-mixing episode during the RGB phase which produced sodium, lithium, and 13C, diluting 12C. Another object that may belong to the early-AGB phase is HD 787 (log (Li) = 2.20; da Silva et al. 1995), which has a significant amount of sodium in its atmosphere ([Na/Fe] = +0.50; Takeda & Tajitsu 2017). The carbon isotopic ratio for HD 150382 is close to the value presented by HD 787, 12C/13C = 15 (da Silva et al. 1995). Curiously, da Silva and colleagues also found low 12C abundance and moderate 14N enrichment ([C/Fe] = −0.20 and [N/Fe] = +0.10), corroborating in this way with the scenario of extra mixing for low-mass evolved group giants. Another low-mass Li-rich giant that may be in the early-AGB stage has even lower carbon isotope ratios, HD 39853 with 12C/13C = 7.0 (Gratton & D'Antona 1989).
3.2.1. Cool Bottom Processing?
In a scenario where Li enrichment is caused by the accretion of a brown dwarf or planet, according to Siess & Livio (1999a, 1999b), the mass accretion may be traced by a change in the photospheric chemical composition, rotation, X-ray emission, and ejection of a shell. In the first point, the models by Siess and Livio indicate a simultaneous enrichment of 6+7Li and beryllium and small amounts of boron. Theses signatures depend on parameters such as star mass, accreted mass, planet/brown dwarf composition, mass accretion rate, and evolutive stage of the star. Nevertheless, there is a limitation in these models to endorse enrichment log (Li) ≥ 2.80—early-AGB Li-rich stars do not present higher 7Li abundances than this, as seen in Figure 6 (right). The beryllium abundance is commonly verified by analyzing the spectral region around 3100 Å but, unfortunately, the FEROS spectrum does not cover this wavelength range. Recently, based on a large number of normal and Li-rich giants of different subgroups, Takeda & Tajitsu (2017) did not detect any beryllium enrichment in sample stars they analyzed. Furthermore, Drake et al. (2017) investigated the presence of boron in atmospheres of four Li-rich giants (including HD 787), and verified that those stars did not present a significant amount of this element.
In some fast rotator stars, they present traces of chromospheric activity and mass loss (Drake et al. 2002). From this perspective, we examined the profile of the Hα and Na D lines in the spectrum of HD 150382 and did not find any sign that would be indicative of losing mass and chromospheric activity. In addition to what has been said, as can be seen in Figure 6, early-AGB stars do not show rotation greater than 8.0 km s−1, but we do not rule out the possibility of high rotation having any influence on Li enrichment at some point in the past (not so recent). A planet or a stellar (sub)companion accretion can affect rotation, due to the transfer of angular momentum (Carlberg et al. 2010, 2012), and even trigger other mechanisms that may be associated with Li enrichment.
Observations show that the carbon isotopic ratio continues to decrease after the first dredge-up event for some stars on the RGB stage. This suggests that a deep extra mixing occurs inside these objects and is responsible for very high 13C abundance in their atmospheres. CBP appears to be the source of this extra-mixing mechanism that acts when the H-burnings shell erases the molecular weight discontinuity established by the first dredge-up and is attributed to the destruction of 3He and the creation of 7Li in low-mass RGB stars. The efficiency of this mechanism is governed by parameters such as mixing speed, geometry, and episodicity. The amount of lithium can reach a value of log (Li) ≈ 4.0 in the atmosphere of these RGB stars (regardless of previous lithium history of the giant; Sackmann & Boothroyd 1999 and Boothroyd & Sackmann 1999). Although speculative, it is possible that the substellar companion accretion scenario may trigger instabilities responsible for CBP (Siess & Livio 1999b). However, if deep circulation acts for a long time, a continuous process, stars that have enriched themselves through this mechanism can completely destroy beryllium and boron. This can erase the chemical predictions of Siess and Livio.
Since low-mass AGB stars have a similar internal structure to the RGB tip stars, CBP can also occur at the early-AGB phase (Sackmann & Boothroyd 1999). As observed in Figure 6 (left) Li-rich giants present 12C/13C ≤ 20, i.e., more 13C is expected than in the first and second dredge-up events, but if the Li enrichment occurs by the early-AGB this happens less clearly in relation to the RGB that goes through the same process.
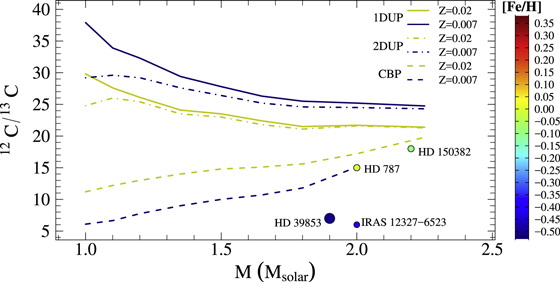
Figure 7 displays the 12C/13C isotopic ratio verses stellar mass for a few early-AGB Li-rich stars, including HD 150382. The theoretical curves were taken from Boothroyd & Sackmann (1999) and solid, dotted–dashed, and long-dashed lines represent, respectively, first and second dredge-up and CBP models. Colors refer to different metallicities, Z = 0.02 (yellow) and Z = 0.007 (dark blue). Despite the few data (we found in the literature only four with the 12C/13C isotopic ratio determined), the agreement between abundances of these objects with predictions by CBP is clear. The performance of CBP can be more easily seen in stars of lower mass and low metallicity, also envisaged by Boothroyd & Sackmann (1999). Finally, we emphasize the importance of determining mixer traces for lithium-enriched objects in the early-AGB stage.
Figure 7. 12C/13C ratio vs. stellar mass for early-AGB Li-rich stars. The theoretical curves are taken from Boothroyd & Sackmann (1999). Solid lines represent first dredge-up, dotted–dashed lines represent second dredge-up, and long-dashed lines represent cool bottom processing models. Colors refer to metallicities Z = 0.02 (yellow) and Z = 0.007 (dark blue).
Download figure:
Standard image High-resolution image
4. Conclusions
We estimated the age of 1.0 × 10⁹ yr and a mass of 2.20 M⊙ for HD 150382. In addition, this star is a low rotator having a metallicity close to solar, and has a low carbon isotopic ratio besides a lithium overabundance. Due to its luminosity and chemical composition, this giant is probably an early-AGB giant.
We determined that HD 150382 presents few process-s nuclei at the surface, which is in good concordance with dwarfs and clump RGB giants samples (Mishenina et al. 2006; Luck & Heiter 2007; Battistini & Bensby 2016). We also found high values for the [N/Fe] and [Na/Fe] ratios, but a low value for the [C/Fe] ratio. This abundance pattern is consistent with that expected for a material that has been subjected to mixing events. The other elements analyzed do not present any abnormality.
The existence of low-mass stars (<4.0 M⊙) at the early-AGB phase requires that an extra-mixing mechanism can simultaneously explain the chemical mixing tracers (e.g., 12C/13C, C, N, Li, and Na). In this context, we suggest that the CBP is responsible for the peculiar abundance peculiarities observed in HD 150382 and this may be supported by the 12C/13C value if compared with the models predicted by Boothroyd & Sackmann (1999).
N.H. thanks the Fundação Carlos Chagas Filho de Amparo à Pesquisa do Estado do Rio de Janeiro (FAPERJ) for financial support, grant 2019002307. N.A.D. acknowledges financial support by Russian Foundation for Basic Research (RFBR) according to the research projects 18-02-00554 and 18-52-06004. We are grateful to Ramiro de la Reza for his support in the preparation of this work, and to Karin Lind for making available the code to interpolate among the grid of NLTE corrections. We also thank the referee, Chris Sneden, for the valuable remarks that improved the paper. The use of the SIMBAD, VizieR, and VALD database is acknowledged.
Software: MOOG (Sneden 1973; Sneden et al. 2012), ATLAS9 (Kurucz 1993).
Appendix:
Table 5 shows the stellar spectroscopic parameters and abundances for comparison with our results. These stars are lithium-rich giants well-known in the literature. Table 6 shows the atomic lines used to derive the abundances of the elements.
Table 5. Properties of the Li-rich Giants Adopted for Comparison
| Name | Teff (K) | log g | [Fe/H] | log (Li) |
v sin i (km s−1) | 12C/13C | References |
|---|---|---|---|---|---|---|---|
| HD 150382a | 4070 | 1.35 | −0.09 | 2.10 | 3.7 | 18.0 | This work |
| HD 203136 | 5084 | 2.80 | +0.14 | 2.40 | 5.1 | 5.4 | TT17, ST00 |
| HD 232862 | 4938 | 3.79 | −0.20 | 2.57 | 20.2 | ⋯ | TT17 |
| HD 212430 | 4923 | 2.48 | −0.19 | 1.94 | 2.0 | ⋯ | TT17 |
| KIC 9821622 | 4923 | 2.91 | −0.25 | 1.85 | 1.9 | ⋯ | TT17 |
| HD 170527 | 4896 | 2.57 | −0.35 | 3.24 | 22.9 | ⋯ | TT17 |
| HD 12203 | 4842 | 2.49 | −0.32 | 2.14 | 2.0 | 7.5 | TT17, KR11 |
| HD 194937 | 4786 | 2.56 | −0.03 | 3.15 | 1.8 | ⋯ | TT17 |
| HD 8676 | 4774 | 2.53 | −0.11 | 3.81 | 1.8 | ⋯ | TT17 |
| HD 183492 | 4765 | 2.58 | +0.06 | 2.28 | 2.0 | ⋯ | TT17 |
| HD 167304 | 4761 | 2.43 | +0.04 | 2.79 | 2.8 | ⋯ | TT17, KR11 |
| HD 10437 | 4756 | 2.55 | +0.00 | 3.62 | 1.9 | ⋯ | TT17, KR11 |
| HD 214995 | 4626 | 2.43 | +0.04 | 3.06 | 4.9 | ⋯ | TT17 |
| PDS 100 | 4524 | 1.98 | −0.05 | 2.59 | 8.3 | 9.0 | TT17, DR02 |
| HD 6665 | 4524 | 2.61 | +0.28 | 2.8 | 5.2 | ⋯ | TT17 |
| HD 9746 | 4520 | 2.14 | −0.10 | 3.73 | 7.2 | 28.0 | TT17 |
| HD 30834 | 4283 | 1.79 | −0.24 | 2.63 | 2.3 | ⋯ | TT17 |
| HD 205349 | 4138 | 0.89 | −0.18 | 1.88 | 6.5 | ⋯ | TT17 |
| HD 787a | 3980 | 1.70 | +0.00 | 2.20 | 2.8 | 15.0 | DS95, TT17 |
| HD 37719 | 4650 | 2.40 | +0.09 | 2.70 | ⋯ | ⋯ | KR11 |
| HD 40168 | 4800 | 2.50 | +0.10 | 1.50 | ⋯ | ⋯ | KR11 |
| HD 51367 | 4650 | 2.55 | +0.20 | 2.58 | ⋯ | 8.5 | KR11 |
| HD 88476 | 5100 | 3.10 | −0.10 | 2.12 | ⋯ | 9.0 | KR11 |
| HD 107484 | 4640 | 2.50 | +0.18 | 2.04 | ⋯ | 12.5 | KR11 |
| HD 118319 | 4700 | 2.20 | −0.25 | 1.88 | ⋯ | ⋯ | KR11 |
| HD 133086 | 4940 | 2.98 | +0.02 | 2.03 | ⋯ | 7.0 | KR11 |
| HD 145457 | 4850 | 2.75 | −0.08 | 2.49 | ⋯ | 10.0 | KR11 |
| HD 150902 | 4690 | 2.55 | +0.09 | 2.64 | ⋯ | 5.0 | KR11 |
| IRAS 12327−6523a | 4200 | 1.25 | −0.40 | 1.60 | 7.5 | 6.0 | RL05 |
| IRAS 13539−4153 | 4300 | 2.25 | −0.13 | 4.10 | 5.0 | 20.0 | RL05 |
| IRAS 17596−3952 | 4600 | 2.50 | +0.10 | 2.20 | 35.0 | ⋯ | RL05 |
| HD 19745 | 4700 | 2.25 | −0.05 | 3.70 | 3.0 | 16.0 | RL05 |
| HD 31993 | 4500 | 2.50 | +0.00 | 1.70 | ⋯ | ⋯ | CA00 |
| HD 95799 | 4900 | 2.50 | +0.00 | 3.30 | ⋯ | ⋯ | CA00 |
| IRAS 19012-0747a | 3800 | 1.50 | +0.00 | 2.50 | ⋯ | ⋯ | CA00 |
| HD 77361 | 4580 | 2.50 | −0.02 | 3.82 | 2.8 | 4.3 | KR09 |
| HD 233517 | 4475 | 2.25 | −0.37 | 4.22 | ⋯ | ⋯ | KR09 |
| HD 219025 | 4500 | 2.30 | −0.10 | 3.00 | 23.0 | ⋯ | JA99 |
| HD 157457 | 4950 | 2.30 | −0.30 | 1.50 | 1.0 | ⋯ | JA99 |
| HD 16771 | 5050 | 2.70 | −0.12 | 2.67 | 3.7 | 12.0 | RL16 |
| HD 33789 | 5000 | 3.00 | −0.30 | 1.50 | 29.0 | ⋯ | FC93 |
| HD 39853a | 3900 | 1.16 | −0.50 | 2.80 | 3.1 | 7.0 | GD89 |
| PDS 365 | 4540 | 2.20 | −0.09 | 3.3 | 20.0 | 12.0 | DR02 |
| IRAS 12556−7731a | 3460 | 0.60 | −0.05 | 2.40 | 8.0 | ⋯ | AL11 |
| J 08095783−4701385 | 4964 | 2.43 | −0.15 | 3.21 | ⋯ | ⋯ | CA16 |
| J 08102116−4740125 | 4591 | 2.27 | −0.12 | 3.33 | ⋯ | ⋯ | CA16 |
| J 08110403−4852137 | 4762 | 2.59 | −0.12 | 3.25 | ⋯ | ⋯ | CA16 |
| J 08395152−5315159 | 4726 | 2.55 | +0.01 | 2.28 | ⋯ | ⋯ | CA16 |
| J 10300194−6321203 | 4612 | 2.37 | −0.06 | 2.88 | ⋯ | ⋯ | CA16 |
| J 10323205−6324012 | 4607 | 2.53 | +0.13 | 2.98 | ⋯ | ⋯ | CA16 |
| J 10495719−6341212 | 4789 | 2.55 | +0.03 | 2.94 | ⋯ | ⋯ | CA16 |
| J 10503631−6512237 | 4708 | 2.49 | −0.05 | 2.61 | ⋯ | ⋯ | CA16 |
| J 11000515−7623259 | 4505 | 2.22 | +0.06 | 2.64 | ⋯ | ⋯ | CA16 |
| J 18033785−3009201 | 4467 | 2.34 | +0.07 | 3.11 | ⋯ | ⋯ | CA16 |
| J 19230935+0123293 | 4845 | 2.37 | −0.12 | 2.75 | ⋯ | ⋯ | CA16 |
| J 19242472+0044106 | 4740 | 2.70 | +0.08 | 2.72 | ⋯ | ⋯ | CA16 |
| J 19252571+0031444 | 4825 | 2.87 | −0.10 | 2.22 | ⋯ | ⋯ | CA16 |
| J 19252758+0153065 | 4617 | 2.80 | +0.21 | 2.92 | ⋯ | ⋯ | CA16 |
| J 19252837+0027037 | 4731 | 2.91 | +0.18 | 2.82 | ⋯ | ⋯ | CA16 |
| J 19253819+0031094 | 4655 | 2.51 | −0.25 | 2.85 | ⋯ | ⋯ | CA16 |
| J 19261007−0010200 | 4752 | 2.84 | +0.12 | 2.88 | ⋯ | ⋯ | CA16 |
| J 19264038−0019575 | 4782 | 2.91 | +0.02 | 3.13 | ⋯ | ⋯ | CA16 |
| J 19301883−0004175a | 4 070 | 1.63 | −0.52 | 2.43 | ⋯ | ⋯ | CA16 |
| J 19304281+2016107 | 4766 | 2.63 | −0.10 | 2.60 | ⋯ | ⋯ | CA16 |
| J 08405643−5308309 | 4486 | 2.54 | −0.12 | 2.60 | ≤7.0 | ⋯ | SM18 |
| J 17522490−2927512 | 4644 | 2.80 | +0.18 | 2.42 | ≤7.0 | ⋯ | SM18 |
| J 17531013−2932063 | 4557 | 2.72 | +0.27 | 2.30 | ≤7.0 | ⋯ | SM18 |
| J 18181062−3246291 | 4558 | 2.27 | −0.03 | 2.30 | 2.5 | ⋯ | SM18 |
| J 18182698−3242584 | 4425 | 2.33 | +0.10 | 4.04 | 6.0 | ⋯ | SM18 |
| J 18265248+0627259 | 4982 | 2.88 | −0.08 | 2.69 | 37.1 | ⋯ | SM18 |
| J 19251759+0053140 | 4621 | 2.78 | +0.36 | 2.24 | ≤7.0 | ⋯ | SM18 |
| J 19223053+0138518 | 4579 | 2.49 | +0.26 | 2.27 | ≤7.0 | ⋯ | SM18 |
| J 19261134+0051569 | 4745 | 2.47 | −0.53 | 3.25 | 7.5 | ⋯ | SM18 |
| J 19263808+0054441 | 4655 | 2.82 | +0.38 | 2.29 | 12.0 | ⋯ | SM18 |
| J 19264134+0137595 | 4645 | 2.56 | +0.28 | 3.45 | ≤7.0 | ⋯ | SM18 |
| J 19264917−0027469 | 4458 | 2.19 | −0.39 | 3.33 | 7.1 | ⋯ | SM18 |
| J 19265013+0149070 | 4770 | 2.68 | −0.50 | 3.32 | 13.2 | ⋯ | SM18 |
| J 19265193+0044004 | 4880 | 2.54 | −0.33 | 2.80 | 2.1 | ⋯ | SM18 |
| J 19270600+0134446 | 4584 | 2.38 | +0.19 | 3.53 | ≤7.0 | ⋯ | SM18 |
| J 19270815+0017461 | 4514 | 2.28 | −0.29 | 2.37 | 7.8 | ⋯ | SM18 |
| J 19273856+0024149 | 4446 | 2.39 | −0.16 | 2.37 | 12.0 | ⋯ | SM18 |
| J 19274706+0023447 | 4608 | 3.21 | +0.13 | 2.70 | 18.0 | ⋯ | SM18 |
| J 19280508+0100139 | 4623 | 2.49 | +0.11 | 3.49 | 8.2 | ⋯ | SM18 |
| J 19283226+0033072 | 4600 | 2.64 | +0.29 | 3.46 | ≤7.0 | ⋯ | SM18 |
Notes. The reference codes are as follows. TT17: Takeda & Tajitsu (2017); ST00: Strassmeier et al. (2000); GD89: DS95; da Silva et al. (1995): Gratton & D'Antona (1989); RL05: Reddy & Lambert (2005); RL16: Reddy & Lambert (2016); KR: Kumar & Reddy (2009); KR11: Kumar et al. (2011); CA00: Castilho et al. (2000); DR02: Drake et al. (2002); AL11: Alcalá et al. (2011); CA16: Casey et al. (2016); SM18: Smiljanic et al. (2018).
aObjects in the early-AGB stage.Table 6. List of Spectral Lines with Atomic Parameters and Equivalent Width (EW)
| Element | λ(Å) | χ(eV) | log gf | EW (mÅ) |
|---|---|---|---|---|
| Mg i | 5711.10 | 4.34 | −1.750 | 154 |
| 6319.24 | 5.11 | −2.160 | 76 | |
| 6319.49 | 5.11 | −2.670 | 36 | |
| 8712.69 | 5.93 | −1.260 | 69 | |
| 8736.04 | 5.94 | −0.340 | 144 | |
| Al i | 6696.03 | 3.14 | −1.481 | 119 |
| 6698.67 | 3.14 | −1.630 | 95 | |
| 7835.32 | 4.04 | −0.580 | 93 | |
| 7836.13 | 4.02 | −0.400 | 111 | |
| 8772.88 | 4.02 | −0.250 | 138 | |
| Ca i | 5867.57 | 2.93 | −1.610 | 90 |
| 6798.47 | 2.71 | −2.520 | 66 | |
| Ti i | 4758.12 | 2.25 | +0.420 | 138 |
| 5295.78 | 1.05 | −1.631 | 139 | |
| 6091.18 | 2.27 | −0.370 | 125 | |
| Cr i | 4936.34 | 3.11 | −0.250 | 123 |
| 4953.71 | 3.12 | −1.480 | 60 | |
| 5241.45 | 2.71 | −1.921 | 66 | |
| 5272.01 | 3.45 | −0.420 | 90 | |
| 5287.20 | 3.44 | −0.870 | 75 | |
| 5628.62 | 3.42 | −0.740 | 76 | |
| 5719.81 | 3.01 | −1.580 | 66 | |
| 5787.04 | 3.01 | −1.551 | 74 | |
| 5844.59 | 3.01 | −1.772 | 67 | |
| 5884.43 | 3.01 | −1.860 | 56 | |
| Fe i | 4988.95 | 4.15 | −0.790 | 113 |
| 5002.79 | 3.40 | −1.440 | 140 | |
| 5031.91 | 4.37 | −1.520 | 71 | |
| 5253.03 | 2.28 | −3.790 | 99 | |
| 5315.05 | 4.37 | −1.400 | 77 | |
| 5373.71 | 4.47 | −0.710 | 112 | |
| 5417.03 | 4.42 | −1.530 | 71 | |
| 5441.34 | 4.31 | −1.580 | 82 | |
| 5560.21 | 4.43 | −1.040 | 85 | |
| 5584.77 | 3.57 | −2.170 | 93 | |
| 5635.82 | 4.26 | −1.740 | 73 | |
| 5638.26 | 4.22 | −0.720 | 131 | |
| 5691.50 | 4.30 | −1.370 | 81 | |
| 5705.47 | 4.30 | −1.360 | 85 | |
| 5717.83 | 4.28 | −0.979 | 107 | |
| 5731.76 | 4.26 | −1.150 | 108 | |
| 5814.81 | 4.28 | −1.820 | 69 | |
| 5934.65 | 3.93 | −1.020 | 132 | |
| 6027.05 | 4.08 | −1.090 | 111 | |
| 6093.64 | 4.61 | −1.350 | 60 | |
| 6096.66 | 3.98 | −1.780 | 85 | |
| 6120.25 | 0.91 | −5.950 | 109 | |
| 6165.36 | 4.14 | −1.470 | 89 | |
| 6187.99 | 3.94 | −1.570 | 100 | |
| 6311.50 | 2.83 | −3.230 | 98 | |
| 6392.54 | 2.28 | −4.030 | 104 | |
| 6436.41 | 4.19 | −2.460 | 44 | |
| 6551.68 | 0.99 | −5.790 | 117 | |
| 6608.03 | 2.28 | −4.030 | 100 | |
| 6653.85 | 4.14 | −2.520 | 37 | |
| 6703.57 | 2.76 | −3.160 | 120 | |
| 6704.48 | 4.22 | −2.660 | 30 | |
| 6739.52 | 1.56 | −4.950 | 109 | |
| 6793.26 | 4.07 | −2.470 | 56 | |
| 7132.99 | 4.08 | −1.610 | 100 | |
| Fe ii | 5284.10 | 2.89 | −3.010 | 74 |
| 5325.56 | 3.22 | −3.170 | 48 | |
| 5425.25 | 3.20 | −3.210 | 50 | |
| 6247.55 | 3.89 | −2.340 | 38 | |
| 6432.68 | 2.89 | −3.580 | 47 | |
| Ni i | 5003.75 | 1.68 | −3.070 | 113 |
| 5010.94 | 3.63 | −0.979 | 78 | |
| 5035.36 | 3.64 | +0.290 | 148 | |
| 5157.98 | 3.61 | −1.510 | 60 | |
| 6007.31 | 1.68 | −3.400 | 108 | |
| 6176.82 | 4.09 | −0.260 | 97 | |
| 6177.25 | 1.83 | −3.460 | 90 | |
| 6204.61 | 4.09 | −1.080 | 60 | |
| 6223.99 | 4.11 | −0.910 | 63 | |
| 6378.26 | 4.15 | −0.821 | 68 | |
| Y ii | 5087.43 | 1.08 | −0.170 | 119 |
| 5 289.81 | 1.03 | −1.850 | 47 | |
| Zr i | 4772.30 | 0.62 | −0.060 | 114 |
| 4784.94 | 0.69 | −0.600 | 93 | |
| 4805.87 | 0.69 | −0.580 | 85 | |
| 4828.05 | 0.62 | −0.750 | 82 | |
| 5046.55 | 1.53 | −0.180 | 52 | |
| 5385.13 | 0.52 | −0.640 | 99 | |
| 5437.77 | 0.15 | −2.120 | 67 | |
| 5620.13 | 0.52 | −1.090 | 86 | |
| 6032.60 | 1.48 | −0.350 | 39 | |
| 6127.46 | 0.15 | −1.060 | 130 | |
| 6134.57 | 0.00 | −1.280 | 125 | |
| 6140.46 | 0.52 | −1.410 | 58 | |
| 6143.18 | 0.07 | −1.100 | 134 | |
| Ce ii | 4562.37 | 0.48 | +0.330 | 108 |
| 5274.24 | 1.04 | +0.130 | 68 | |
| 6043.37 | 1.21 | −0.480 | 33 | |
| Nd ii | 4947.02 | 0.56 | −1.130 | 37 |
| 5089.83 | 0.20 | −1.160 | 76 | |
| 5092.79 | 0.38 | −0.610 | 74 | |
| 5276.87 | 0.86 | −0.440 | 51 | |
| 5356.97 | 1.26 | −0.280 | 34 |
Footnotes
- *
Based on the observations made with the 2.2 m telescope at the European Southern Observatory (La Silla, Chile) under the agreement with Observatório Nacional and under agreement between Observatório Nacional and Max-Planck Institute für Astronomie.