


Abstract
We report radar observations of near-Earth asteroid 2013 BS45 obtained during the 2013 apparition. This object is in a resonant, Earth-like orbit, and it is a backup target for NASA's NEA Scout mission. 2013 BS45 belongs to the Arjuna orbital domain, which currently has ∼20 discovered representatives. These objects tend to be small and difficult to characterize, and 2013 BS45 is only the third Arjuna object observed with radar to date. We observed 2013 BS45 on three days at Goldstone (8560 MHz, 3.5 cm) between 2013 February 10 and 13. The closest approach occurred on February 12 at a distance of 0.0126 au. We obtained relatively weak echo power spectra and ranging data at resolutions up to 0.125 μs (18.75 m px−1). The Doppler broadening of the echo power spectra strongly suggests an upper bound on the rotation period of 1.9 minutes. The radar data, in combination with an assumption that the asteroid's radar albedo is no higher than that of metallic NEA 1986 DA, constrain the equivalent diameter to 15 m ≤ D ≤ 38 m. The circular polarization ratio is 0.21 ± 0.06, which implies a near-surface that is relatively smooth on decimeter spatial scales. We bounded the OC radar albedo to ηOC ≥ 0.09 and the optical albedo remains relatively unconstrained at 0.05 ≤ pV ≤ 0.35. The Yarkovsky acceleration has not been detected but, due to the object's rapid rotation, would be dominated by a seasonal component whose direction and magnitude depends on the currently unknown pole orientation and thermal inertia.
Export citation and abstract BibTeX RIS
1. Introduction
Near-Earth asteroid (NEA) 2013 BS45 was discovered on 2013 January 20 by J. V. Scotti with the 0.9 m Spacewatch telescope at Steward Observatory (MPEC 2013-B72). The asteroid has an absolute magnitude of H = 25.9 (JPL Horizons database: https://ssd.jpl.nasa.gov/horizons.cgi, Giorgini et al. 1996), but no other physical properties are known. There are no light curves or visible-infrared spectra measured for this object. Prior to the radar experiment, we guessed a diameter of ∼20 m from the asteroid's absolute magnitude and by assuming an optical albedo of 0.2.
2013 BS45 is currently the main backup target for the NEA Scout mission (Pezent et al. 2018). The primary target of NEA Scout is another small asteroid, 1991 VG, with an absolute magnitude of H = 28.3. The Pezent et al. (2018) dynamical study also considered 2013 RZ53, 2007 UN12, and 2008 EA9 as backup targets. Only 1991 VG and 2013 BS45 have well determined orbits, with Orbit Condition Code of 0, according to the JPL Horizons database.
NEA Scout will be launched as a secondary payload on NASA's Space Launch Vehicle Exploration Mission One in 2019 December. The spacecraft could reach 1991 VG within 2 yr and 2013 BS45 within 3.5 yr (Pezent et al. 2018). 2013 BS45 has the brightest absolute magnitude and may be the largest object among the potential NEA Scout destinations, and it is the only candidate target for which radar observations exist. 2013 BS45 is also on the Near-Earth Object Human Space Flight Accessible Targets Study list (https://cneos.jpl.nasa.gov/nhats/) where it ranks among the most accessible objects with an Orbit Condition Code of 0.
2013 BS45 has an Earth-like orbit with a semimajor axis, a, of 0.99 au, eccentricity, e, of 0.08, and an inclination, i, of 0 8. It belongs to the Aten class of NEAs. When viewed in a rotating reference frame that follows Earth around the Sun, the orbit is shaped like a horseshoe with Earth located between the ends (Figure 1). One of us (P. W. Chodas 2018, personal communication) noted the asteroid's resonant behavior only 4 days after the asteroid's discovery. de la Fuente Marcos & de la Fuente Marcos (2013) were the first to publish a dynamical study of the 2013 BS45's orbit. They noted that the asteroid would remain in a symmetric horseshoe orbit for about 1000 yr with a libration period of ∼160 yr. The most recent close approach was at 0.0126 au on 2013 February 12 shortly after the asteroid's discovery. Here we report radar observations that put constraints on the diameter, period of rotation, optical albedo, and radar scattering properties for this object.
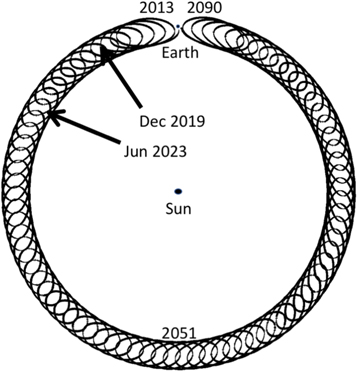
Figure 1. Orbit of 2013 BS45 as viewed within a reference frame co-rotating with Earth with the Sun at the center. Assuming a 2019 December launch, NEA Scout has average transfer times between 95 and 1263 days (∼3.5 yr; Table 3 in Pezent et al. 2018). We highlight the locations of the asteroid in 2019 December, an approximate launch date, and in 2023 June, the latest possible arrival date.
Download figure:
Standard image High-resolution image2. Radar Observations
2013 BS45 approached Earth within 0.0126 au (4.9 lunar distances) on 2013 February 12, only three weeks after its discovery. Assuming a purely ballistic trajectory, the 2013 flyby was the closest in more than 230 yr and for at least the next 300 yr. We observed it at Goldstone (8560 MHz, 3.5 cm) on February 10, 12, and 13 (Table 1) as a target-of-opportunity during time originally scheduled to observe (3752) Camillo. 2013 BS45 was too far north for Arecibo to observe it during the week of the closest approach, and planned observations at Arecibo on February 14–18 were canceled due to equipment problems.
Table 1. Masterlog of Goldstone Radar Observations
| Date | Time Range | (UTC) | Setup | Baud | Code | Resolution | Runs | R.A. | Decl. | Distance | Sol |
|---|---|---|---|---|---|---|---|---|---|---|---|
| START | STOP | ||||||||||
| hh:mm:ss | hh:mm:ss | (μs) | (Hz) | (°) | (°) | (au) | |||||
| Feb 10 | 07:40:19 | 08:45:05 | Doppler | ⋯ | ⋯ | 20.0 | 137 | 225.7 | 45.6 | 0.013 | 14 |
| Feb 12 | 10:18:00 | 10:30:52 | Doppler | ⋯ | ⋯ | 20.0 | 30 | 249.5 | 43.6 | 0.013 | 18 |
| 10:34:00 | 10:44:33 | Ranging | 10 | 127 | 25.0 | 25 | 18 | ||||
| 10:48:11 | 11:07:36 | Ranging | 11 | 127 | 22.0 | 45 | 18 | ||||
| 11:14:39 | 11:31:47 | Ranging | 1 | 1023 | 31.0 | 40 | 20 | ||||
| 11:36:56 | 12:04:54 | Ranging | 10 | 255 | 25.0 | 65 | 20 | ||||
| Feb 13 | 09:15:17 | 09:50:24 | Doppler | ⋯ | ⋯ | 20.0 | 72 | 259.7 | 41.1 | 0.013 | 22 |
| 10:47:07 | 11:32:31 | Ranging | 10 | 127 | 25.0 | 48 | 22 | ||||
| 11:16:38 | 11:32:31 | Ranging | 1 | 255 | 31.0 | 37 | 22 | ||||
| 11:39:38 | 12:10:22 | Imaging | 0.125 | 255 | 40.0 | 71 | 22 |
Note. Observations were conducted monostatically at X-band (8560 MHz, 3.5 cm, Goldstone). The times show the start and end of the reception of echoes for each set-up on each day. The set-ups were Doppler-only CW echo power spectra or binary phase-coded imaging and ranging. For the imaging and ranging set-ups, we list the baud (time-delay resolution in μs) and the code length "Code", which refers to the length of the repeating binary phase code. "Runs" indicates the number of transmit-receive cycles used in a specified set-up. We also list R.A., decl., distance (in au) at the start of each observing session, and the orbital solution (Sol) used to compute the delay-Doppler ephemeris predictions. The transmit power was within 10% of 440 kW. The on-point system temperature was 18 K ± 1 K for February 10 and 13. We did not record system temperatures on February 12, but based on the elevation and previous observations, the system temperature was likely a few degrees cooler.
Download table as: ASCIITypeset image
Based on the close approach distance, a diameter that we assumed would be roughly 20 m, and an assumed period of 0.5 hr, we estimated maximum signal-to-noise ratios (S/Ns) for 2013 BS45 of 160 per day. We expected to obtain echo power spectra, ranging measurements, and possibly delay-Doppler images.
We used two observing set-ups: an unmodulated continuous waveform (CW) and a binary phase-coded (BPC) CW. We transmitted a circularly polarized electromagnetic wave that reflects off the target in both the same (SC) and opposite (OC) sense of circular polarization as the transmitted wave. Echoes from a surface that is smooth at decimeter scales will return almost entirely in the OC polarization. SC echoes can result from multiple scattering from rough surfaces, single scattering from surfaces with radii of curvature comparable to the radar wavelength, and from coherent backscattering. The ratio of the echo power strengths, SC/OC, is a proxy for the target's near-surface complexity or roughness (Ostro et al. 2002).
The target's rotation spreads the reflected signal in Doppler frequency. The Doppler broadening or bandwidth of the echo is defined as

where B is the bandwidth, P is the rotation period, D is the diameter, λ is the radar wavelength, and δ is the subradar latitude.
We started observing 2013 BS45 on February 10 with a CW set-up (Table 1). The echo bandwidth was at least 120 Hz, and we updated the JPL orbital solution 14 with a Doppler correction of +40 Hz (Table 4). On the second day, we obtained 10, 11, and 1 μs ranging detections with our BPC set-up. These observations are coarse-resolution imaging that puts the echo into 1–2 pixels for the purpose of improving the orbital solution. On the last day, February 13, we obtained more CW echo power spectra and ranging data at resolutions up to 0.125 μs (18.75 m). Table 1 summarizes the observations.
Figures 2(A) and (C) show daily sums of echo power spectra obtained on February 10, 12, and 13 processed with 10 Hz and 20 Hz resolutions, respectively. The OC echoes appear fairly symmetric and have weak S/Ns. The low S/Ns precluded subdividing the data to look for bandwidth variations and other features. The asteroid traversed 25° across the sky on February 10–13, but the spectra do not show obvious bandwidth changes that would suggest a shift in the subradar latitude (Equation (1)).
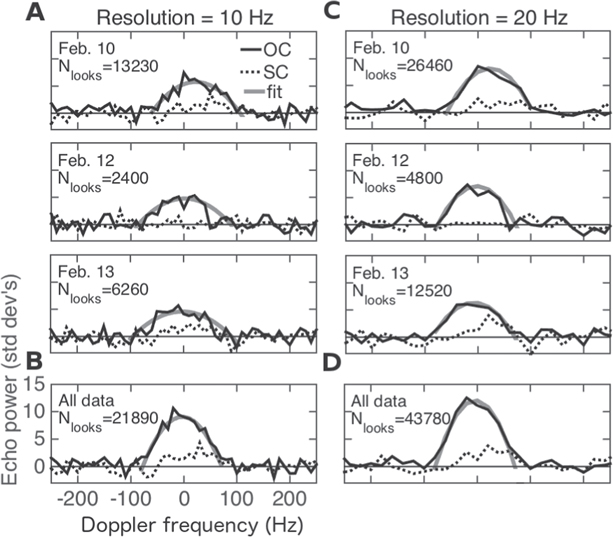
Figure 2. (A) OC (solid line) and SC (dashed line) echo power spectra from 2013 February 10, 12, and 13. Each spectrum is a daily sum with start-stop times listed in Table 1. The sums average 65, 13, and 35 minutes of data. The data were processed with 10 Hz resolution. The February 10 echo is not centered at 0 Hz because the orbital solution used for the data reduction on this first day of observations had a Doppler correction. The number of statistically independent measurements (or "looks") is given in each frame. The thick gray line represents a polynomial fit to the OC spectra discussed in Section 2. (B) The weighted sum of data from February 10–13 processed with 10 Hz resolution. (C) The daily echo power spectra processed with 20 Hz resolution. (D) The weighted sum of data from Feb. 10–13 processed with 20 Hz resolution.
Download figure:
Standard image High-resolution imageTable 2 lists echo bandwidths from each day estimated by eye and by fitting curves to the spectra reduced at 10 and 20 Hz resolutions. The bandwidths were estimated by first fitting a second-order polynomial to the adjacent points that have S/Ns above 2, followed by determining the width where the fit crosses the 2σ line. This is a very conservative approach, and we treat the results as lower bounds. For completeness, we also include in Table 2 the bandwidth measurements based on the zero-σ crossing based on both fits and estimated by eye.
Table 2. Goldstone Echo Bandwidths
| Date | Fit-10 Hz | Visual-10 Hz | Fit-20 Hz | Visual-20 Hz | ||||
|---|---|---|---|---|---|---|---|---|
| 2σ | 0σ | 2σ | 0σ | 2σ | 0σ | 2σ | 0σ | |
| (Hz) | (Hz) | (Hz) | (Hz) | (Hz) | (Hz) | (Hz) | (Hz) | |
| Feb 10 | 130 | (160) | 130 | (210) | 140 | (160) | 140 | (200) |
| Feb 12 | 130 | (170) | 110 | (120) | 120 | (140) | 100 | (120) |
| Feb 13 | 130 | (180) | 110 | (150) | 120 | (140) | 120 | (180) |
| All data | 130 | (140) | 130 | (190) | 120 | (140) | 140 | (180) |
Note. Lower bounds on the Doppler bandwidths of the echo power spectra shown in Figure 2. "Fit-10 Hz" represents the measured bandwidths of the second-degree polynomial curve fits to the data processed with 10 Hz resolution (Figure 2(A)). Bandwidths were measured at the 2σ and zero-σ levels and rounded to the nearest, lower resolution bin. For example, a measured bandwidth of 134 Hz for 10 Hz would be rounded off to 130 Hz, but for 20 Hz resolution, it would be rounded off to 120 Hz. "Visual-10 Hz" lists visually estimated bandwidths, measured based on where the data crossed the 2σ and zero-σ levels. "Fit-20 Hz" represents the bandwidth measurements of the polynomial fits to the data processed with 20 Hz resolution and "Visual-20 Hz" is the visually estimated bandwidth (Figure 2(C)). The last line lists the measured bandwidths based on the weighted sum of the data from February 10, 12, and 13 (Figures 2(B) and (D)).
Download table as: ASCIITypeset image
The 10 and 20 Hz resolution data yield daily bandwidths of at least 120 Hz (Table 2) based on polynomial fits and the 2σ threshold. For comparison, bandwidths estimated visually based on where the data points cross the 2σ threshold are at least 100 Hz. We summed all available data from February 10–13 to increase the S/Ns, and the final sums are shown in Figures 2(B) and (D). The lower bandwidth estimates from the fits are 130 Hz for 10 Hz resolution data and 120 Hz for 20 Hz resolution data. The visually estimated values are 130 and 140 Hz for the two processing resolutions. The differences in the fitted and visually estimated bandwidths are caused by the shape of the second-degree polynomial function that is only a rough approximation of the true shape of the echo. We repeated this entire analysis with the zero-σ cut-off and we found that the lower bandwidth estimate would have increased by at least 10 Hz. For echoes with strong S/Ns, the edge frequencies are usually obvious, but for weak S/Ns such as those here, receiver noise obscures the edges.
Let us adopt a bandwidth of 120 Hz as a conservative lower bound and explore its implications for the rotation period and diameter. We can obtain an approximate diameter using an expression from Harris & Harris (1997):

where H is the absolute magnitude and pV is the optical albedo. If we use H = 25.9 and adopt pV = 0.20, which is a typical S-class albedo (Pravec et al. 2012), then we obtain D = 20 m. If we combine this diameter with the lower bound on the bandwidth of 120 Hz, then Equation (1) strongly suggests that 2013 BS45 is a very rapid rotator with a period that could be less than one minute. If 2013 BS45 is larger than 20 m, then the rotation period could be slower, but it seems unlikely that the period is much slower than several minutes.
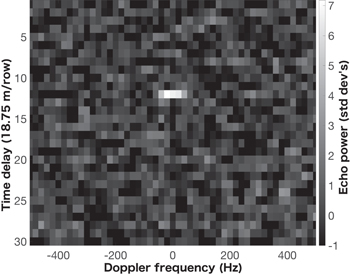
The rotation period can be refined if we have radar constraints on the object's size. The 18.75 m resolution image from February 13 shows an echo that occupied a single row after ∼30 minutes of data integration (Figure 3). If the asteroid were a sphere, then the visible extent would correspond to its radius. If we assume that 2013 BS45 is a sphere, then its diameter is at most 37.5 m.
Figure 3. Delay-Doppler image from 2013 February 13. The image is a sum of 71 runs spanning about 31 minutes (Table 1) and is normalized so that the noise has zero mean and unit standard deviation. The Doppler resolution is 20 Hz and the time-delay (range) resolution is 0.125 μs (18.75 m). Time delay increases from top to bottom, and Doppler frequency increases from left to right. The vertical bar on the right shows the echo power scale in standard deviations of the noise.
Download figure:
Standard image High-resolution image
If we assume D ≤ 37.5 m, then Equation (1) places an upper bound on the period of P ≤ 1.9 minutes × cos (δ). According to the Asteroid Lightcurve Database (http://www.MinorPlanet.info/lightcurvedatabase.html, Warner et al. 2009, 2018 June 23 update), 2013 BS45 is in the top 14% among the most rapidly rotating NEAs with H ≥ 23.
3. Disk-integrated Properties and Optical Albedo
Table 3 lists the disk-integrated properties. The OC cross-section obtained from a weighted sum of all the data is  = 1.0 × 10⁻⁴ km2 ± 35%. We assigned a 35% error in order to account for systematic calibration and pointing errors (Benner et al. 1997; Ostro et al. 2003) such as small deviations from the OC system temperature of 18 K that we adopted in the radar cross-section calculations.
Table 3. Disk-integrated Properties
| Date | Runs | Looks | RTT | OC | σOC × 10−4 | SC/OC |
|---|---|---|---|---|---|---|
| UTC | (s) | S/N | (km2) | |||
| Feb 10 | 137 | 26460 | 12.9 | 16 | 1.0 | 0.23 ± 0.07 |
| Feb 12 | 30 | 4800 | 12.5 | 12 | 1.4 |

|
| Feb 13 | 72 | 12520 | 12.7 | 13 | 1.0 | 0.27 ± 0.09 |
| All data | 239 | 43780 | ⋯ | 22 | 1.0 | 0.21 ± 0.0.05 |
Note. Disk-integrated radar properties. σOC is the OC radar cross-section and SC/OC is the circular polarization ratio estimated from the echo power spectra processed with 20 Hz resolution (Figure 2(C)). We adopted the OC system temperature of 18 K and the SC system temperature of 19 K in our calculations. The 1σ errors on the SC/OC values were calculated based on Appendix I in Ostro et al. (1983). We list the number of runs and number of looks for the start-stop times listed in Table 1. We list the round-trip time to the object at the time of the observations. OC S/Ns are the optimally filtered S/Ns for the OC echo power spectra. The last line, All Data, shows values calculated from a weighted sum of all the data (Figure 2(D)). The OC radar albedo (ηOC) is calculated by dividing the weighted sum radar cross-section by the object's projected surface area, which was calculated by approximating the asteroid's shape with a sphere with a diameter of 37.5 m, the maximum value consistent with our imaging data. OC radar albedo ηOC = σOC/Area ≥ 0.09.
Download table as: ASCIITypeset image
Table 3 also lists the circular polarization ratio, SC/OC, for each day. The values show significant variations from day-to-day, which is often seen for NEAs with low S/Ns (Benner et al. 1997; Brozović et al. 2018). The SC/OC value from a weighted average of all the data is 0.21 ± 0.05. For the SC/OC error, most systematic effects cancel, and the remaining uncertainty is largely statistical and stems from the receiver noise (Ostro et al. 1983). For comparison, the mean SC/OC for 214 NEAs reported by Benner et al. (2008) is 0.34 ± 0.25 and for 27 objects within the same study with an H > 23, SC/OC = 0.28 ± 0.23. 2013 BS45 has a slightly lower value of SC/OC than most NEAs implying a near-surface that is relatively smooth on decimeter spatial scales.
Benner et al. (2008) found that the C-class taxonomy has SC/OC = 0.28 ± 0.12 (N = 17), the S class has SC/OC = 0.27 ± 0.08 (N = 70), while the E, V, and X taxonomies have a mean SC/OC > 0.6. As such, the circular polarization ratio suggests that 2013 BS45 could be an S-class or C-class object, and it probably excludes the V and E classes. For comparison, the SC/OC of three NEAs visited by spacecraft are 0.28 ± 0.06 for 433 Eros (Magri et al. 2001), 0.29 ± 0.01 for 4179 Toutatis (Ostro et al. 1999), and 0.27 ± 0.04 for 25143 Itokawa (Benner et al. 2008). SC/OC for future spacecraft targets are 0.19 ± 0.03 for 101955 Bennu (Nolan et al. 2013) and 0.20 ± 0.02 for 65803 Didymos (Benner et al. 2008).
We obtain a lower bound on the OC radar albedo of ηOC ≥ 0.09 by dividing the weighted sum of the OC cross-section, 1.0 × 10⁻⁴ km2, by the projected area of a sphere with an equivalent diameter set to an upper bound of the object's size. For comparison, the average OC albedo calculated from 40 NEAs that have been observed by radar and that have an estimate of their sizes is ηOC = 0.20 ± 0.12, https://echo.jpl.nasa.gov/~lance/asteroid_radar_properties/nea.html).
The nominal OC radar cross-section can be used to constrain the diameter of 2013 BS45 if we assume some extreme values of the radar albedo. If we adopt a very low radar albedo of 0.02, similar to that reported for NEA 1566 Icarus (Greenberg et al. 2017), then we get an upper bound on the diameter of D ≤ 80 m. If we adopt a very high radar albedo of 0.58, equal to the value reported for a metallic NEA (6178) 1986 DA (Ostro et al. 1991) as our upper bound on ηOC, then we get a lower bound on the diameter of D ≥ 15 m. We can exclude the diameter of ∼80 m computed from assuming the low radar albedo value based on the range extent in the 18.75 m resolution image, but the diameter of ∼15 m obtained from the high radar albedo value is not excluded by the data, and it represents a reasonable lower bound on the object's size.
We can constrain the visual geometric albedo from the bounds on the equivalent diameter, 15 m ≤ D ≤ 37.5 m, and the absolute visual magnitude of H = 25.9. The optical albedo calculated using Equation (2) gives 0.05 ≤ pV ≤ 0.35. The wide range of optical albedos allowed does not rule out any of the spectral classes.
4. Orbit Refinement
Table 4 lists three Doppler and three delay radar measurements and their residuals with respect to the final orbital solution 32. The Doppler measurements were estimated based on the polynomial fits shown in Figure 2. The Doppler measurements in Table 4 replaced a single Doppler measurement that was estimated visually during the observations on February 10. The round-trip delay measurements are those reported during the track. At the time of the observations, the radar astrometry reduced the 3σ time-delay uncertainties by a factor of ∼3200.
Table 4. Goldstone Radar Astrometry
| UTC Epoch of | Measurement | σ | resid. | Nresid. | Measurement | σ | resid. | Nresid. |
|---|---|---|---|---|---|---|---|---|
| Received Echo | RT-delay (s) | (μs) | (μs) | Doppler (Hz) | (Hz) | (Hz) | ||
| 2013 Feb 10.333333 | ⋯ | ⋯ | ⋯ | ⋯ | 54882.518 | 20.0 | −0.016 | 0.001 |
| 2013 Feb 12.430556 | ⋯ | ⋯ | ⋯ | ⋯ | 5127.273 | 20.0 | −10.545 | 0.527 |
| 2013 Feb 13.395833 | ⋯ | ⋯ | ⋯ | ⋯ | −15798.710 | 20.0 | −7.214 | 0.361 |
| 2013 Feb 12.451389 | 12.53490436 | 10.0 | −1.123 | 0.112 | ⋯ | ⋯ | ⋯ | ⋯ |
| 2013 Feb 12.472222 | 12.5342533 | 2.0 | 0.073 | 0.037 | ⋯ | ⋯ | ⋯ | ⋯ |
| 2013 Feb 13.500000 | 12.763368 | 0.25 | 0.000 | 0.000 | ⋯ | ⋯ | ⋯ | ⋯ |
Note. Entries report the measured round-trip delay time in seconds and measured Doppler frequency-shift in Hertz for echoes relative to the 2013 BS45 estimated center-of-mass (COM) and received at the indicated UTC epoch. The reference point at Goldstone/DSS-14 is the intersection of the azimuth and elevation axes. The assigned measurement uncertainties, σ, reflect imaging and frequency resolution, echo strength, and COM location uncertainties. 1 μs of round-trip delay corresponds to 150 m in distance; 1 Hz in Doppler frequency-shift corresponds to ∼17.5 mm s−1 in radial velocity at the 8560 MHz transmitter frequency. Residuals ("resid.") are the difference between the measurement and the prediction of best-fit orbit solution s32 (observed–computed). "Nresid." is the residual normalized by the measurement uncertainty assigned by the observer. The radar astrometry is available from the Radar Astrometry Database at https://ssd.jpl.nasa.gov/?radar.
Download table as: ASCIITypeset image
Our orbital model uses the DE431 planetary ephemeris, an Earth J2 oblateness model, and 16 asteroid perturbers. Earth-encounter predictability using the ballistic (gravity-only) dynamics was extended by 75 yr due to radar astrometry from 1777–2247 to 1777–2322. The interval of predictability is almost certainly shorter due to a Yarkovsky acceleration not characterized by the current short-measurement arc but likely to exist at some level. The next close approach will occur in 2090 September, as the asteroid completes another libration cycle in its horseshoe orbit.
2013 BS45's one-year data arc is too short to be sensitive to the Yarkovsky effect. In trial solutions with the revised radar astrometry, the 1σ uncertainty for the result is three times larger than the estimated value itself: A2 = (−1.24787029063 ± 3.172336) × 10−12 au d−2. 2013 BS45 is a rapid rotator, and the diurnal component of the Yarkovsky effect can be expected to average out due to the surface being nearly in thermal equilibrium. The Yarkovsky effect will be dominated by a seasonal component whose magnitude depends on the pole orientation and thermal inertia, which are unknown.
5. Discussion
A number of near-Earth objects with a resonant behavior similar to 2013 BS45 have been studied: 3753 Cruithne (Wiegert et al. 1997), 54509 YORP (Wiegert et al. 2002; Margot & Nicholson 2003), 2001 GO2 (Brasser et al. 2004), 2002 AA29 (Connors et al. 2002; Ostro et al. 2003; Brasser et al. 2004), and (419624) 2010 SO16 (Christou & Asher 2011). 2013 BS45 belongs to the Arjuna orbital domain defined by 0.985 au < a < 1.013 au, e < 0.1, and i < 856. The JPL Small-Body Database Search Engine (https://ssd.jpl.nasa.gov/sbdb_query.cgi) lists 21 Arjuna-class objects discovered to date, and of those, 2013 BS45 has the fifth brightest absolute magnitude.
5.1. Rapid Rotation of 2013 BS45
The Asteroid Lightcurve Database (http://www.MinorPlanet.info/lightcurvedatabase.html, Warner et al. 2009, 2018 June 23 update) lists 284 NEAs with H ≥ 23, and among these, at least 38% rotate with periods faster than 10 minutes. The fast rotation of 2013 BS45 could be a consequence of collisions (Asphaug et al. 1998), spin-up due to the Yarkovsky–O'Keefe–Radzievskii–Paddack effect (YORP; Rubincam 2000; Bottke et al. 2002), and/or due to tides during close planetary encounters (Scheeres et al. 2000, 2004).
What does rapid rotation imply for the internal structure of 2013 BS45? To date, there have been many experimental and modeling studies that investigated how the spin of asteroids relates to their shapes, sizes, and internal properties (see Scheeres et al. 2015 for a review). If 2013 BS45 were a "classic" rubble pile (Harris 1996; Harris et al. 2009), then it would need to have gravitational acceleration at the equator balanced by the centrifugal force, resulting in an unphysical value for the bulk density of at least 1100 g cm−3. A first-order conclusion would be that 2013 BS45 is a monolithic body bound by tensile strength. However, Sánchez & Scheeres (2014) showed that weak cohesive forces play a significant role between rubble-pile components and that not all small, rapidly rotating asteroids are necessarily monolithic boulders. Based on Equation (24) in Sánchez & Scheeres (2014), the minimum cohesive strength required to hold together a 15 m ≤ D ≤ 38 m object rotating with a 1.9-minute period assuming a density of 1.5 g cm−3 is 250–1600 Pa. This cohesive strength is comparable to the upper layer of the lunar regolith (Mitchell et al. 1974).
5.2. 2013 BS45 as a Spacecraft Mission Target
2013 BS45 is a prime candidate for a spacecraft mission because of its Earth-like orbit, low eccentricity, and low inclination. This asteroid is in the top 3% of NEAs with Δv suitable for a flyby mission (https://echo.jpl.nasa.gov/~lance/delta_v.flyby.html) and in the top 0.5% of NEAs suitable for a spacecraft rendezvous mission (https://echo.jpl.nasa.gov/~lance/delta_v.rendezvous.html). The best analogies for 2013 BS45 in spacecraft images may be boulders on 25143 Itokawa (Saito et al. 2006; Michikami et al. 2008), 4179 Toutatis (Jiang et al. 2015), and 162173 Ryugu (Ralf et al. 2018). The asteroid likely originated either from collisional disruption of a larger parent body or from a cratering event on a larger body. This would be the smallest and most rapidly rotating asteroid visited by spacecraft to date by more than an order of magnitude. For these reasons, 2013 BS45 would be a new kind of a world for a mission encounter, and it seems likely that a mission would discover something unexpected.
The number of NEAs comparable in size to 2013 BS45 is in the millions (Harris & D'Abramo 2015), and statistically they pose the highest (frequency-wise) impact risk to Earth. One such object exploded over Russia in 2013 and injured more than 1000 people (Kartashova et al. 2018). Clearly, studying small NEAs such as 2013 BS45 while they are still in space is also important from a planetary defense perspective.
5.3. Radar Observations of the Arjuna-class Objects
Radar observations of the Arjuna-class objects are very challenging because these objects are very small, generally a few tens of meters or less in diameter, and they need to approach within a few lunar distances in order to be detectable. With existing ground-based surveys, radar observations are most likely to occur shortly after discovery when these objects are still close.
Table 5 lists currently known Arjuna-class objects. The physical properties of Arjunas are largely unknown; rotation periods are available for only four of them, and only three have bounds on their diameters. Most of this information comes from radar observations. Three Arjuna-class NEAs have been observed by radar to date: 2006 RH120, 2013 BS45, and 2014 UR. 2006 RH120 has an absolute magnitude of 29.5 and a rotation period of 2.75 minutes (Kwiatkowski et al. 2009). 2014 UR has H = 26.6 and a rotation period of 0.23 hr (Warner et al. 2009).
Table 5. Future Radar Apparitions for the Known Arjuna-class Objects
| Object | H | D | P | Sol. | Interval | Arecibo Date | Dist. | S/Ns | Goldst. Date | Dist. | S/Ns | |
|---|---|---|---|---|---|---|---|---|---|---|---|---|
| (mag) | (m) | (minutes) | (au) | (au) | ||||||||
| 2018 PK21 | 26.1 | 17 | 10 | 5 | 1965–2063 | 2020 Dec 9 | 0.031 | 20 | ⋯ | ⋯ | ⋯ | |
| 2006 RH120 | 29.5 | 3a | 2.8b | 49 | 1969–2042 | 2043 Oct 30 | 0.010 | 80 | ⋯ | ⋯ | ⋯ | |
| 2012 LA11 | 26.1 | 17 | 10 | 16 | 1931–2135 | 2061 Jun 15 | 0.016 | 170 | 2061 Jun 10 | 0.008 | 140 | |
| 2014 QD364 | 27.2 | 10 | 10 | 8 | 1951–2103 | 2061 Aug 28 | 0.023 | 30 | ⋯ | ⋯ | ⋯ | |
| 2003 YN107 | 26.5 | 14 | 10 | 17 | 1931–2177 | 2065 Dec 14 | 0.010 | 1500 | 2065 Dec 12 | 0.010 | 130 | |
| 2008 KT | 28.2 | 6 | 10 | 10 | 1946–2075 | 2070 May 27 | 0.018 | 40 | ⋯ | ⋯ | ⋯ | |
| 2010 HW20 | 26.1 | 17 | 10 | 8 | 2004–2073 | 2070 Oct 31 | 0.023 | 60 | ⋯ | ⋯ | ⋯ | |
| 2008 UC202 | 28.3 | 6 | 10 | 6 | 1945–2073 | 2073 Nov 1 | 0.013 | 130 | ⋯ | ⋯ | ⋯ | |
| 2006 JY26 | 28.4 | 6 | 10 | 9 | 1931–2074 | 2075 May 3 | 0.007 | 2000 | 2074 May 3 | 0.007 | 140 | |
| 2009 SH2 | 24.9 | 31 | 76c | 21 | 1957–2097 | 2084 Apr 1 | 0.035 | 60 | 2090 Sep 28 | 0.005 | 11000 | |
| 2017 YS1 | 28.9 | 4 | 10 | 2 | 1901–2127 | 2085 Dec 22 | 0.011 | 160 | ⋯ | ⋯ | ⋯ | |
| 2014 UR | 26.6 | 14 | 13.8c | 25 | 1929–2173 | 2090 Oct 17 | 0.013 | 530 | 2090 Oct 16 | 0.013 | 40 | |
| (459872) | 2014 EK24 | 23.3 | 65 | 5.9c | 96 | 1920–2189 | 2091 Aug 24 | 0.041 | 30 | ⋯ | ⋯ | ⋯ |
| 2013 BS45 | 25.9 | 38d | 1.9d | 32 | 1927–2176 | 2169 Mar 3 | 0.015 | 440 | 2169 Mar 1 | 0.015 | 40 | |
| 2009 BD | 28.1 | 3c,e | 10 | 43 | 1951–2165 | ⋯ | ⋯ | ⋯ | ⋯ | ⋯ | ⋯ | |
| 2012 FC71 | 25.2 | 27 | 10 | 7 | 1900–2181 | ⋯ | ⋯ | ⋯ | ⋯ | ⋯ | ⋯ | |
| 2016 GK135 | 28.1 | 7 | 10 | 6 | 1915–2114 | ⋯ | ⋯ | ⋯ | ⋯ | ⋯ | ⋯ | |
| 2017 UO7 | 26.8 | 12 | 10 | 2 | 1910–2077 | ⋯ | ⋯ | ⋯ | ⋯ | ⋯ | ⋯ | |
| 2018 ER1 | 25.6 | 22 | 10 | 12 | 1946–2137 | ⋯ | ⋯ | ⋯ | ⋯ | ⋯ | ⋯ | |
| 2018 FM3 | 27.2 | 10 | 10 | 3 | 1953–2071 | ⋯ | ⋯ | ⋯ | ⋯ | ⋯ | ⋯ | |
| 2018 PN22 | 27.4 | 9 | 10 | 2 | 1944–2152 | ⋯ | ⋯ | ⋯ | ⋯ | ⋯ | ⋯ |
Notes. Future radar observing opportunities for the currently known Arjuna-class objects listed in order of next close approach. We list the parameters from the JPL's on-line Horizons database (https://ssd.jpl.nasa.gov/horizons.cgi): absolute magnitude (H), orbital solution number (Sol.), time interval covered by the orbital solution (Interval), time of the next radar apparition at Arecibo, distance, and best radar S/Ns per day at Arecibo. The next three columns are the next radar apparition, distance, and S/Ns/day for Goldstone. The S/Ns are given in the units of standard deviations above the noise level. We list the object's diameter (D) and rotation period (P) if the information has been reported. Otherwise, we calculate a diameter from Equation (2) assuming 0.2 optical albedo and a rotation period of 10 minutes. Radar S/Ns were calculated assuming nominal system parameters at Arecibo and Goldstone: transmit power of 900 and 450 kW and system temperatures of 23 and 18 K, respectively. The cut-off for radar detectability is S/Ns per day of 20.
aBrozović et al. (2016). bKwiatkowski et al. (2009). cWarner et al. (2009) (http://www.MinorPlanet.info/lightcurvedatabase.html) and references within. dThis work. eMommert et al. (2014).Download table as: ASCIITypeset image
Table 5 lists future Arecibo and Goldstone observing opportunities for the known Arjuna objects. The majority are 40–60 yr in the future, which is a consequence of their long synodic periods relative to the Earth. About two-thirds of these objects will be detectable by radar in the time interval for which we have reliable orbital predictions. 2018 PK21 is the next currently known Arjuna object detectable with Arecibo in 2020 December. The best Arjuna radar target in the foreseeable future is 2009 SH2, which will approach within 0.005 au (1.9 lunar distances) in 2090 September. It is likely that dozens of Arjuna-class objects will be discovered in the next decade and that several of them will be detectable by radar during their discovery apparitions.
2013 BS45 will approach within 0.016 au (6.2 lunar distances) in 2090, but it will not be observable with radar. The asteroid remains outside both Goldstone and Arecibo decl. windows during the time it is detectable around the closest approach. The DSS-43 antenna in Canberra and the Parkes Radio Telescope in the southern hemisphere are far less sensitive than either Arecibo or Goldstone (Naidu et al. 2015) and are only capable of detecting very strong radar targets. If an Arecibo-type facility becomes available in the southern hemisphere in time for the 2090 close approach, radar S/Ns would exceed 1000 per day. The next observing opportunity in the northern hemisphere with radars as sensitive as Arecibo or Goldstone is in 2169, when 2013 BS45 will approach within 0.015 au and S/Ns will be strong enough for high-resolution imaging.
This work was performed at the Jet Propulsion Laboratory, California Institute of Technology, under contract with the National Aeronautics and Space Administration (NASA). This material is based in part upon work supported by NASA under the Science Mission Directorate Research and Analysis Programs and the Human Exploration and Operations Mission Directorate Advanced Exploration Systems Program. We would like to thank Chris Magri for a thorough and helpful review of this manuscript.