

Abstract
We study the terahertz (THz) magnetic field pulse enhanced by a spiral-shaped antenna resonator (SAR). We deposit the SAR on the surface of a terbium-gallium-garnet crystal, which has a large Verdet constant, and measure the Faraday rotation angle for strong THz pulse excitation by magneto-optical sampling (MOS) with NIR light. The determined magnetic field strength and field-enhancement spectrum are consistent with the theoretical predictions. This first report of the detection of a Tesla-class picosecond magnetic field pulse by MOS is expected to be useful in research on the control of magnetization in spintronic devices.
Export citation and abstract BibTeX RIS

Content from this work may be used under the terms of the Creative Commons Attribution 4.0 license. Any further distribution of this work must maintain attribution to the author(s) and the title of the work, journal citation and DOI.
Due to its relevance for information technologies, the control of magnetic properties using the magnetic component of terahertz (THz) light has attracted significant attention. 1–9) For example, the typical frequency of a spin eigenmode of an antiferromagnet is around 1 THz. If such a spin eigenmode of an antiferromagnet is excited with a THz magnetic field, the response occurs within picoseconds, which is significantly faster than the spin response of ferromagnetic materials. From the viewpoint of applications, this fast response should enable the realization of ultrafast spintronics and magnonics devices. 10–16)
Previous work in this field have revealed the response of orthoferrites RFeO3 (R: rare-Earth), CoF2, and NiO that occurs when a THz magnetic field is applied and perturbs the spin system. 2–5) However, in these previous investigations, the magnetic field used was that of a THz pulse propagating in free space, which usually has a magnetic field that is too weak to induce significant changes in the spin system. One method to enhance these THz magnetic fields is the use of metallic metamaterials such as split-ring resonators (SRRs). 6,7,17–19) If a properly designed SRR is illuminated with a THz pulse, an intense THz magnetic field perpendicular to the plane of the SRR is generated at the edges of the structure. Another method to obtain strong magnetic fields is to connect an antenna to the base structure of the metamaterial. This approach was explored for microwave magnetic fields to observe nitrogen-vacancy centers using a spiral-shaped antenna resonator (SAR) that strongly enhances the magnetic field. 20,21) Regarding the THz range, a micrometer-sized SAR that can generate strong THz magnetic fields, has been theoretically proposed. 22,23) More recently, Zhang et al. observed higher harmonics of the magnetization oscillation in an antiferromagnet by using a similar SAR structure. 9) However, the actual strength of the magnetic field generated around such an SAR has so far not been experimentally determined.
Currently, the most feasible method for directly observing ultrashort magnetic field pulses is to measure the field-induced Faraday rotation signal using magneto-optical sampling (MOS). 24) Since the Faraday rotation angle is proportional to the magnetic field strength, it is possible to determine the strength of the applied magnetic field by using a suitable substrate with a known proportionality constant (the so-called Verdet constant). It has been shown that terbium-gallium-garnet (TGG) crystals can be used to determine the strength of a THz magnetic field. 19,24) In this study, we deposited an SAR on a TGG substrate and directly observed the waveform of the enhanced magnetic field by MOS. We determined the actual strength of the magnetic near field, as well as the field-enhancement spectrum of the SAR structure, and compared the results with the values predicted by calculations.
The experimental setup is shown in Fig. 1(a). The THz pulses used to illuminate the sample are generated by optical rectification in LiNbO3. 25) The used metamaterial, which is shown in Fig. 1(b), is made of gold and consists of a 40-μm-long antenna section and a 10-μm-square spiral section. According to simulations, the use of a triangular shape for the antenna section allows us to achieve an absolute value of BnTHz that is approximately 10% higher than that achieved by using an antenna section with a constant thickness. This structure was fabricated by electron-beam lithography and electron-beam evaporation of gold. To obtain a uniform and defect-free structure, a 15-nm-thick Cr film was prepared on the surface before gold deposition. When the THz pulse with an electric field parallel to the y-direction illuminates the antenna section, the free electrons in the gold layer are driven in the same direction as that of the THz electric field. This current also reaches the spiral section, resulting in the generation of a magnetic near field BnTHz at the center of the spiral that is perpendicular to the surface.

Fig. 1. (a) Experimental setup. PM: parabolic mirror; WGP: wire-grid polarizer pair; BS: beam splitter; WP: Wollaston prism; BD: balanced detector. WGP is used to change the strength of the incident THz electric field. (b) Enlarged view of the sample. The illumination of the SAR with the THz pulse generates the magnetic near field BnTHz, which causes Faraday rotation of the plane of polarization of the NIR probe light. (c) A photograph of the fabricated SAR structure (left-hand side) and a schematic of the change of the polarization direction of the NIR probe light (right-hand side). The d (=1.0 μm) indicates the turn spacing of spiral structure, and the clearer definition is shown in Fig. 4(b).
Download figure:
Standard image High-resolution imageCalculations have shown that, compared to the magnetic field of the propagating THz pulse, the SAR structure significantly enhances the peak value of the magnetic field (the magnetic near field can reach the Tesla range if we use incident THz pulses with electric fields on the order of 1 MV/cm). However, it is not yet known whether the estimated strength and spectrum of BnTHz are accurate. Therefore, we used Faraday rotation measurements as shown in Fig. 1(a). This measurement uses the fact that the Faraday rotation angle θ in the substrate is proportional to the applied magnetic field BnTHz, which can be expressed as follows 24):

Here, L represents the length of the region where the magnetic field is applied, and V is the Verdet constant. Tb3Ga5O12 (TGG) crystals have a high Verdet constant. 26) They also exhibit a high transparency in the IR region and a high durability, which makes them suitable for measuring the actual values of magnetic field amplitudes using lasers. However, the value of V can vary due to impurities and other factors. Therefore, we first conducted polarization rotation measurements under a static magnetic field using an electromagnet. For our TGG (111) sample with a thickness of 0.5 mm, we determined a value of V = 83.3 rad/T/m for a wavelength of 785 nm by using a different setup in another laboratory. The wavelength-dependence of the Verdet constant of TGG at a constant temperature is approximately described by Van Vleck's equation: 27,28)
Here, C is a constant and λ0 is the wavelength corresponding to the 4f–5d transition of Tb3+ ions (λ0 = 296 nm). 28) By using C = 44.0 × 10⁻¹² rad m/T, we estimated a V of 79.7 rad/T/m for 800 nm.
As shown in Fig. 1(b), the THz pulses (with an electric field of 0.6 MV/cm) generated using NIR laser pulses (800 nm, 1 kHz) are incident from the positive direction of the z-axis, and another NIR beam is incident from the negative direction of the z-axis to probe the Faraday rotation in the substrate. As shown in Fig. 1(a), the probe beam is focused by an objective lens (OL) at the center of the spiral structure (with a spot diameter of 1 μm and temporal pulse duration of about 100 fs) and was obtained from the NIR-laser output by using a beam splitter (BS) (not shown in Fig. 1). After reflection at the sample surface (defined by z = 0), it passes again through the OL and is decomposed into x- and y-polarized light (Ix and Iy , respectively) by a Wollaston prism (WP). The Faraday rotation angle θ is detected using a balanced detection scheme. Here, we assume that the Kerr signal at the sample surface is ignored since it is estimated to be about 100 times [=2πLeff(1-n2)/λ800] smaller than the Faraday signal, 29) where Leff (=3.9 μm) is the effective probed length in our geometry which is provided later, n (≈1.95) is the refractive index of TGG at 800 nm, 30) and λ800 (=800 nm) is the wavelength of probe pulse. Since the back surface of the sample (z = 0.5 mm) is relatively far away from the focal plane (z = 0 mm), the probe light that is reflected from the back surface and reaches the detector plane is distributed over an area that is much larger than the light-receiving surface of the detector. This ensures that the probe light reflected from the back surface hardly affects the estimation of the magnetic field strength.
Before the measurement, the electric field of the probe light was set to 45°, and thus the output signal of the balanced detector is zero in the case of no magnetic field inside the TGG substrate. As shown in Fig. 1(c), the electric field under zero magnetic field is
where A is the amplitude of the incident electric field of the probe pulse. When a THz pulse illuminates the sample and a magnetic near field is generated around the SAR, the plane of polarization of the probe light is rotated by the angle θ, and the electric field becomes
If θ is sufficiently small, we can use the following approximation:

and then θ can be expressed as

The electric field of the incident THz pulse obtained by electro-optic sampling at the sample position is shown in Fig. 2(a). The data of the Faraday rotation angle θ caused by the enhanced magnetic field around the SAR is shown in Fig. 2(b). To convert these values to BnTHz, we need to determine the correct value of L. Because BnTHz is not constant in the z-direction, we determined the effective penetration depth Leff of the magnetic near field in the TGG substrate: the distribution of BnTHz along the z-direction was obtained by a finite-difference time-domain (FDTD) simulation and the results are shown in Fig. 2(c). The parameters used here are the refractive index of TGG in the THz frequency region (3.75), 18) the conductivity of gold (4.1 × 10⁷ Ω−1m−1), 31) and the time-domain data of the incident THz pulse in Fig. 2(a). The horizontal axis in Fig. 2(c) shows the depth z and the vertical axis shows the normalized magnetic near field at the center of the spiral at the time when the field is the strongest (the normalized profile is almost independent of time). The integral of this curve is equal to the Faraday rotation angle divided by 2 V and the normalization constant. For the integration, we used the following function, which can well reproduce the calculation results:

The broken curve in Fig. 2(b) is the fitting result (a = −0.0467, b = 11.3, and c = 10.9). We integrated this function over the range BnTHz(z) > 0 and obtained a value of Leff = 3.9 μm. As the data in Fig. 2(c) is normalized to the maximum amplitude at the sample surface, we use Leff = 3.9 μm, which fulfills the condition θ/2Bmax = V∫Bnorm(z) dz = V Bnorm(0) Leff = V Leff. Here, the factor 1/2 was added to take the round trip of the probe pulse into account, and Bnorm is defined by Bnorm = B(z)/Bmax = B(z)/B(0). By using this result and the data in Fig. 2(b), we can place the time-domain data of the magnetic near field BnTHz at z = 0 on an absolute scale: in Fig. 2(c), a THz magnetic field pulse with a maximum amplitude in the Tesla range (0.96 T) can be confirmed for an incident THz pulse with an electric field of 0.6 MV/cm (that corresponds to the magnetic field of 0.2 T).
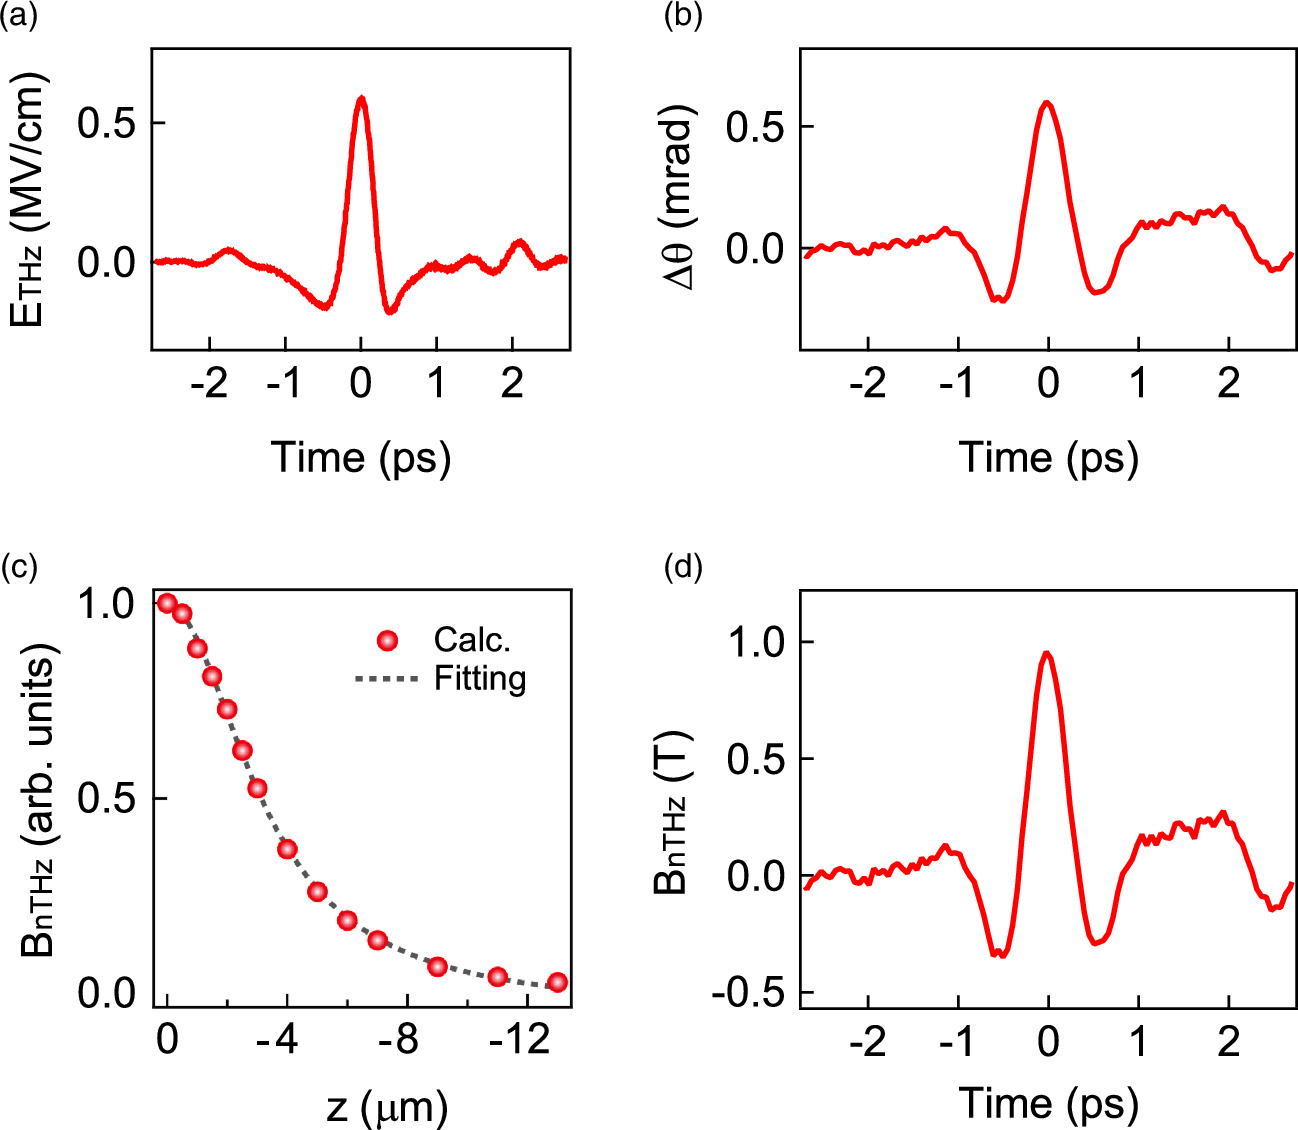
Fig. 2. (a) The experimentally determined waveform of the incident THz electric field. (b) Faraday rotation data detected by MOS. (c) Calculated z-dependence of the magnetic near field BnTHz. (d) The experimentally determined waveform of BnTHz. The peak value is 0.96 T. The spiral structure investigated here has a turn spacing d of 1.0 μm.
Download figure:
Standard image High-resolution imageFigure 3 compares the experimental data based on the MOS measurements and the theoretical data to clarify the validity of the FDTD simulations. Figure 3(a) shows the calculated and experimentally determined time-domain data. The inset shows a comparison of the waveforms normalized to the magnitude at t = 0. The normalized waveforms are almost identical, but on an absolute scale the calculated peak amplitude is approximately 27% larger. A possible reason for this difference is a smaller effective conductivity and related error of estimation of Leff: the Cr film below the gold layer may effectively reduce the electrical conductivity, because the electrical conductivity of Cr is about four times smaller than that of gold. The contribution of Cr was not taken into account in our calculations, because the Cr film is too thin (15 nm).
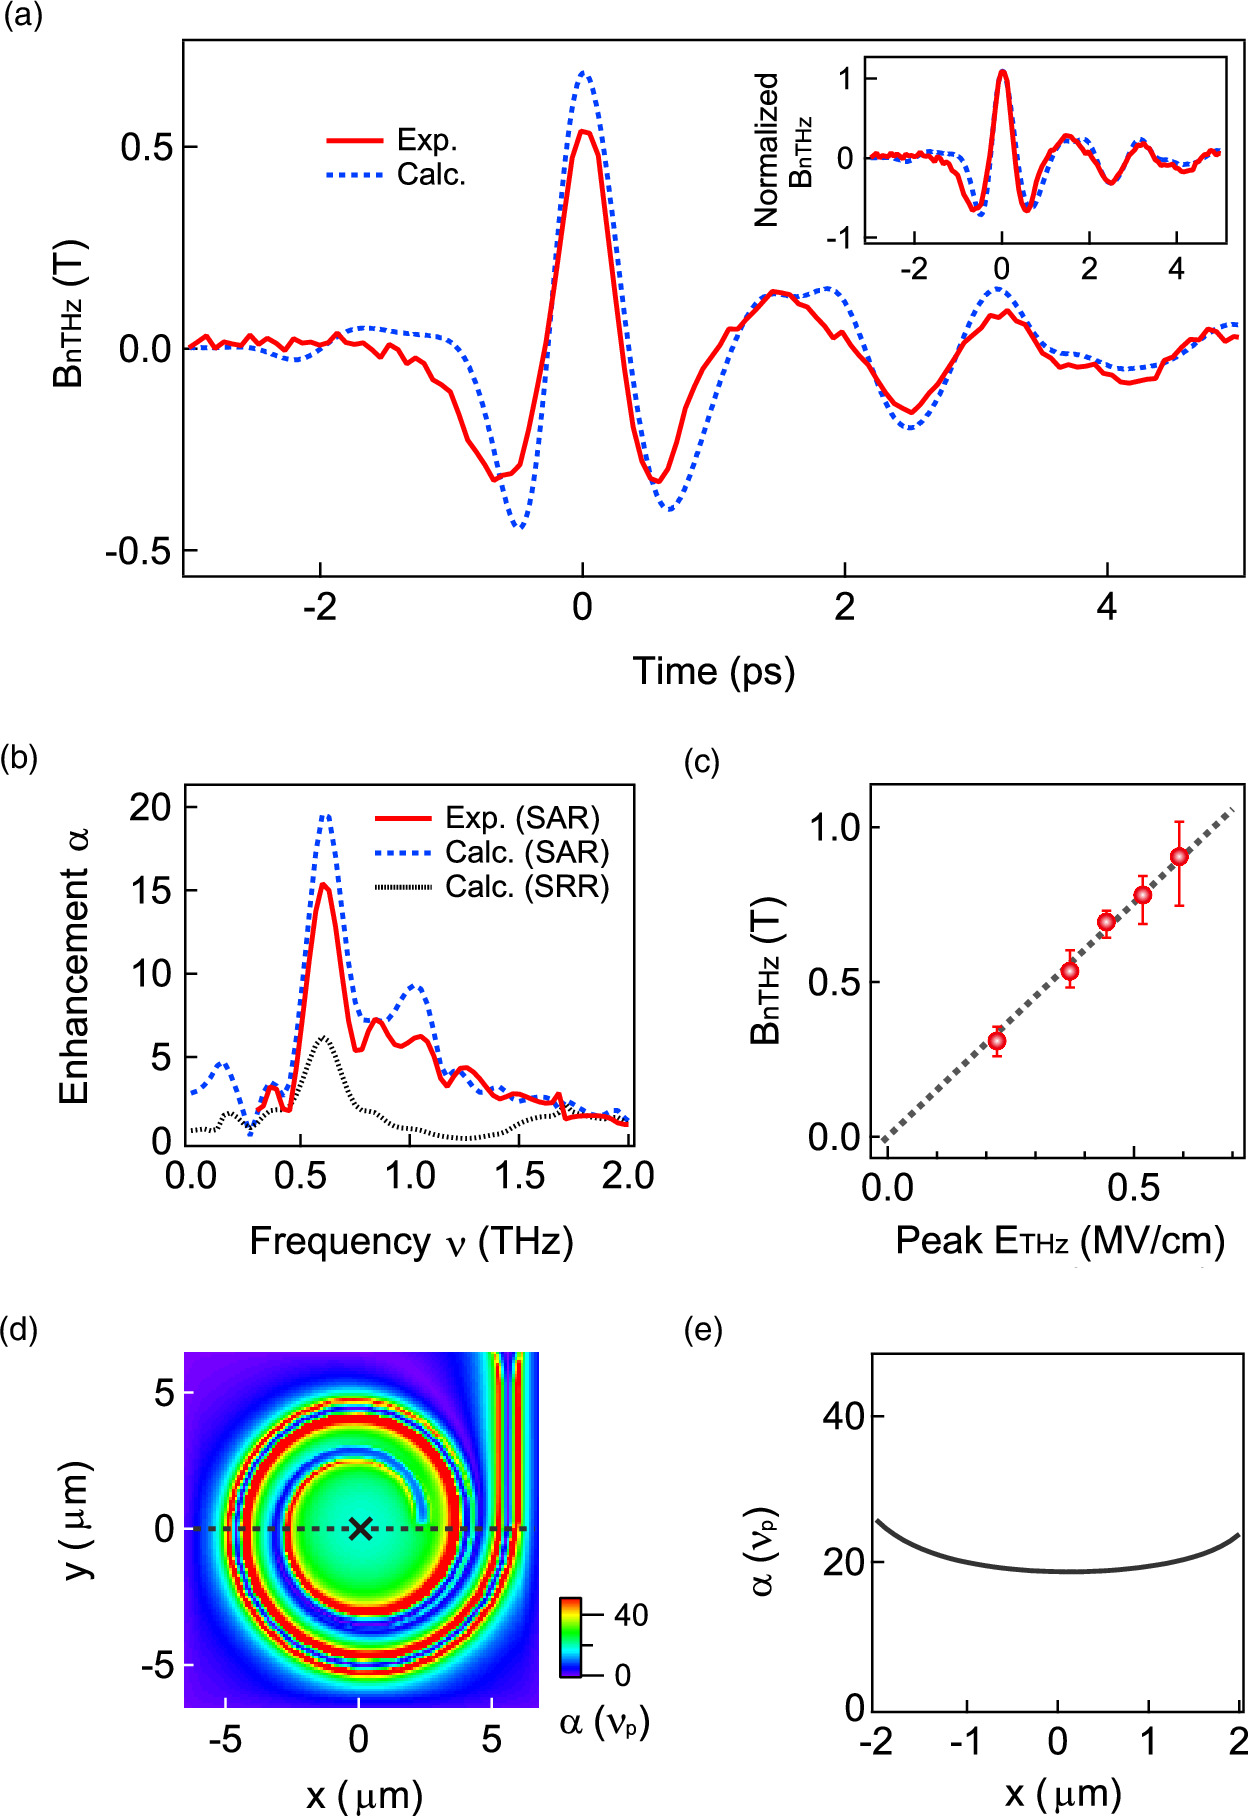
Fig. 3. (a) Comparison of the experimentally determined waveform of BnTHz (red solid curve) and the FDTD calculation result (blue broken curve). (b) The field enhancement α spectra derived using the experimental data (red solid curve), the FDTD calculation result (blue broken curve), and the theoretical result for a SRR structure (black dotted curve). (c) The dependence of the peak value of BnTHz on the incident maximum electric field amplitude. (d) The calculated distribution of enhancement factors of the magnetic field, α(νp) = BnTHz(νp)/Bin(νp) at the resonance peak frequency νp = 0.6 THz. The cross mark indicates the center position of spiral where the calculation results are obtained. (e) The spatial distribution of α (νp) sliced at y = 0 as indicated by the dashed line in (d). The spiral structure investigated here has a turn spacing d of 1.0 μm.
Download figure:
Standard image High-resolution imageTo clarify the response of the SAR structure to different frequency components, we define the field-enhancement ratio at a given frequency as the spectral component of the magnetic field around the SAR divided by the corresponding component of the magnetic field spectrum of the incident THz pulse. Figure 3(b) shows the field-enhancement spectra derived using the experimental time-domain data (red solid curve), the FDTD time-domain data (blue broken curve), and also the calculation result for a SRR for comparison (black dotted curve). Here, the enhancement of α is defined by BnTHz(ν)/Bin(ν), where Bin is the incident THz magnetic field. It can be seen that the measured peak frequency of the SAR structure is in good agreement with the calculated one. The field-enhancement ratio of the SAR metamaterial at 0.6 THz is 3.2 times larger than that of the SRR metamaterial. The response speed of TGG is fast enough to allow an accurate characterization of the peak at 0.6 THz. 18,19) Figure 3(c) shows that the experimentally determined magnetic field strength is linearly proportional to the THz electric field, which indicates that this data corresponds to the perturbative regime. Figures 3(d) and 3(e) show the calculated spatial distribution of α at the resonance coil frequency νp = 0.6 THz. While SRRs do not have a uniform magnetic field strength inside the ring, 6–8) SARs are more advantageous in terms of field uniformity in addition to the field enhancement.
Finally, the tunability of the peak frequency is discussed: Fig. 4(a) shows how the frequency of the peak in the experimental field-enhancement spectrum depends on the turn spacing d of the spiral (the spectra are normalized to their corresponding peak values). As the turn spacing increases from d = 1.0 μm to 1.6 μm, the peak frequency decreases. The relationship between the peak frequency and d is shown in Fig. 4(b), which compares the experimental data (red closed circles) with the results of FDTD simulations (blue open circles). It can be seen that the SAR-enhanced magnetic field can be tuned in the range of 0.4–0.7 THz by modulating the turn spacing d.

Fig. 4. (a) The experimentally determined spectra of the field enhancement for different values of the turn spacing d. (b) Comparison of the calculated (FDTD) and experimentally determined turn-spacing dependence of the resonance frequency. The dashed line is the guide for eye.
Download figure:
Standard image High-resolution image
In conclusion, we generated and detected for the first time a Tesla-class THz magnetic field pulse by MOS using an SAR structure on a TGG substrate. The estimated magnetic field strength and field-enhancement spectrum are consistent with the FDTD simulation. This good agreement between the experimental and simulation results also confirms that the higher harmonics of the magnetization oscillation shown in our previous work is generated by the Tesla-class THz magnetic field pulse that induced by the SAR. 9) Our results on the actual magnetic field strength around such SARs can be useful in research on the control of magnetization in spintronic devices and in research on ultrafast phenomena in various materials including atomic layers of magnetic materials and quantum spin systems. 32)
Acknowledgments
This study was supported by the Japan Society for the Promotion of Science KAKENHI Grant (Nos. JP19H05465 and JP21H01842). This work was partially supported by the Frontier Photonic Sciences Project of the National Institutes of Natural Sciences (NINS) (Grant No. 01212301).