
Abstract
We present the thermal conductivity (κ) of perovskite PbZr1−xTixO3 (PZT) for 0 ≤ x ≤ 1 and 300 K ≤ T ≤ 873 K, the composition and temperature ranges covering the classic phase diagram of this important piezoelectric system. The glasslike dκ/dT > 0 behavior is observed for the ferroelectric rhombohedral phases and much of the paraelectric cubic phase, implying the presence of strong phonon damping in these regions of PZT. For all the temperatures studied in this work, the κ becomes lowest at x = 0.5.

Content from this work may be used under the terms of the Creative Commons Attribution 4.0 license. Any further distribution of this work must maintain attribution to the author(s) and the title of the work, journal citation and DOI.
Among the large variety of solid solutions formed by perovskite oxides, probably none has captured more attention than PbZr1−x Tix O3 (PZT), the most important material in the multi-billion dollar piezoelectric industry. 1) PZT shows a complex phase diagram (Fig. 1, after Jaffe et al. 2)), with the nearly vertical morphotropic phase boundary (MPB) at x ≈ 0.48 separating the ferroelectric (FE) rhombohedral region from the FE tetragonal region. The highest piezoelectric response is found as x approaches the MPB, but the detailed mechanism of this fascinating behavior remains controversial. 3,4)

Fig. 1. Phase diagram of PbZr1−x Tix O3, adapted from Ref. 2. PC: paraelectric cubic; AO: antiferroelectric orthorhombic; FR(HT): ferroelectric rhombohedral (high temperatures); FR(LT): ferroelectric rhombohedral (low temperatures); FT: ferroelectric tetragonal; MPB: morphotropic phase boundary.
Download figure:
Standard image High-resolution imageAt the left end of the phase diagram, PbZrO3 shows a paraelectric (PE) cubic to antiferroelectric (AFE) orthorhombic transition at Tc ≈ 503 K. The AFE structure (space group Pbam) is described by antiparallel shifts of polar Pb ions along cubic [110] and antiferrodistortive (AFD) tilting of oxygen octahedra around [110]. 5,6) Substitution of few% Ti for Zr leads to the FE rhombohedral region, which contains two phases: FR(HT) (R3m) at high temperatures, which has the polarization along [111], and FR(LT) (R3c) at low temperatures, which additionally shows AFD oxygen tilting around [111]. When the Ti content x exceeds the MPB, the structure becomes FE tetragonal (P4mm) with the polarization along [001]. This tetragonal region continues to PbTiO3 (Tc ≈ 763 K) at the right end of the phase diagram.
An important update to these basic features of PZT occurred in 1999 when Noheda et al. found a narrow region (0.45 < x ≤ 0.48 at 300 K) of a FE monoclinic (Cm) phase on the left side of the MPB. 7,8) As the low and "bridging" symmetry of this structure allows the polarization axis to rotate between the rhombohedral [111] and tetragonal [001] directions, the high piezoelectric response at MPB could be explained with the polarization rotation mechanism. 9) However, the exact structure and stability region of the monoclinic phase continues to be disputed, with recent studies reporting the coexistence of rhombohedral and monoclinic orders in most of the rhombohedral region. 10–14) Moreover, there remain the important questions on (1) competing FE, AFE, and AFD phonon instabilities, 15–17) (2) disordered displacements of Pb ions and oxygen octahedra, 18–21) and (3) anomalous lattice dynamics in the vicinity of MPB, 16,22,23) which all have bearings on the functional performance of PZT.
Because thermal conductivity (κ) measurements probe the scattering of heat-carrying acoustic phonons by local distortions and anharmonic interactions, 24) they can provide important insights into the above issues on PZT. Indeed, our earlier κ study 25) on PbZrO3 and PbTiO3 for T ≥ 300 K revealed a low, glasslike κ (dκ/dT > 0) in the cubic phase for PbZrO3, whereas PbTiO3 was found to show a typical crystalline behavior. 25,26) These results are intimately correlated with the local structures of these compounds, 25) and suggest that a systematic κ study on PZT will track the evolution of phonon dynamics across the phase diagram. With this objective, the present paper reports the κ of PZT (0 ≤ x ≤ 1) for T = 300−873 K. We find glasslike κ in both the FE rhombohedral phases and much of the cubic phase, indicating the presence of strong phonon damping in these regions of PZT. We also find that the κ shows a distinct minimum at x = 0.5. Although it is tempting to associate this minimum with the MPB for T < Tc, the persistence of this minimum in the cubic phase implies that conventional point-defect alloy scattering also plays an important role.
Polycrystalline samples of PZT with x = 0.2, 0.4, 0.5, 0.7, 0.8, and 0.9 were prepared by solid-state reactions. For each x, dried powders of PbO (99.99%), ZrO2 (99.9%), and TiO2 (99.999%) were weighed with 1% excess PbO. The powders were thoroughly mixed, pressed into pellets, covered in Pt sheets, and heated at 1123 K for 3 h in a closed Al2O3 crucible. These steps were then repeated to improve homogeneity. After the fired pellets were ground to fine powders and 2 wt% polyvinyl alcohol binder added, the mixture was ground, sieved, pelletized under an isostatic pressure of 200 MPa, and heated at 723 K for 3 h to remove the binder. The resulting pellets were then covered in Pt sheets and put on a powder bed of PbZrO3 in a tightly covered Pt crucible, which was in turn sealed in an Al2O3 crucible using alumina cement. This procedure minimized the loss of PbO during the 3 h sintering at 1543 K. The sharp powder X-ray diffraction peaks (see supplementary data) and absence of extraneous peaks confirm that each sample is well crystallized without impurity phases.
The κ values were determined from the relation κ = DCp ρ, where D is thermal diffusivity, Cp is heat capacity, and ρ is density. For Cp , we used Yoshida's published data 27,28) (see below), which were obtained between 300 and 873 K by the enthalpy method using a Perkin Elmer differential scanning calorimeter. The data were obtained on the heating direction under N2 atmosphere, and the accuracy is 0.3% at 400 K and ∼1% at 873 K. 27,29) We mention here that Yoshida also used a relaxation technique to obtain Cp below 300 K, which join smoothly with the data above 300 K. 27,28) D was obtained in the present study by the flash technique, using Netzsch LFA 467HT. The samples were square plates of 10 × 10 mm2 faces and ∼1.0 mm thicknesses, with a thin layer of graphite coated on both sides. The measurements were taken for T ≥ 300 K on the heating direction under N2. ρ was determined by the Archimedes method, and its T dependence was calculated from volumetric thermal expansion. 30,31) For x = 0.4, we used the expansion data 30) of x = 0.36; this does not introduce significant error, since the volume changes by less than 1% between 300 and 873 K. As the ρ of sintered pellets were 89%−93% of the theoretical values, the raw κ values (κraw) were converted to the ρ of a fully dense solid through the relation κraw/κ = 1–4ϕ/3, where ϕ is the porosity of the specimen. 32) The overall accuracy in κ is estimated to be ±5%. Because the κ of PZT is low and the phonon mean free path (l) is of the order of ∼1 nm, 33) phonon scattering at grain boundaries and FE domain walls is expected to be insignificant in the present T region. 33)
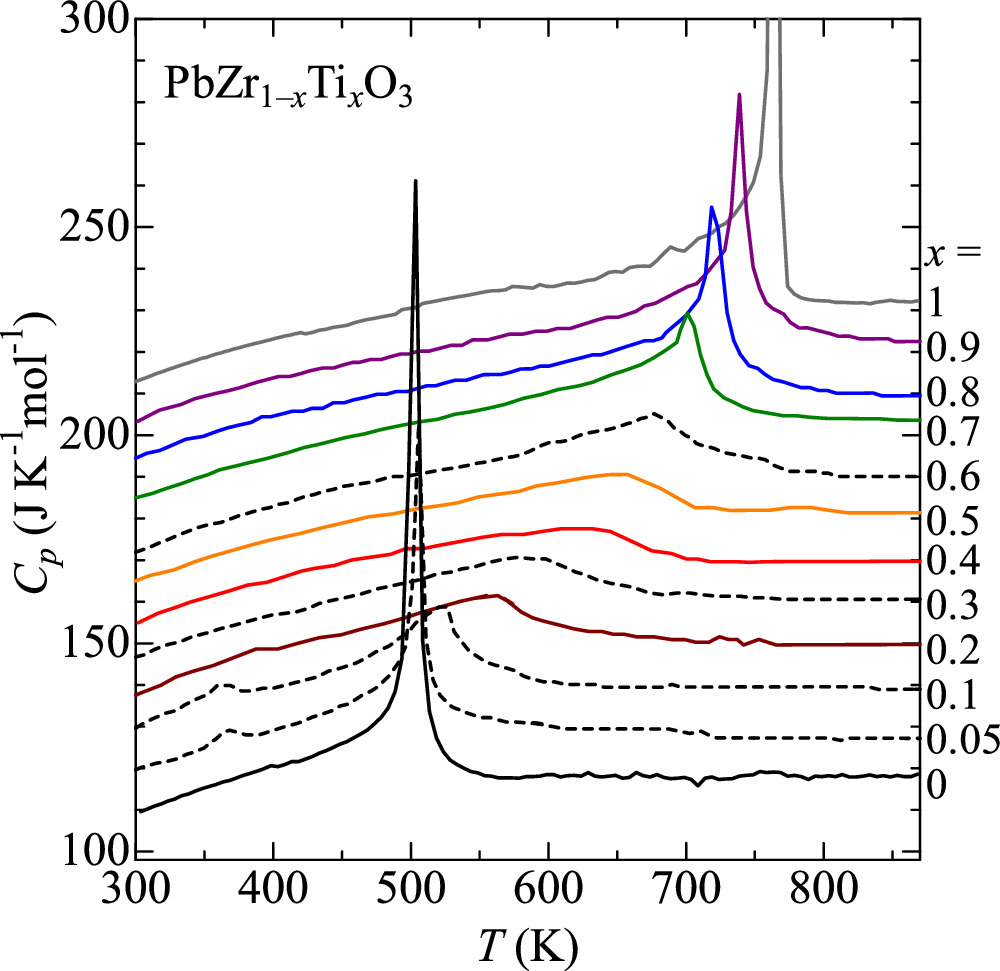
We first examine Yoshida's Cp data, which are reproduced in Fig. 2 for all 12 compositions. Here, the Cp values for x = 0 and 1 come from tabulated data, 34) whereas the values for other x were extracted from the figures in the PhD thesis 27) and conference abstract. 28) For each x, the most prominent feature is a peak at Tc, the position of which agrees well with the phase diagram. The peak is followed by a nearly constant Cp in the cubic phase (the Debye temperatures 25) are ∼360−400 K), at a value close to the Dulong–Petit limit of 125 J K−1 mol−1. For x = 0.05 and 0.1, another peak at the lower transition (see Fig. 1) can be seen at 370 and 365 K, respectively; for x = 0.2, such a peak is visible at ∼395 K under an expanded scale. 27) Focusing now on the shape of Cp at Tc, we find very sharp peaks at the first-order AFE and FE transitions in x = 0 and 1. As x moves away from these end members, however, the Cp peak is gradually suppressed and becomes more second-order like. The change from first- to second-order character (i.e. a tricritical point) appears to occur somewhere between x = 0.05 and 0.2 for the Zr-rich region, and between x = 0.6 and 0.7 for the Ti-rich region. Similar positions of tricritical points have been reported. 35–37) Interestingly, an earlier Cp study 36) by Rossetti and Navrotsky also located the tricritical point as 0.6 ≤ x ≤ 0.7, despite their Cp for x = 0.6 and 0.7 showing sharper curvatures near Tc. The difference in peak shapes can be attributed to the synthesis method: while Yoshida used conventional solid-state reactions, 27) Rossetti and Navrotsky employed a metal-organic decomposition process to obtain more homogeneous samples. Although our present κ samples were prepared in a manner similar to Yoshida's samples, we expect some difference in Cp in the vicinity of Tc. For this reason, we exclude κ data in such T regions.

Fig. 2. Heat capacity of PbZr1−x Tix O3. 27,28,34) For clarity, the data have been successively offset by 10 J K−1 mol−1 from x = 0. The compositions for which thermal conductivity is studied are plotted with solid lines.
Download figure:
Standard image High-resolution imageThe bottom and top panels of Fig. 3 show the κ of PZT for 0 ≤ x ≤ 0.5 and 0.5 ≤ x ≤ 1, respectively. The data for x = 0 and 1 are reproduced from our earlier study. 25) We first focus on 0 ≤ x ≤ 0.5. As noted earlier, the κ of PbZrO3 (x = 0) above Tc is glasslike, with both the magnitude and T dependence (dκ/dT > 0) being comparable to those of amorphous silica. 25) Such glasslike κ occurs when the l of phonons is limited to the order of lattice spacing, at which heat is carried by a random walk of energy between localized oscillators. 38) Since PbZrO3 is a stoichiometric compound without chemical disorder, the glasslike κ should be attributed to large anharmonic distortions, especially the off-center displacements of Pb and O ions reported in structural studies. 19,21) Indeed, these displacements are known to diminish in the AFE state, 21) and this is reflected in the κ as the observation of crystalline dκ/dT < 0 behavior below Tc.

Fig. 3. Thermal conductivity of PbZr1−x Tix O3. The results for 0 ≤ x ≤ 0.5 and 0.5 ≤ x ≤ 1 are plotted in the bottom and top panel, respectively. Note the different κ scales for the two panels. The data for x = 0 and 1 are reproduced from Ref. 25.
Download figure:
Standard image High-resolution imageAs we move to x = 0.2, the κ values in the cubic region increase slightly (∼10%) compared to x = 0; this could suggest that the FE lattice instability in x = 0.2 has a weaker effect in suppressing the κ than the AFE instability in x = 0. More importantly, the glasslike κ is now extended into the FE rhombohedral region below Tc, with a possible sign for a dip near 400 K due to the FR(HT) to FR(LT) transition. We take the glasslike κ below Tc to be a signature of structural complexity in the FE rhombohedral region, where the displacements of Pb and O ions are known to persist 21) and phase coexistence of rhombohedral and monoclinic structures has been widely recognized. 10–14) With further increase in x, κ remains very similar in shape and drops in value up to x = 0.5, indicating the persistence of structural complexity throughout this composition region. At x = 0.5, the κ is only slightly larger than the minimum theoretical limit calculated for PbZrO3, 39) which is ∼0.85 and 0.9 W m−1 K−1 at 300 and 400 K, respectively. Although x = 0.5 is nominally in the tetragonal region, it still contains significant disorder due to its proximity to the MPB; according to a recent study, 11) this composition contains a mixture of tetragonal, rhombohedral, and monoclinic structures.
At this point, it should be mentioned that the κ of bulk PZT samples have been reported, 33,40,41) which show 2.5, 1.3 and 1.8, and 0.9 W m−1 K−1, respectively, at 300 K. However, these studies used commercial "PZT" ceramics, which are intentionally doped with impurities to modify the piezoelectric and other properties. 1) (One study 33) found the composition to be Pb[Ti0.37Zr0.24Nb0.25Ni0.14]O3). Such modification in composition can explain the discrepancies in κ data (especially the T dependence), 33,40,41) both with each other and with our present data on pure PZT samples.
For 0.5 ≤ x ≤ 1 in the tetragonal regime, different behaviors are observed as a function of x. The end member PbTiO3 (x = 1) exhibits a typical crystalline behavior, where κ drops approximately as T−1 above 300 K; it implies that heat is carried by extended wavelike phonon excitations, with l being limited by the usual Umklapp phonon–phonon scattering. 24,38) After a jump around Tc, the dκ/dT < 0 behavior continues in the cubic phase region, and this concurs with the negligible ionic displacements reported for PbTiO3. 19,42) With decreasing x from x = 1, the κ in the FE tetragonal region evolves continuously, without becoming truly glasslike until x = 0.5. This smooth transitional behavior supports the view that the tetragonal region is basically a single phase and structurally simpler than the rhombohedral region. 8,9) Perhaps more interesting is the result for the cubic phase, where the glasslike T dependence is seen for all the compositions except x = 1. Previously, the synchrotron X-ray diffraction study 19) on the cubic phase reported the off-center displacements of Pb ions to persist from x = 0 to at least up to x = 0.75, and subsequent neutron diffraction study 20) showed that O ions are also displaced at least up to x = 0.6 (compositions with higher x, except x = 1, were not examined in these studies). Considering the close correspondence between the structural and κ data, the glasslike κ in the cubic phase should be attributed to the local ionic displacements, which are prevalent in all PZT except in the close vicinity of x = 1.
Having examined the T dependence of κ, we now discuss its composition dependence. Previously, Foley et al. 39) have reported on the κ of PZT thin films (0 ≤ x ≤ 1) at room temperature. As shown in Fig. 4(a), κ of the thin films 39) are nearly constant at ∼1.3 W m−1 K−1 for 0 ≤ x ≤ 0.48, drop to ∼1.0 W m−1 K−1 across the MPB, and increase with x in the tetragonal region. In contrast, our bulk κ at 300 K shows a "V" shaped minimum at x = 0.5, with no apparent discontinuity across the MPB. Regardless of these differences, both sets of data show a minimum at x ≈ 0.5, and it is tempting to associate this feature with the anomalies in other physical properties of PZT. In particular, on approaching the MPB, (i) all the elastic moduli are alowered 2,43) [the data 44) for 1/s33 E are plotted in Fig. 4(b)], indicating a reduction of the phonon group velocity v, and (ii) the damping constant γ of the lowest frequency transverse optic mode in the THz range 23) increases significantly [Fig. 4(b)], suggesting that, through the optic-acoustic mode coupling, 45,46) acoustic phonons also show damping and reduction of l near the MPB. From the kinetic expression κ = (1/3)Cvl, where C is the heat capacity per unit volume, such reduction in both v and l can lead to a minimum in κ at the MPB.

Fig. 4. (a) Thermal conductivity of PbZr1−x Tix O3 as a function of x at 300 and 773 K, and for Foley et al.'s thin film data 39) at room temperature. (b) The elastic modulus 1/s33 E at room temperature 44) and the damping constant γ of the lowest frequency transverse optic mode in the THz range. 23) The γ shown were obtained at 80 K, but γ at other temperatures show very similar x dependence. 23)
Download figure:
Standard image High-resolution image
On the other hand, this interpretation cannot explain the persistence of the minimum at x = 0.5 in the cubic phase [κ at 773 K is shown in Fig. 4(a)], where the MPB is no longer present. In the cubic phase, the minimum is simply attributed to the point-defect alloy scattering, 38,47) which arises from Zr and Ti occupying the same structural site—in the PZT solid solution, mass fluctuations from the difference in mass (MZr = 91.22 u and MTi = 47.87 u) and strain fields from the difference in ionic radius (rZr = 0.72 Å and rTi = 0.605 Å) create point-defect phonon scattering, which is not present in the end compounds PbZrO3 and PbTiO3. Moreover, this contribution is usually most pronounced near 50% substitution, 38,47) coinciding with the κ minimum at x = 0.5 in PZT. Since the same point defects are present below Tc, quantitative analysis of κ for ferroelectric PZT must consider the two critical features: the point-defect scattering and the changes in physical and structural properties around the MPB. We believe this is an important point to bear in mind, especially as first-principles calculations of κ for PZT are beginning to emerge in the literature. 48)
To conclude, we have presented the systematic evolution of κ in PZT, for the composition and temperature ranges covering the classic phase diagram of Jaffe et al. 2) In 1971, these authors wrote in the preface to their book 2) that "thermal conductivity data are so scarce and self-contradictory that we have left them out." While this situation did not improve much in the last 52 years, it is felt that the present data can serve as a definite contribution to this topic. In particular, with the current interest in the electric-field switching of κ, 33,48) the basic insights obtained in this study should become useful in further applications of PZT.
Acknowledgments
This study was supported by funding from JST-Mirai JPMJMI19A1.