
Abstract
Anomalously large heat generation phenomena that cannot be explained by any known chemical processes were discovered: Ni-based nano-structured multilayer metal composites were preloaded with hydrogen gas and heated rapidly to diffuse hydrogen and trigger the heat generation reaction. Maximum energy released per total hydrogen absorption was over 10 keV H–1 and no gamma rays or neutrons, which are harmful to the human body, were observed. It is possible to intentionally induce the heat burst phenomenon, which can increase the amount of heat generated without any new energy input. This can be applied to reaction control as well as to improving the accuracy of heat generation evaluation. A common feature, that regions of very high oxygen concentrations are observed in places, was observed in the heat-producing samples. At this time, however, the discussion of this oxygen concentration as nuclear in origin must exclude the possibility of many chemical processes.
Export citation and abstract BibTeX RIS

Content from this work may be used under the terms of the Creative Commons Attribution 4.0 license. Any further distribution of this work must maintain attribution to the author(s) and the title of the work, journal citation and DOI.
1. Introduction
The problem of climate change is becoming more and more serious around the world. One of the causes of this climate change is global warming caused by the anthropogenic release of greenhouse gases such as carbon dioxide and methane gas. Therefore, there is a shift to renewable energy sources such as wind power and solar cells that do not emit greenhouse gases. However, renewable energies have the disadvantage of low energy density and unstable energy output that depends on the climate. Nuclear energy, on the other hand, does not emit carbon dioxide, and its output is stable, but the Chernobyl and Fukushima accidents have made it difficult for the public to accept the expansion of nuclear power.
We have been studying anomalously large heat generation due to the interaction between nano-structured metals and hydrogen as a candidate for global warming countermeasures. Our research belongs to the field of "condensed matter nuclear science," originating in 1989 with Fleischmann and Pons' electrolysis of Pd with heavy water. 1,2) After the announcement by Fleishman and Pons, many experiments were conducted using electrolysis methods with Pd and heavy water. 3–6) However, due to the low reproducibility of the phenomenon, the number of researchers in this field decreased, but international conferences were held regularly, and international and national research meetings were also held. In this background, some researchers began to study the anomalous heat generation or nuclear transmutation when hydrogen/deuterium is absorbed into metal by gas absorption, rather than by electrolysis. These experimental techniques are called "gas loading," and Fig. 1 shows an overview of the main researchers. 7,8)
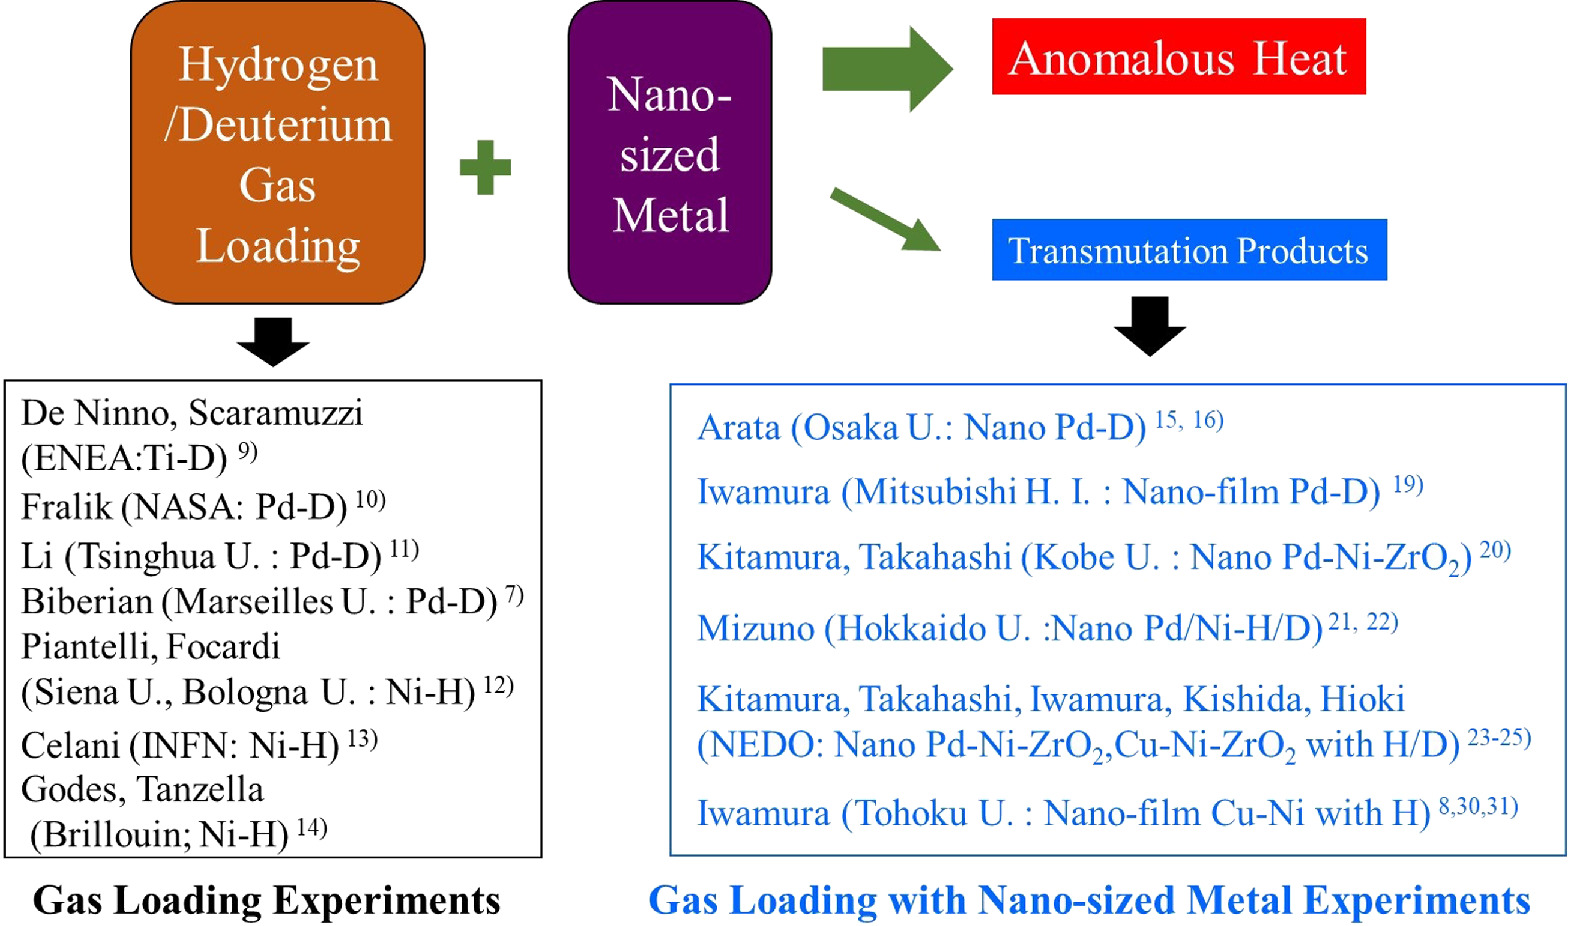
Fig. 1. Gas loading experiments and gas loading with nanosized metal experiments in the field of condensed matter nuclear science.
Download figure:
Standard image High-resolution imageImmediately after the cold fusion announcement, De Ninno, Scaramuzzi, and their colleagues began to conduct experiments with the gas loading method. They tried to detect neutrons or protons from deuterated Ti. 9) In the same year, 1989, Fralick et al. first did excess heat experiments using deuterium gas and Pd. 10) They made experiments that involved introducing deuterium into the palladium filter of a hydrogen purifier. It was designed to detect neutrons produced in the DD fusion reaction (D + D −> He + n) as well as heat production. They observed significant heat generation, but no significant neutron increase, and concluded that DD fusion did not occur. Later, Li and Biberian became interested in Fralick's experiments and performed similar experiments diffusing deuterium in Pd. And both confirmed significant heat generation. 7,11)
Until then, experiments have mainly focused on the palladium–deuterium system, but reports have emerged that significant heat generation can also be observed in the nickel–hydrogen system. Forcadi and Piantelli first demonstrated significant heat generation using Ni and hydrogen. 12) Francesco Celani observed anomalous heat using a Ni-based alloy (Constantan) and hydrogen gas. 13) The company Brillouin is now attempting to commercialize a pulsing method called Q-pulse using a Ni–hydrogen system. 14)
The above studies were experiments in which palladium or nickel was used to absorb deuterium or light hydrogen. However, Arata's research 15) in 1998 led to the idea that nanoscale materials may be important for inducing anomalous phenomena. The following studies were based on nanoscale materials in addition to gas loading. Arata demonstrated long-term excess heat data using Pd fine powder and deuterium. 15) He presented data showing that heat generation correlated with the production of helium-4. 16) The correlation between heat generation and helium-4 has been reported in many electrolysis experiments. 17,18) Later, in 2002, Iwamura and Itoh, one of the authors, were the first to observe transmutation reactions induced by deuterium gas permeation through a nano-structured Pd and CaO multilayer thin film. 19) As an extension of Arata's work, Kitamura and Takahashi reported heat generation of about 2–3 eV per hydrogen or deuterium when deuterium or hydrogen was absorbed by a material with Pd nanoparticles (about 100 nm in diameter) supported on ZrO2 in 2009. 20) Mizuno sputtered palladium with a glow discharge to form fine structured palladium on the surface of a nickel mesh, where deuterium was absorbed and observed tens of watts of heat generation. 21,22)
Based on the work of Kitamura and Takahashi, which was conducted in collaboration between Kobe University and Technova Inc., a NEDO (New Energy and Industrial Technology Development Organization) project involving researchers from Tohoku University, Nagoya University, Kyushu University, and Nissan Motor Co. was conducted from 2015 to 2017. In this project, heat generation that cannot be explained by any known chemical reactions was observed when deuterium or hydrogen was absorbed by materials with Pd, Ni, and Cu nanoparticles supported on ZrO2. 23) The same apparatus as that at Kobe University was also installed at Tohoku University. The nanoparticle materials prepared at Kobe University were divided into two parts, and similar heat generation phenomena were observed under the same experimental conditions at Kobe and Tohoku Universities. 24,25) In this series of experiments, the maximum heat generation was 270 keV per deuterium, and the heat generation per hydrogen or deuterium was mostly in the range of 0.1 to 1 keV. 23–25)
As described above, an anomalous heat generation phenomenon, which known chemical processes cannot explain, has been reported in experimental systems consisting of nano-structured metal composites and hydrogen gas. Strong gamma rays and neutrons, which can affect the human body, have not been observed during anomalous heat generation. This phenomenon has the potential to realize a new safe and compact energy source that would provide us with sufficient energy to meet all our needs without carbon dioxide emissions.
We briefly describe how our current research methodology was initiated. Originally, we found transmutation phenomena induced by deuterium gas permeation through nanosized Pd multilayers doped with Cs and other elements 19,26–28) as shown in Fig. 2. We observed the transmutation of Cs into Pr by this method at the laboratory of Mitsubishi Heavy Industries Ltd, which has been reproduced by other independent research institutes. 29) These studies showed that the diffusion of deuterium and nano-structured multilayers are key factors in inducing the transmutation reaction. After moving to Tohoku University, we had a chance to participate in the NEDO project to observe anomalous heat generation by deuterium or hydrogen absorption in Pd or Ni nanoparticles. 23–25) We learned that anomalous phenomena occur not only with deuterium but also with light hydrogen, and that the nano-structured composite particle is one of the key factors to inducing anomalous phenomena. By combining the two methods, we have developed a present experimental procedure to induce heat generation reaction by loading light hydrogen in a nickel-based composite material with nano-structured multilayers, and then diffusing the light hydrogen through the nano-multilayers by rapid heating. This method has led to a larger excess energy per hydrogen atom more than 10 keV H–1. 8,30,31)
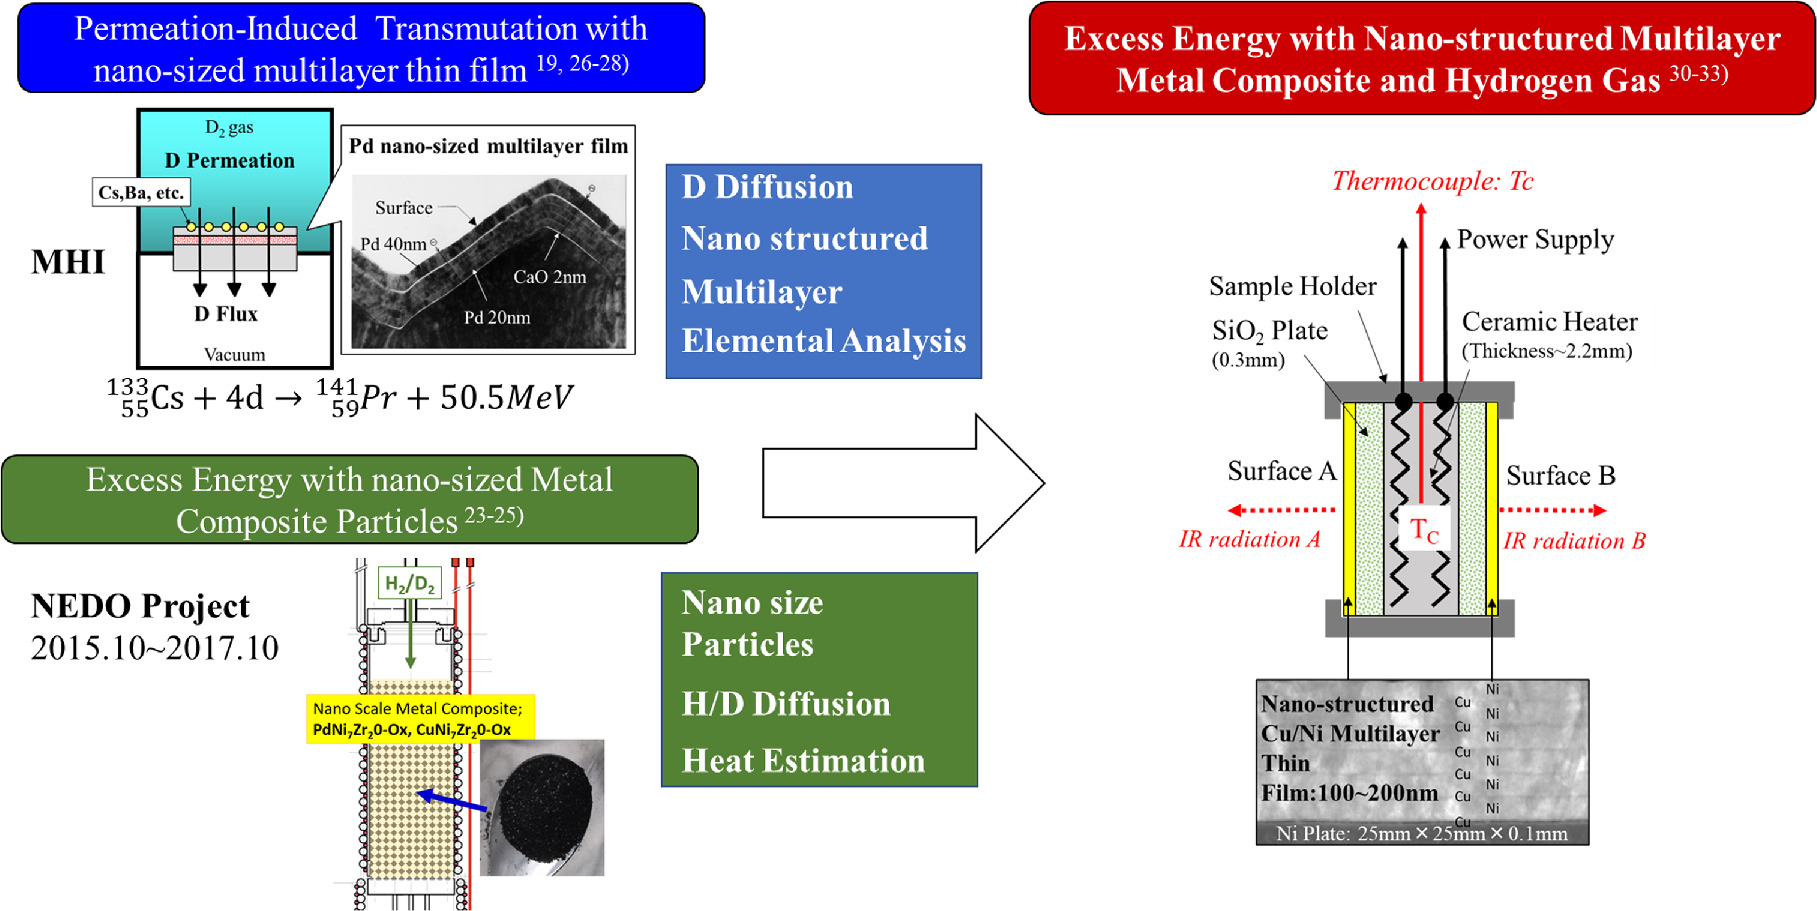
Fig. 2. Background and motivation of the present experimental method.
Download figure:
Standard image High-resolution imageThe field of "condensed matter nuclear science" has been gaining attention again for a little over a decade. The main reasons for this are that the materials used have become cheaper and more abundant, and the usable temperature range has increased from RT to the order of hundreds of °C. 31) In the early stages, expensive materials such as palladium and deuterium were mainly used, but recently nickel and ordinary hydrogen have been used. Also, in the early stages, electrolysis of Pd was the main method, which generated heat at RT levels because Pd only holds a large amount of deuterium at temperatures below about 100 °C. However, recent Ni-based materials absorb hydrogen at the level of several hundred °C and thus generate heat in the temperature range of several hundred °C, making it possible to turn turbines with high-temperature gases, which has opened the way for industrial applications. Recently, the EU government launched two projects (totaling 10 million euros) starting in 2020. One is "Clean Energy from Hydrogen - Metal Systems" and the other is "Breakthrough Zero Emission Heat." The U.S. government then initiated a $10 million national project in February 2023. The project is called "LENR: Low Energy Nuclear Reactions," and seven research institutes, including MIT, are participating in the project, which is funded by ARPA-E.
In this paper, by conducting heat generation experiments with a variety of samples, we found a new phenomenon called heat burst, and show that this phenomenon improves the accuracy of heat generation evaluation. In addition, from the analysis of the samples after the experiments, we report the results of anomalous oxygen concentrations observed for the samples in which anomalous heat generation was observed. We discuss the relationship between this phenomenon and the anomalous heat generation.
2. Experimental methods
A schematic of our experimental apparatus is shown in Fig. 3(a). It is basically the same as in Refs. 8, 30, 31. Two nano-structured metal multilayer composite samples, which were composed of Ni, Cu, and CaO thin films on bulk Ni (25 mm × 25 mm × 0.1 mm), were placed in the center of the chamber. H2 gas and its pressure were monitored by a Pirani gauge and a cold cathode gauge. The chamber was evacuated by a turbo-molecular pump. The multilayer samples were heated up by a ceramic heater (MS-1000R; Sakaguchi E. H Voc Corp.) in which a thermocouple (TC; Pt-PtRh13%) was embedded. Surface temperatures for the two nano-structured metal multilayer composite samples were measured by two thermometer detectors (IR-CZQ2N, CHINO Corp.). They were made of InGaAs and a dual-wavelength mode, 1.55 μm and 1.35 μm, was usually used. During the surface temperature measurement, it was possible to measure the emissivity of the sample surface by switching between the single wavelength mode and dual-wavelength mode. The heater input power was supplied by a DC power source in constant voltage mode. The input voltage and current were measured both by voltage and current monitors provided by the power supply and an independent voltmeter and amperemeter, respectively. Input power is calibrated using the voltmeter and the amperemeter readings. Gamma-rays and neutrons were monitored by a NaI (Tl) scintillation counter (TCS-1172; Hitachi, Ltd) and He-3 counter (TPS-1451; Hitachi Ltd) during all experiments for safety reasons. The Quadrupole Mass Spectrometer (Q-mass: Qulee BGM-202, Ulvac Cryogenics Inc.) was installed near the TMP of the exhaust pipe, and installed in a position where the generated gas could be detected without interfering with the chamber under thermal evaluation.
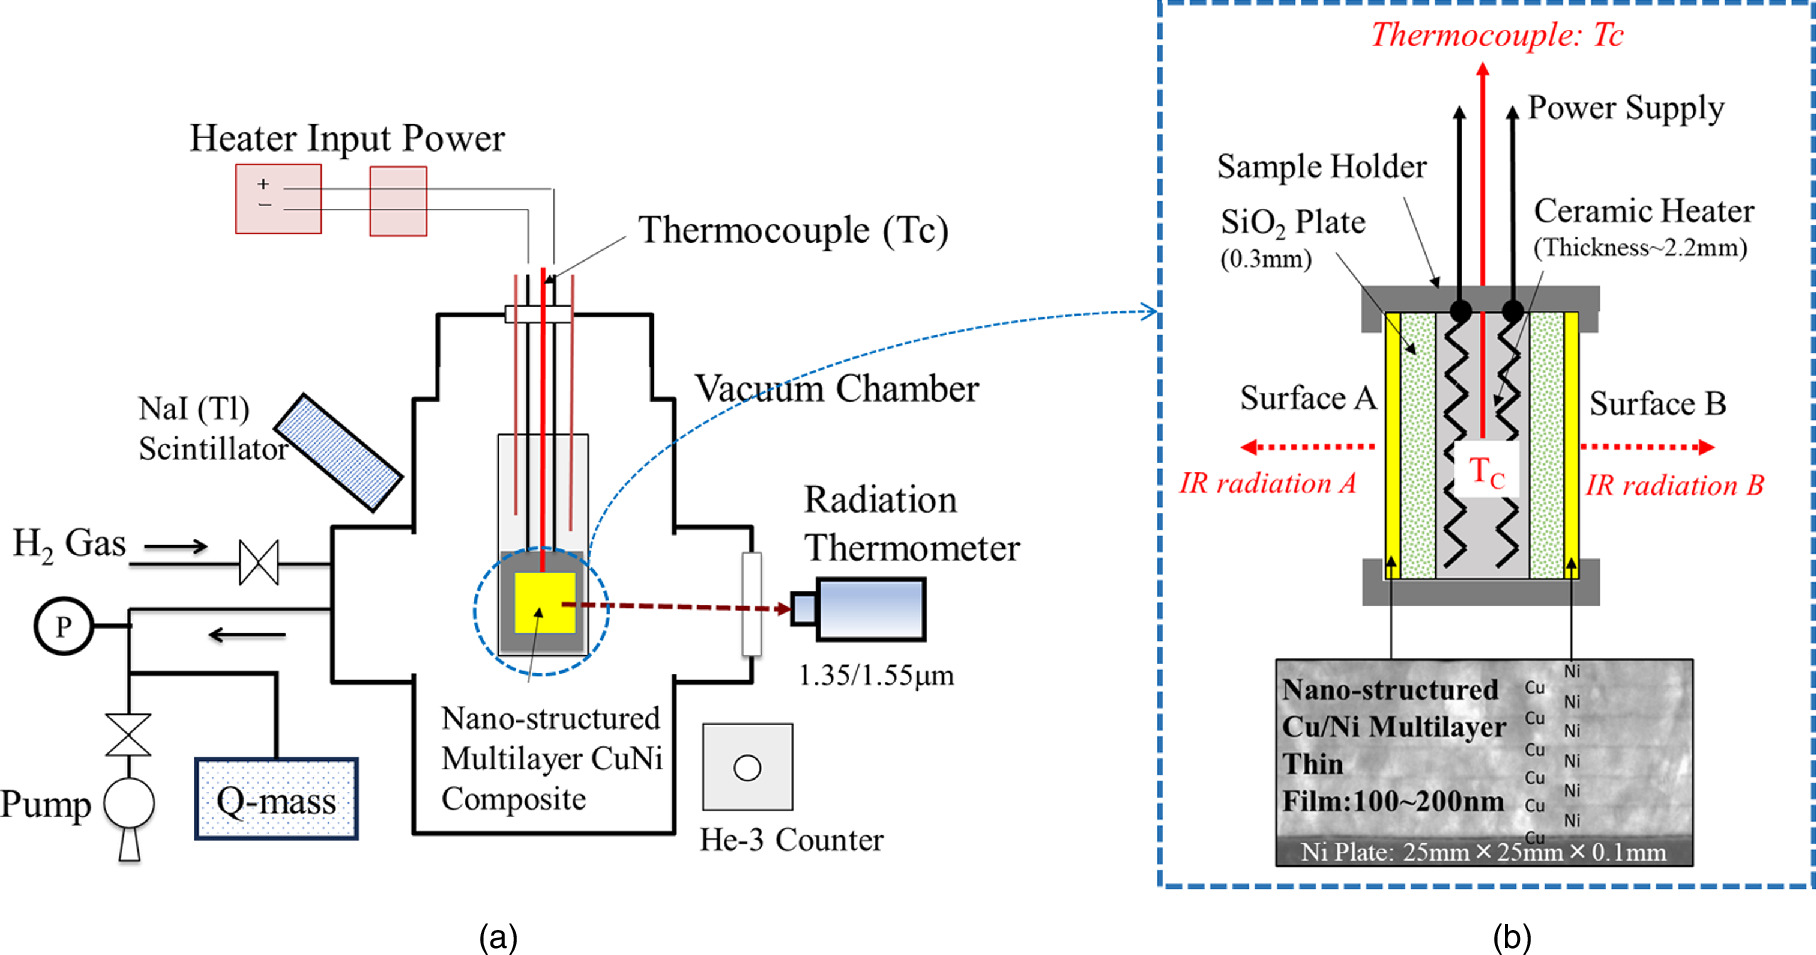
Fig. 3. Experimental set-up; (a) schematic of experimental apparatus and (b) detailed drawing around nano-structured multilayer metal composite.
Download figure:
Standard image High-resolution imageA detailed drawing of the Ni-based nano-structured metal multilayer composite is shown in Fig. 3(b). It was composed of a Ni Plate (25 mm square and 0.1 mm thickness, purity up to 99.9%, Furuuchi Chemical Co.) and Cu–Ni multilayer thin film (20 mm diameter circle and about 100–150 nm thick).
Sample preparation is as follows. The Ni plate was washed with acetone and annealed in vacuum (<10−4 Pa) at 900 °C for 72 h. It was then cooled to RT in a furnace and etched with HNO3 to remove impurities on the surface of the Ni plate. The surface of the plate was covered by layers of Cu (few nm) and Ni (few 10 nm) which were obtained by alternatingly sputtering Cu and Ni layers. CaO or Y2O3 thin films were inserted into the Ni layers in some cases. Fabrication processes were performed by Ar ion beam sputtering or magnetron sputtering. In the case of Ar ion beam sputtering, samples were sputtered at RT and the voltage and current of the Ar beam were 1 kV and 10 mA, respectively. When magnetron sputtering was used, six layers of films were deposited under sputtering conditions of 200 W for 184 s for Ni and 60 W for 82 s for Cu, for example.
Two nano-structured metal multilayer composite samples were heated by the ceramic heater (25 mm square and 2.2 mm thick) through SiO2 plates (0.3 mm thick). If certain energy generation reactions occur on the surface of the samples, the temperature of the embedded thermocouple will rise. Simultaneously, IR emission detected by the radiation thermometer, which corresponds to the surface temperature of the sample, would increase. Photos of the experimental set-ups and scanning transmission electron microscope (STEM) image of the Cu–Ni multilayer thin film are shown in Fig. 4.

Fig. 4. Photos of experimental apparatus and cross-sectional view of nano-structured metal multilayer composites; (a) outer view of the present experimental det-ups and (b) STEM image of Cu–Ni of nano-structured metal multilayer composites.
Download figure:
Standard image High-resolution imageThe experimental procedure is as follows. Two nano-structured metal multilayer composites were placed in the chamber and baked for 2–3 days at heater temperature 900 °C to remove H2O and other hydrocarbons from the surface under vacuum conditions.
According to general knowledge, Cu and Ni diffuse into each other during the baking process, forming a Cu–Ni alloy. However, in our multilayer film, Cu and Ni are not simply alloyed, especially when CaO, Y2O3, etc are added to Ni.
After the baking process, H2 gas was introduced into the chamber up to about 250 Pa at 250 °C. To change the hydrogen loading conditions, the pressure of H2 gas was sometimes increased up to 30 kPa. H2 gas was loaded for about 16 h. Then, H2 gas was evacuated by the turbo-molecular pump and simultaneously the samples were heated up by the ceramic heater up to 500 ∼ 900 °C. These processes trigger heat generation reactions and anomalous heat. Typically, after 8 h, the heater input was turned down and the samples were cooled down to 250 °C. These processes (H2 gas loading, heating up, and cooling down samples) were repeated several times, with different heating temperatures or H2 gas loading pressure.
After the experiment was performed, the samples were examined using scanning electron microscopy (SEM)/energy dispersive X-ray spectroscopy (EDX) and time-of-flight secondary ion mass spectrometry (TOF-SIMS). The morphology and chemical composition on the sample surface where such heat bursts may have occurred were evaluated. The analysis procedures are as follows. Firstly, the samples were observed under SEM/EDX (JSM-6500F, JEOL). SEM observations were carried out at an accelerating voltage of 5 kV or 15 kV. Additionally, EDX analysis was conducted with an acceleration voltage of 15 kV. Then, specific regions with common characteristics were identified in the samples that produced excess heat energy in the experiment. These areas were selected as measure points for performing TOF-SIMS analysis to obtain the two-dimensional elemental distributions and depth profiles. TOF-SIMS measurements were conducted with a TOF-SIMS 5 (ION-TOF, GmbH) equipped with a 25 keV Bi+ primary ion gun, an ion current of 0.8 pA, and a field of view of 100 × 100 μm2. The bunching mode was employed to obtain results with higher mass resolution.
During the above experimental procedure, hydrogen atoms are supposed to diffuse from the Ni plate through the nano-structured metal multilayer to the surface. The diffusion mechanism of hydrogen atoms is well known as "quantum diffusion". 32,33) Hydrogen atoms are hopping from one site to another site in metal. We assume that hydrogen flux is one of the key factors to induce anomalous heat generation phenomena and the hydrogen flux is intentionally arranged by the present experimental method. Hydrogen flux J from the nano-structured metal multilayer composite to the chamber is caused by the gradient of hydrogen concentration and gradient of temperature as shown in Eq. (1). 33)

where n is the number of lattice atoms per unit volume, c is the hydrogen concentration defined as the hydrogen/host-metal atom ratio, D is diffusion coefficient and Q* is the heat of transport.
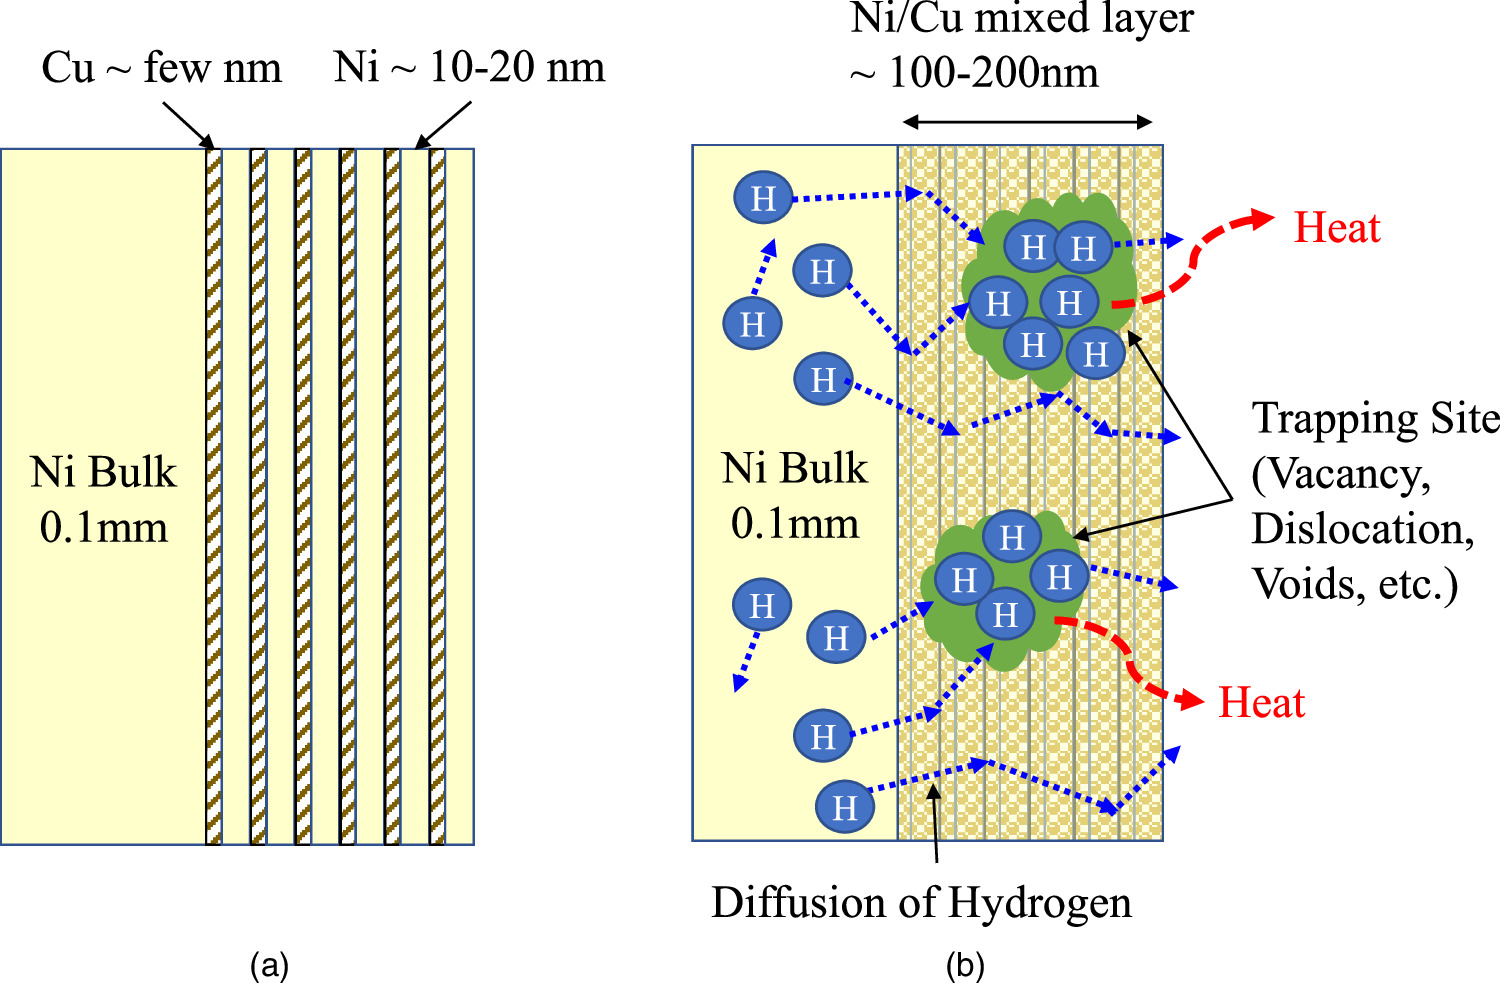
Based on the overall results of the experiments obtained so far, we are assuming the hypothetical model as shown in Fig. 5. Figure 5(a) shows the nano-structured metal multilayer composites immediately after sputtering, and Fig. 5(b) is a hypothetical model of the exothermic reaction. The hydrogen is absorbed in the bulk Ni (25 mm × 25 mm × 0.1 mm) and in the multilayer near the surface by the hydrogen loading process, and then the hydrogen inside diffuses by evacuation and rapid heating by the heater. In this process, hydrogen is trapped in the trapping sites, such as vacancy, dislocation, or voids. For example, first-principles calculations have shown that as many as four or six hydrogens can be trapped in the vacancy. 34) At this stage, we assume that the observed anomalous heat generation reaction may occur at such sites where many hydrogen atoms are trapped. In any case, this hypothetical model will have to be developed according to the experimental results obtained in the future.

Fig. 5. Hypothetical model: Trapped hydrogen and diffusion of hydrogen may be the key to induce anomalous energy generation phenomena; (a) fabricated nano-structured Ni-based composite material and (b) a hypothetical model of anomalous heat generation induced by hydrogen trapping and hydrogen diffusion.
Download figure:
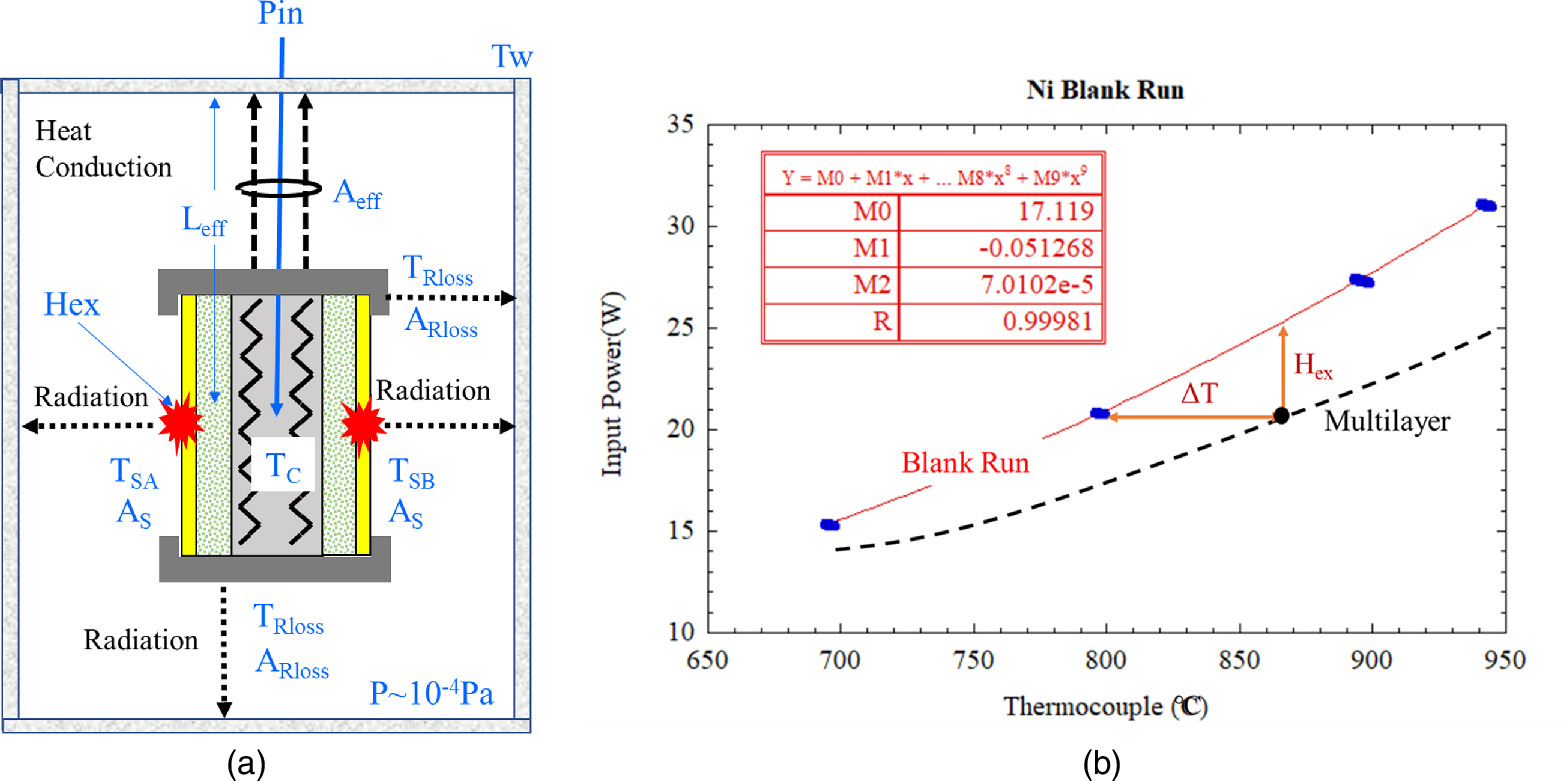
Standard image High-resolution imageExcess heat is evaluated based on the model described in Fig. 6(a) and the following Eq. (2) can be written as:
where keff is the equivalent thermal conductivity, Tc is the thermocouple temperature embedded in the ceramic heater, Tw is the wall temperature of the chamber, Leff and Aeff are the effective length and effective surface area between the sample holder and wall, respectively. As is the surface area of the sample, TS is the surface temperature, ε is the emissivity of the sample, σ is the Stefan–Boltzmann constant. subscript A and B means surface A and B, respectively. ARloss, εRloss and TRloss are effective surface area; effective emissivity, and effective surface temperature for radiation loss except from the sample surface, which is mainly derived from the sample holder. Pin is the electrical heater input and Hex is excess power. This equation is obtained under the following assumptions.
- 1)Thermal conduction via H2 gas is negligible because H2 pressure is low.
- 2)Radiation from the chamber wall is negligible because Tw is at RT.
- 3)The electrical input power is constant.

Fig. 6. Excess heat evaluation; (a) Model of excess heat evaluation and (b) relationship between input power (W) and thermocouple temperature (°C) for a blank run and a multilayer run.
Download figure:
Standard image High-resolution imageA blank run, in which same-sized Ni bulk samples without multilayer thin films were used, was performed with the same procedure described above. Figure 6(b) shows the relationship between input power given to the ceramic heater and heater temperature detected by the thermocouple. As the radiation loss term from the sample holder is the same for Ni bulk and multilayer samples for the same temperature, generated excess heat power is evaluated based on the blank run as shown in Fig. 6(b). Equation (1) for Ni bulk (subscript "0") is written as:
Excess heat analysis was done based on the assumption that ε is constant for the Ni-based nano-structured metal multilayer composite and Ni bulk. Emissivity ε can be measured by switching between the two wavelength mode and single wavelength mode. Actual measured emissivity was in the range of 0.1–0.2 at surface temperatures 700–750 °C, depending on the condition of the sample such as oxidation of surface or surface roughness, the vacuum of the experimental apparatus. However, the difference in emissivity between the Ni bulk and Ni multilayer composite samples is within 0.05, and the assumed condition is satisfied. Emissivity can be considered almost the same for the Ni bulk and multilayer composite samples.
Excess heat Hex can be derived based on the Eqs. (1) and (2). The detailed formulation is described in Ref. 8. The excess heat can be written as a function of ∆T. Therefore, excess heat evaluation by the Ni bulk calibration curve shown in Fig. 6(b) is valid under the assumptions in Ref. 8.
3. Results and discussion
3.1. Results
3.1.1. Anomalous heat generation
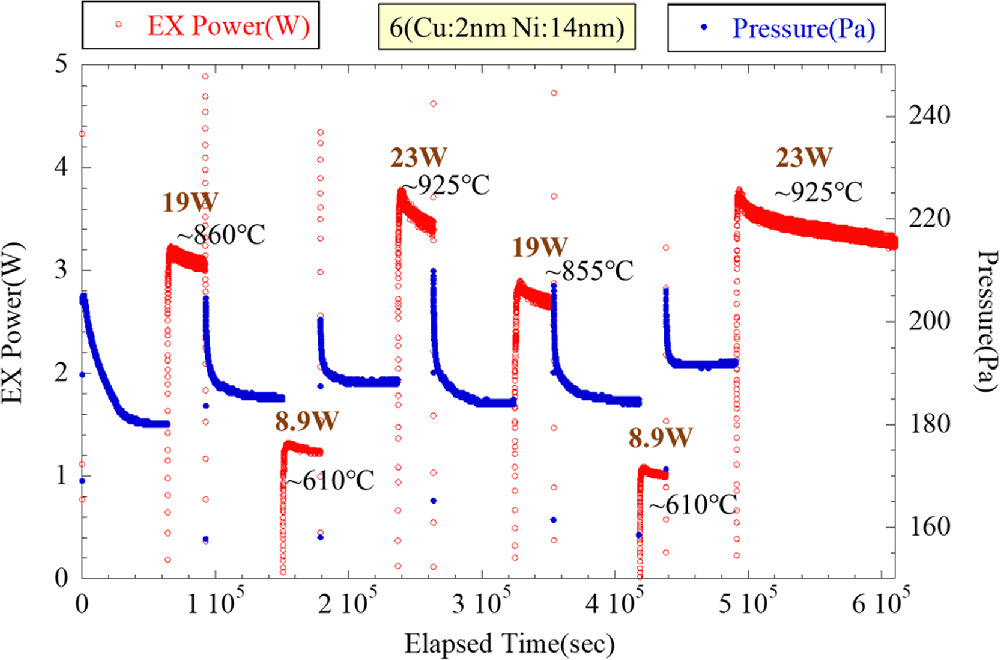
An example of excess heat generation is shown in Fig. 7. The samples were covered with six CuNi layers (Cu = 2 nm and Ni = 14 nm). The red and blue lines represent the excess heat and pressure of the chamber, respectively. At the beginning of the experiment, hydrogen gas was introduced to the chamber up to 200 Pa and absorbed into the Ni-based nano-structured multilayer metal composite at about 270 °C. The pressure for each experiment gradually decreased as shown in Fig. 7. The amount of hydrogen absorbed by each sample was estimated based on the pressure change and temperature of the chamber. After about 16 h, H2 gas was evacuated and simultaneously each sample was heated up by the ceramic heater. After that, excess heat more than input power was observed. The input power was stable during one cycle; for example, 19 W was applied to the ceramic heater from about 6 × 10⁴ sec to about 1 × 10⁵ sec.

Fig. 7. An example of excess heat generation.
Download figure:
Standard image High-resolution imageExcess heat power for various surface compositions is organized in the form of a function of Tc in Fig. 8: 3-layer CuNi7, 6-layer CuNi7, 6-layer CuNi7(CaO) film with a 2 nm CaO layer inserted in the 14 nm Ni layer, 6-layer CuNi7(CaO) film with 2 nm Y2O3 layer inserted in the Ni 14 nm film and 5-layer CuNi14 with 1 nm of Cu layer and 14 nm of Ni layer. The CuNi7 or CuNi7(CaO) samples show high excess heat in all temperature regions, while the 3-layer CuNi7 and 5-layer CuNi14 samples show less excess heat. Especially, the CuNi14 sample, which has a different ratio of Cu to Ni, shows lower excess heat. In addition, the Y2O3 sample shows a peak at a certain temperature and a decrease in excess heat above that temperature. Temperature dependencies for the four samples look like convex shapes. They did not depend on the 4th power of temperature, and it suggests that these observed excess heat powers were not attributed to the artifacts caused by thermal radiation.
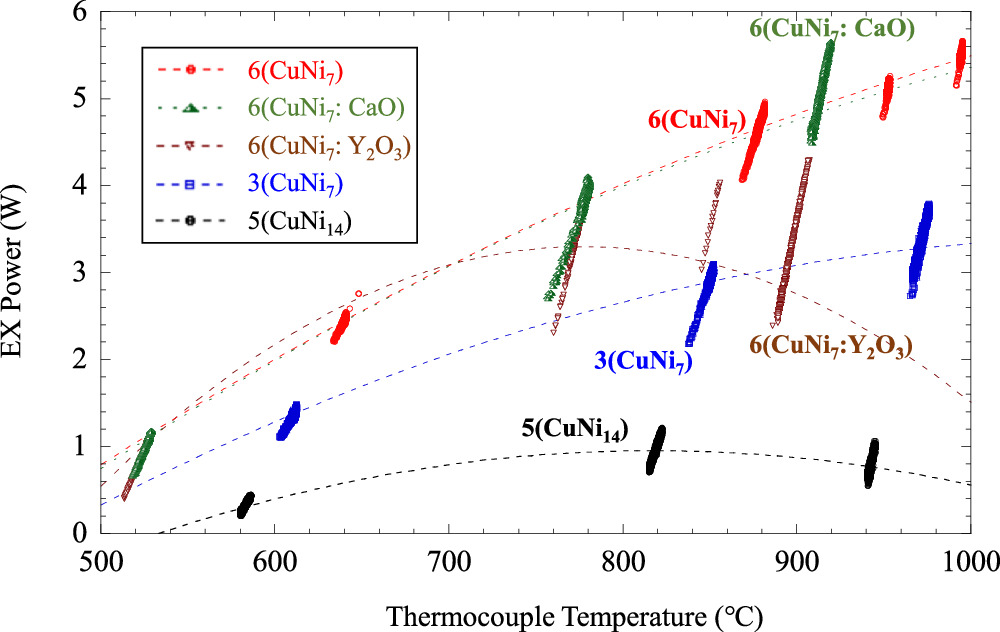
Fig. 8. Temperature dependence of excess heat power due to differences in the ratio of Cu to Ni, the number of layers, and the material inserted into Ni.
Download figure:
Standard image High-resolution image3.1.2. Heat burst
As the experiments progressed, spontaneous heat burst reactions were occasionally observed on the surface of nano-structured metal multilayer composites. Figure 9 shows an example of the spontaneous heat burst: temperature time variations for Tc, surface A and B. It is possible to see that heat release reaction occurred at the surface A at first and afterward at the surface B. Their heat bursts propagated to the thermocouple. Input power and RT remained constant during these events. Therefore, it was confirmed that these events were not caused by the change of electrical input power or heat income from the environment. The γ-ray and neutron counters did not show any significant increase during these bursts. Spontaneous heat bursts were sometimes observed on both sides or only on one side.
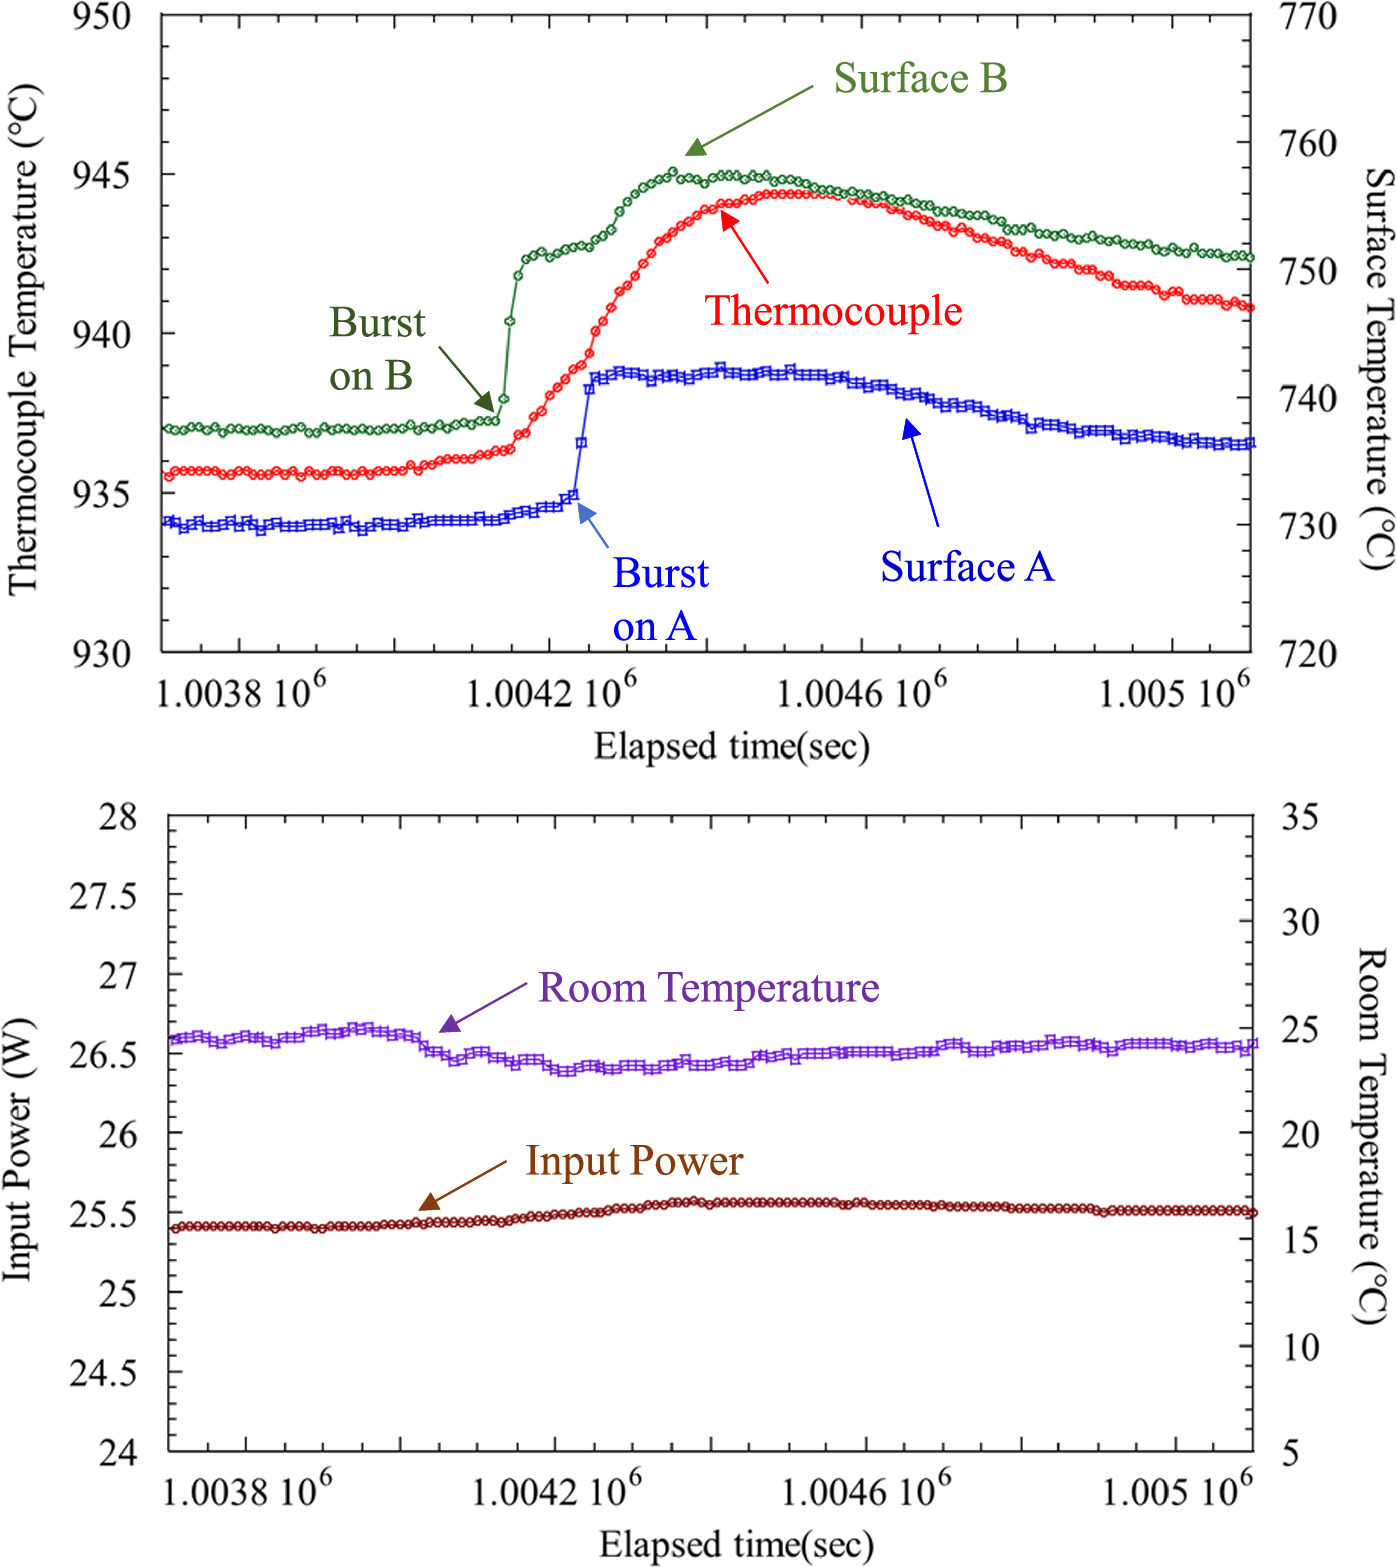
Fig. 9. Spontaneous heat burst phenomena occurred at surface B at first and afterward at surface A. Their heat bursts propagated to the thermocouple. Input power and RT were almost constant during these events.
Download figure:
Standard image High-resolution imageBy measuring the optical spectrum emitted from the sample using a different experimental setup, we detected that the mid-IR radiation flux increased simultaneously when the heat burst occurred. 35) This means that the heat burst is observed not only by the two-color surface thermometer but also by measuring the optical spectrum.
Careful observation of the case where the spontaneous heat burst phenomenon occurs revealed that the input power fluctuates slightly. Based on the observation of spontaneous heat burst phenomena, we tried to induce heat burst phenomena by giving a small perturbation in input power as shown in Fig. 10. A small perturbation in the input power leads to temperature changes in the nano-structured multilayer metal composite, which may perturb the hydrogen diffusion.
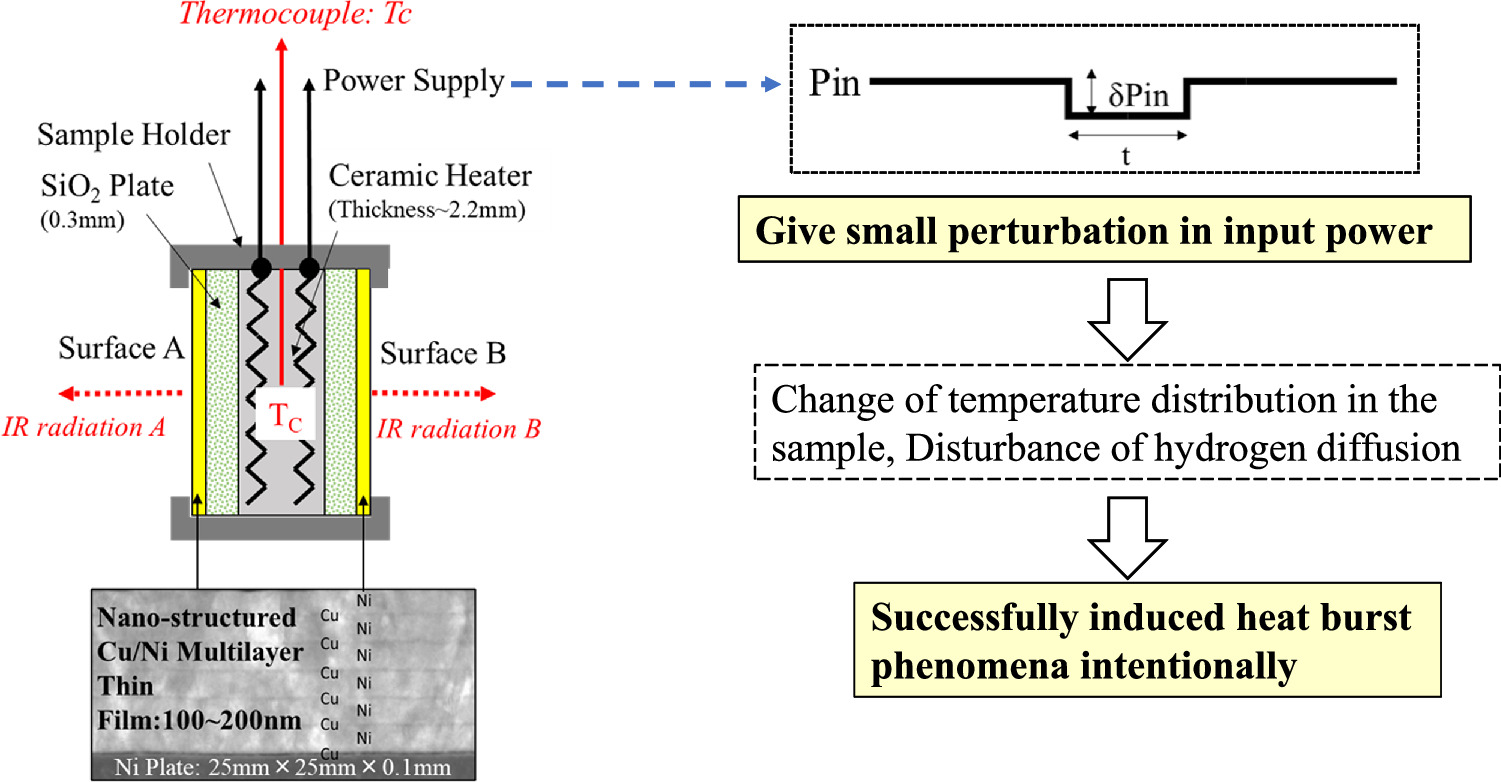
Fig. 10. Intentional induction of heat burst phenomena; Based on the observation of spontaneous heat burst phenomena, we tried to induce heat burst phenomena by giving small perturbation in input power.
Download figure:
Standard image High-resolution imageAn example of the heat burst phenomenon induced by an intentional perturbation of input electrical power is shown in Fig. 11(a). 6-layer CuNi7 was fabricated in this case. At the beginning, 25.8 W was given and decreased to 25.0 W. Then the Tc and surface temperature A and B decreased gradually. When the input was returned to the original input of 25.8 W, the surface temperature A, B, and Tc all increased and became larger than the values at the original input of 25.8 W. At maximum, Tc increased by about 9 °C, surface A by about 17 °C, and surface B by about 25 °C. Increases in surface A and B temperatures were larger and steeper than those of Tc as shown in Fig. 11(a). It can be considered that heat burst energy generated at the surface A and B, which is induced by the intentional perturbation of input power, propagated to the Tc.

Fig. 11. Different responses to intentional perturbations of input power; (a) An example of heat burst phenomena induced by the intentional perturbation of input electrical power and (b) an example of no heat burst phenomena induced.
Download figure:
Standard image High-resolution imageOn the other hand, an example of the no heat burst phenomenon induced by a similar perturbation is shown in Fig. 11(b). In this case, Ni bulk samples were used. When the input power, which was initially 23.0 W, was reduced to 22.1 W, the thermocouple and surface temperatures A and B gradually decreased. Then, when the input power was returned to 23.0 W, the heat burst phenomenon did not occur, and the thermocouple and surface temperatures A and B returned to their original values.
Next, we show how the intentional heat burst varies greatly depending on sample composition and other factors. Figure 12(a) shows an example of a heat burst for a 6-layer CuNi(CaO)7 sample with a 4.5 nm CaO layer inserted in a 14 nm Ni layer. Similar to the previous example shown in Fig. 11(a), the heat burst phenomenon occurs after about 60 s for surface B and 120 s for surface A, respectively, after the input power returns to its original value. Generated heat propagates to the heater center and the thermocouple temperature increases, similar to Fig. 11(a). This type of heat burst is the most common among the experiments conducted so far.
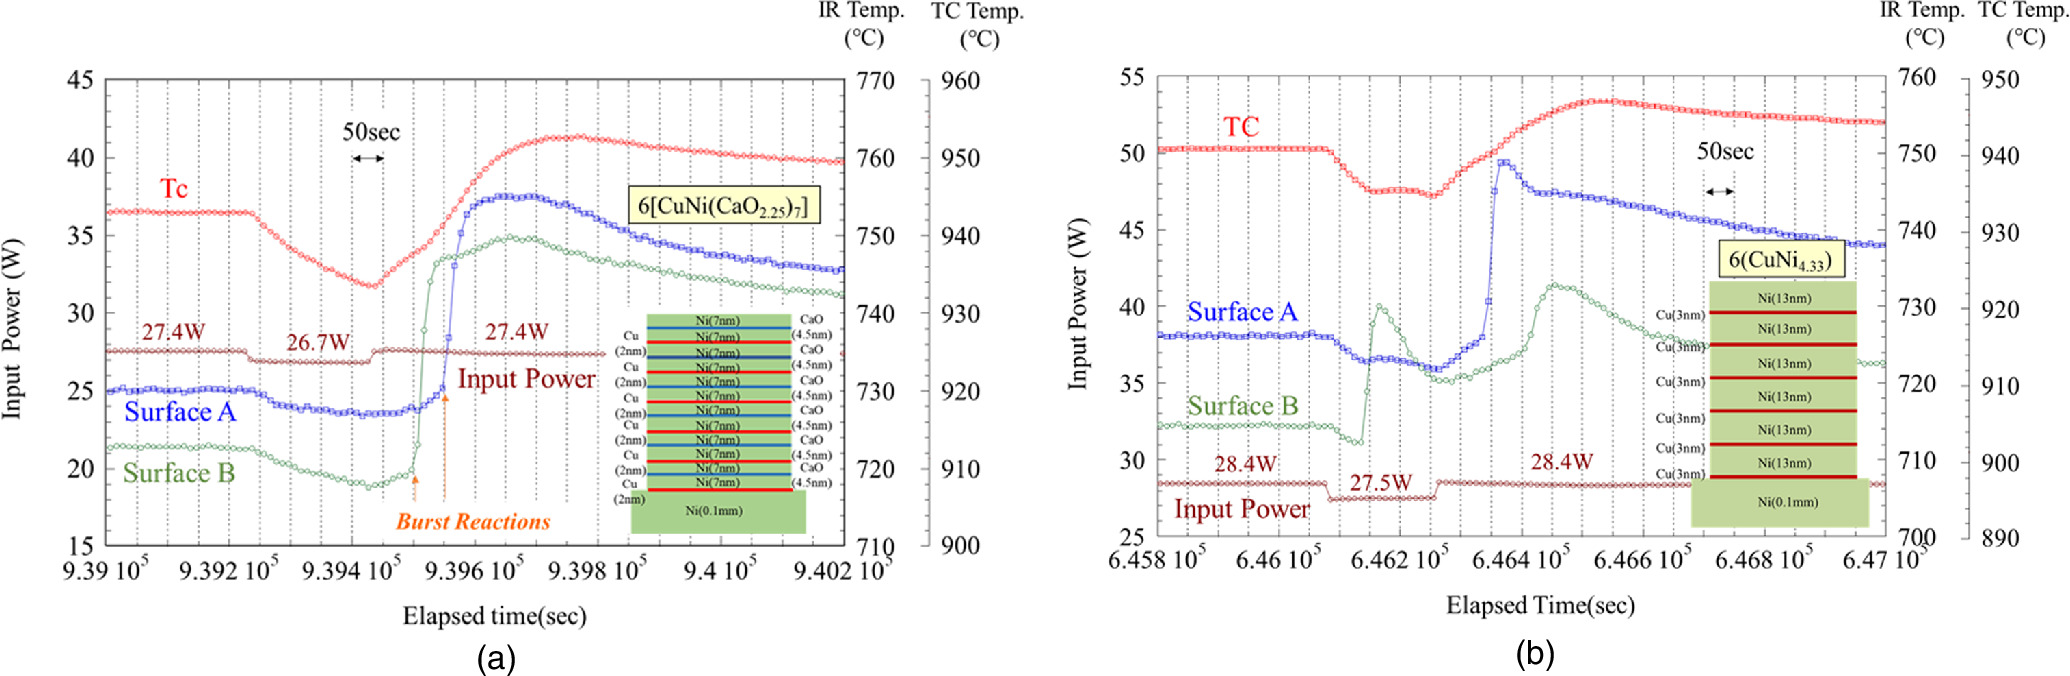
Fig. 12. Variation of heat burst triggered by input power perturbation; (a) An example of heat burst for a 6-layer CuNi(CaO) sample with a 4.5 nm CaO layer inserted in a 14 nm Ni layer and (b) an example of heat burst for a 6-layer CuNi sample under the condition that Cu thickness is thicker than usual (Ni/Cu ∼ 4.3).
Download figure:
Standard image High-resolution imageFigure 12(b) shows an example of a different type of intentional heat burst. After the input power was reduced from 28.4 W to 27.5 W, the heat burst phenomenon occurred on surface B before it was returned. A weak heat burst phenomenon appears to have occurred on surface A at about the same time. Also, as before, after the input power returned to 28.4 W, the heat burst phenomenon occurred again about 80 s later on surface A and about 130 s later on surface B. Note that the Cu thickness of this sample is thicker than usual, and the ratio of Ni to Cu is about 4.3.
According to experimental results, the intentional heat burst depends on (1) the composition and state of the sample, (2) the surface temperature of the sample, and (3) the amount and time range of the input power perturbation.
Next, we performed experiments aimed at increasing heat using this technique. Experiments were conducted in which a combination of negative and positive input power perturbations were given so that the average input power given was the same as the original value.
Figure 13 shows how the voltage is given. Thus, by satisfying the relationship between the positive and negative voltages to be perturbed and their durations, the heater was powered with the same overall input power, Pin.

Fig. 13. Experiments that give negative and positive input power perturbations so that the input power given on average is the same as the original value.
Download figure:
Standard image High-resolution imageFigure 14 shows the time variation of the thermocouple temperature Tc and the surface temperatures of surfaces A and B when the input power was perturbed in the above manner. As can be seen, the cycle was repeated, first giving 27.8 W, decreasing to 26.8 W for 3 min, and then giving 29.3 W for 2 min. We can see that the thermocouple temperatures Tc, surface A, and surface B show a gradual increase by using the combination of negative and positive perturbation of input power. In this example, despite the constant input power, the excess heat energy was increased by approximately 38 kJ.
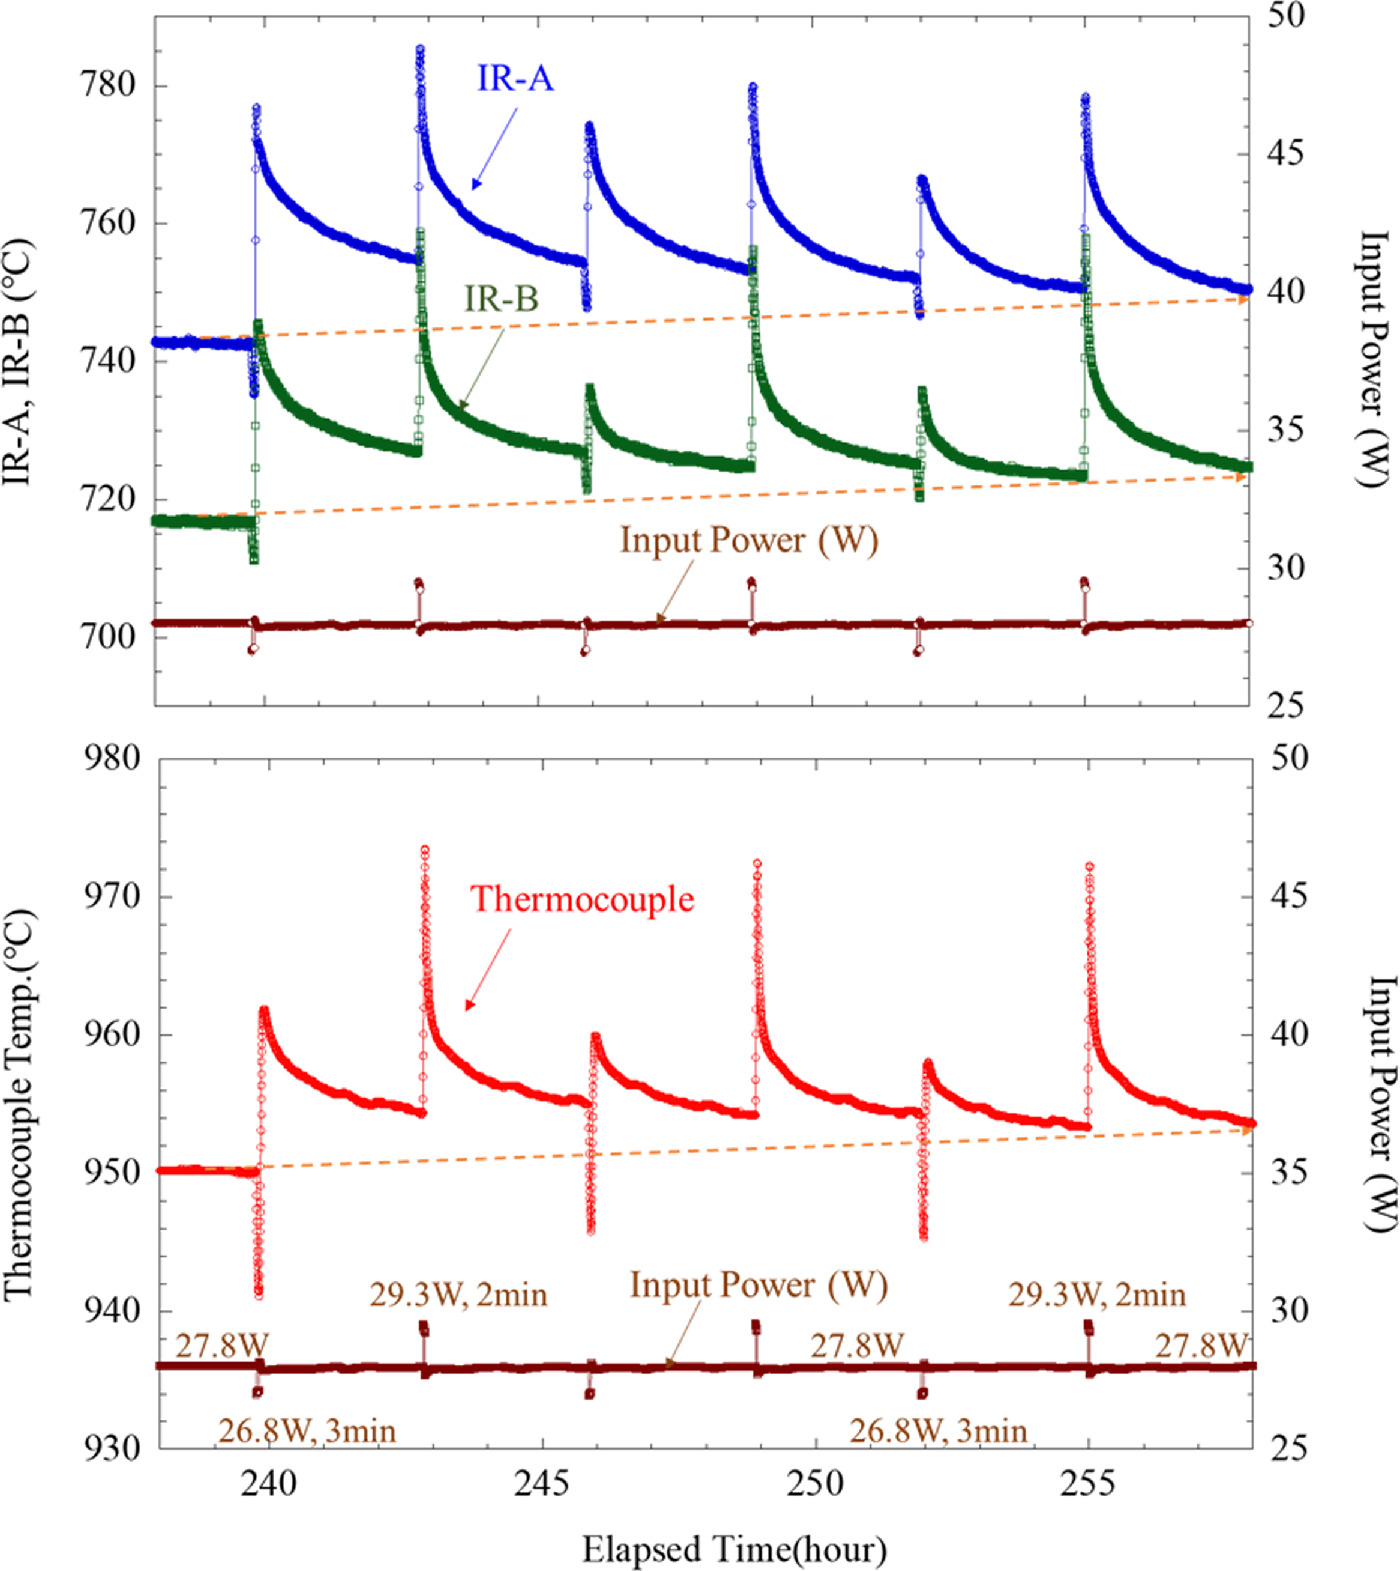
Fig. 14. Example of all surface and thermocouple temperatures increased by a combination of negative and positive input power perturbations.
Download figure:
Standard image High-resolution image3.1.3. Material and gas analysis
Various analytical methods have been applied to clarify the mechanism of the heat generation phenomenon in nano-structured multilayer metal composites. In this section, we describe the results of SEM-EDX and TOF-SIMS and discuss the obtained results.
Table I shows the mill sheet of the Ni bulk used for the experiments. The main impurities are Si, C, Mn, and Mg. The impurities vary a little bit with the batch of Ni bulk, but the main impurities in the Ni material are Si and Mn.
Table I. Mill sheet for Ni bulk.
| Element | Concentration (weight %) |
|---|---|
| Si | 0.26 |
| C | 0.10 |
| Mn | 0.01 |
| Mg | 0.03 |
We normally perform SEM and EDX analysis of the sample surface for each experiment. The results of these analyses have revealed some common characteristics of the samples in which excess heat is observed. One example is shown in Fig. 15. The secondary electron image is on the left and the composition image by backscattered electrons (COMPO image) is on the right. It shows the presence of Ni crystal grains and grain boundaries ranging from several 10 μm to 100 μm. The characteristic is the presence of spotted parts in both images, which appear to be composed of elements lighter than Ni. As will be mentioned later, these black spots are areas of very high oxygen concentration.
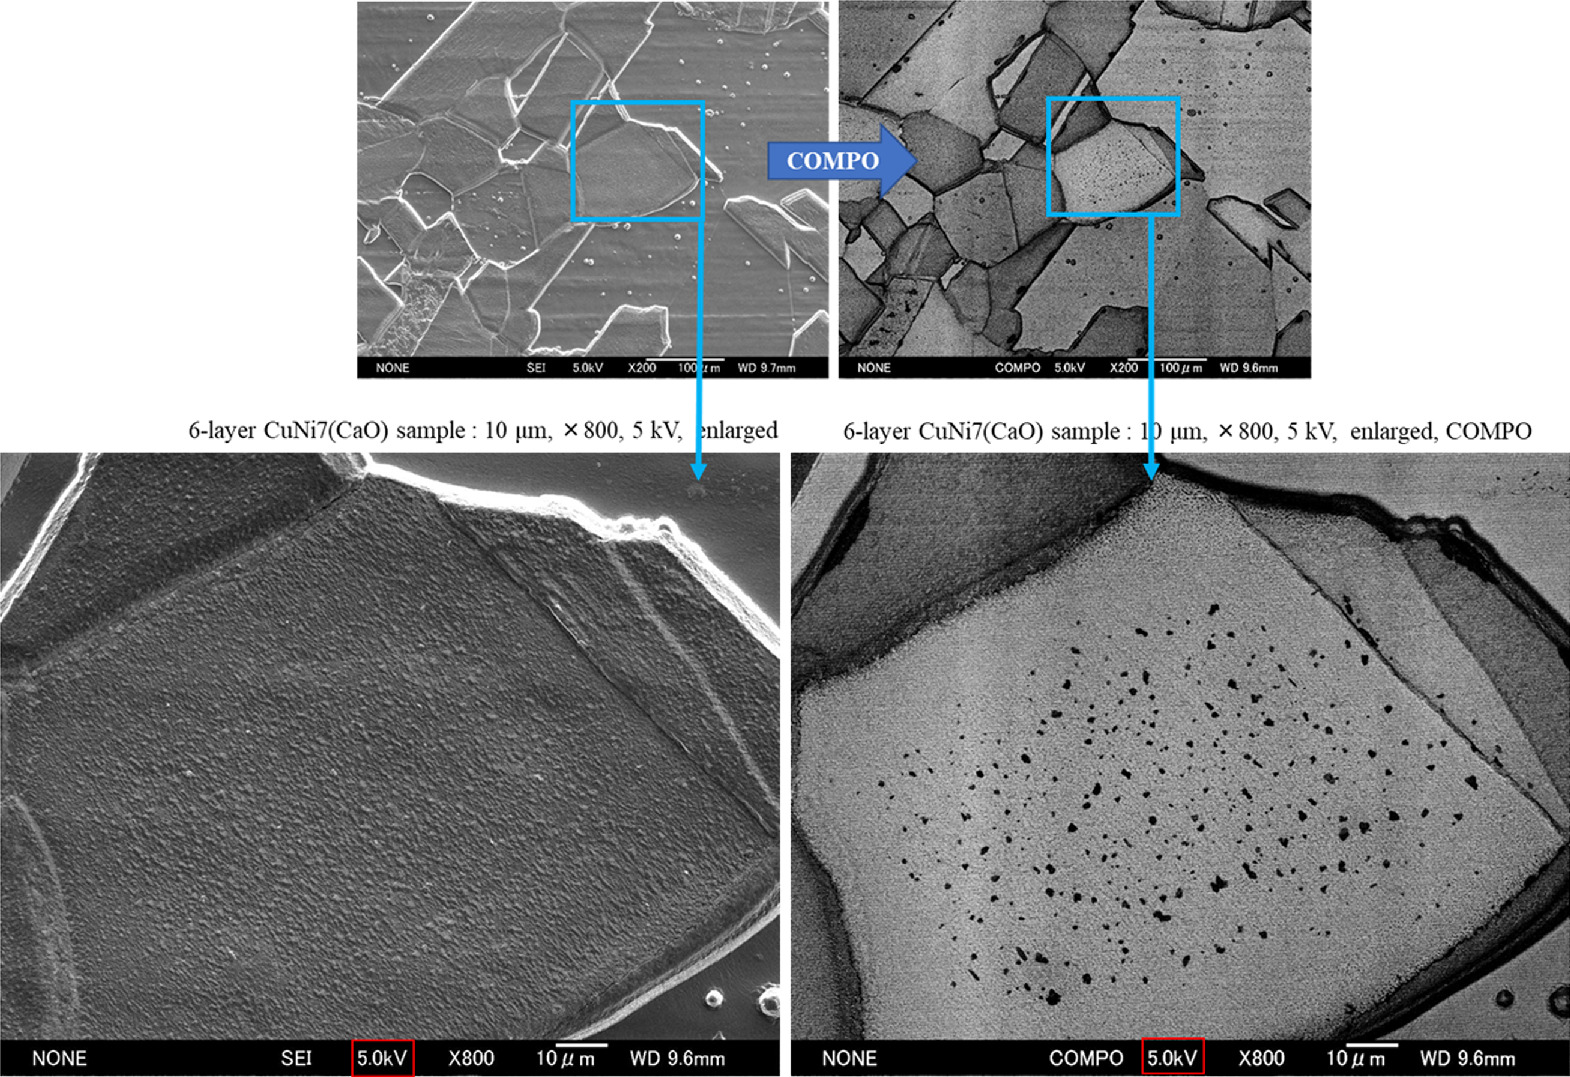
Fig. 15. Example of SEM analysis after heating experiment. The spotted regions within the grains can be observed, which seems to be common to samples that observed excess heat.
Download figure:
Standard image High-resolution imageFigure 16 shows SEM images of a sample on which no experiment was performed, as a control. No contaminants or irregularities were observed on the sample surface. The EDX spectrum at point 1 of the sample surface where no experiment was performed shows that Ni and Cu, which are the compositions of the sample base material and the metal multilayer film, are the main components, and that the content of C, O, and Al is low.
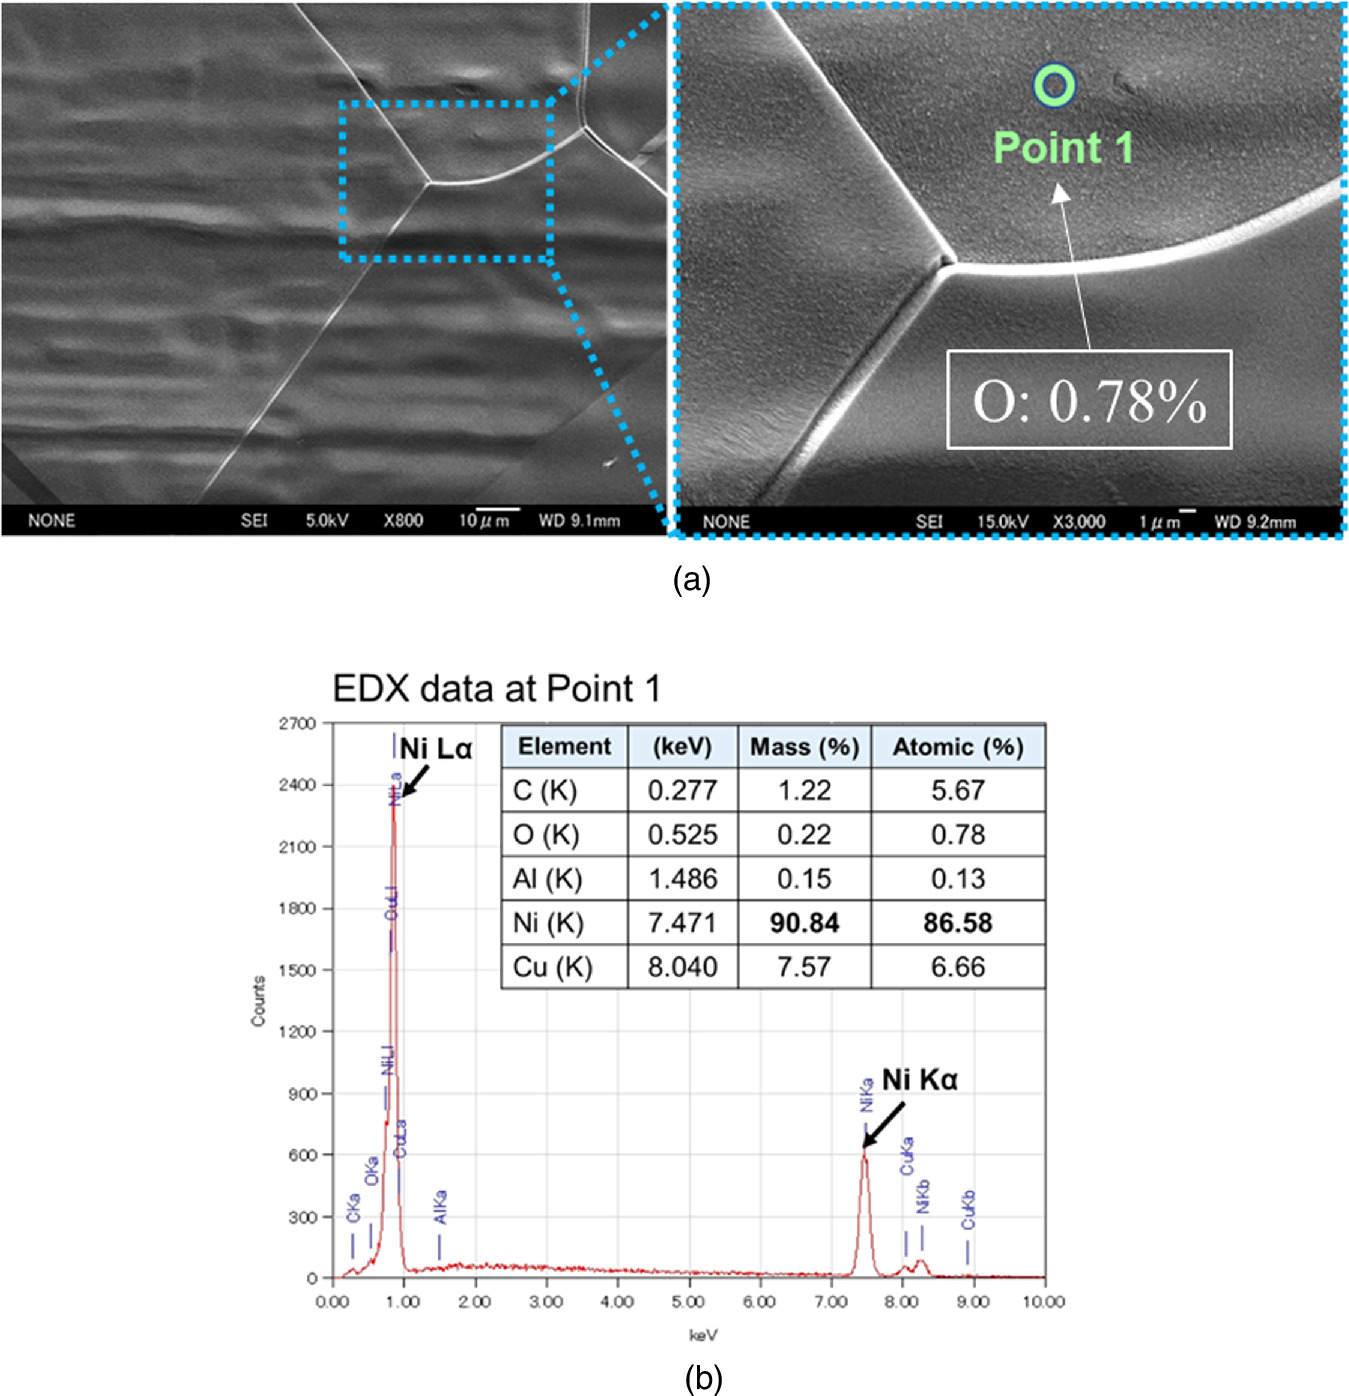
Fig. 16. SEM-EDX analysis for a control sample without experiment; (a) Morphologic observation of the sample and (b) EDX Spectrum and elements present at about a few μm on the surface.
Download figure:
Standard image High-resolution imageThe surface of a sample after an experiment generating up to 7 W of excess heat is shown in Fig. 17. This sample had six layers of Cu (3.8 nm) and Ni (20 nm) deposited by magnetron sputtering. Some elongated particles could be observed within the grain boundaries of the Ni substance [Image A in Fig. 17(a)]. A subsequent study was carried out by using SEM in backscattered mode (COMPO), which allowed us to study the heterogeneity in chemical composition. Photo C in Fig. 17(a) is the COMPO image of the same area corresponding to image B. Light elements like C and O appear darker in the COMPO image compared to heavier elements, such as Ni or Cu. There can be seen particles (darker) in the matrix of Ni grain boundaries (brighter) in the image. This means that the particles consist of elements lighter than Ni. Images D and E are magnified images of images B and C, respectively, in secondary electron mode (SE, for B and D) and backscattered mode (COMPO, for C and E). The particles are approximately 5 μm in size. Point 2 in image D in Fig. 17(a) was chosen as a representative of the normal area of the sample. The EDX spectra obtained from point 2 showed that it essentially contains Ni with low contents of O. Point 3 on image D was chosen in the darker region (particle) in the COMPO image. The EDX spectra obtained from point 3 showed that this region is composed of O (at 33.74%) and Ni (at 60.99%), with low C, Si, and Mn content.
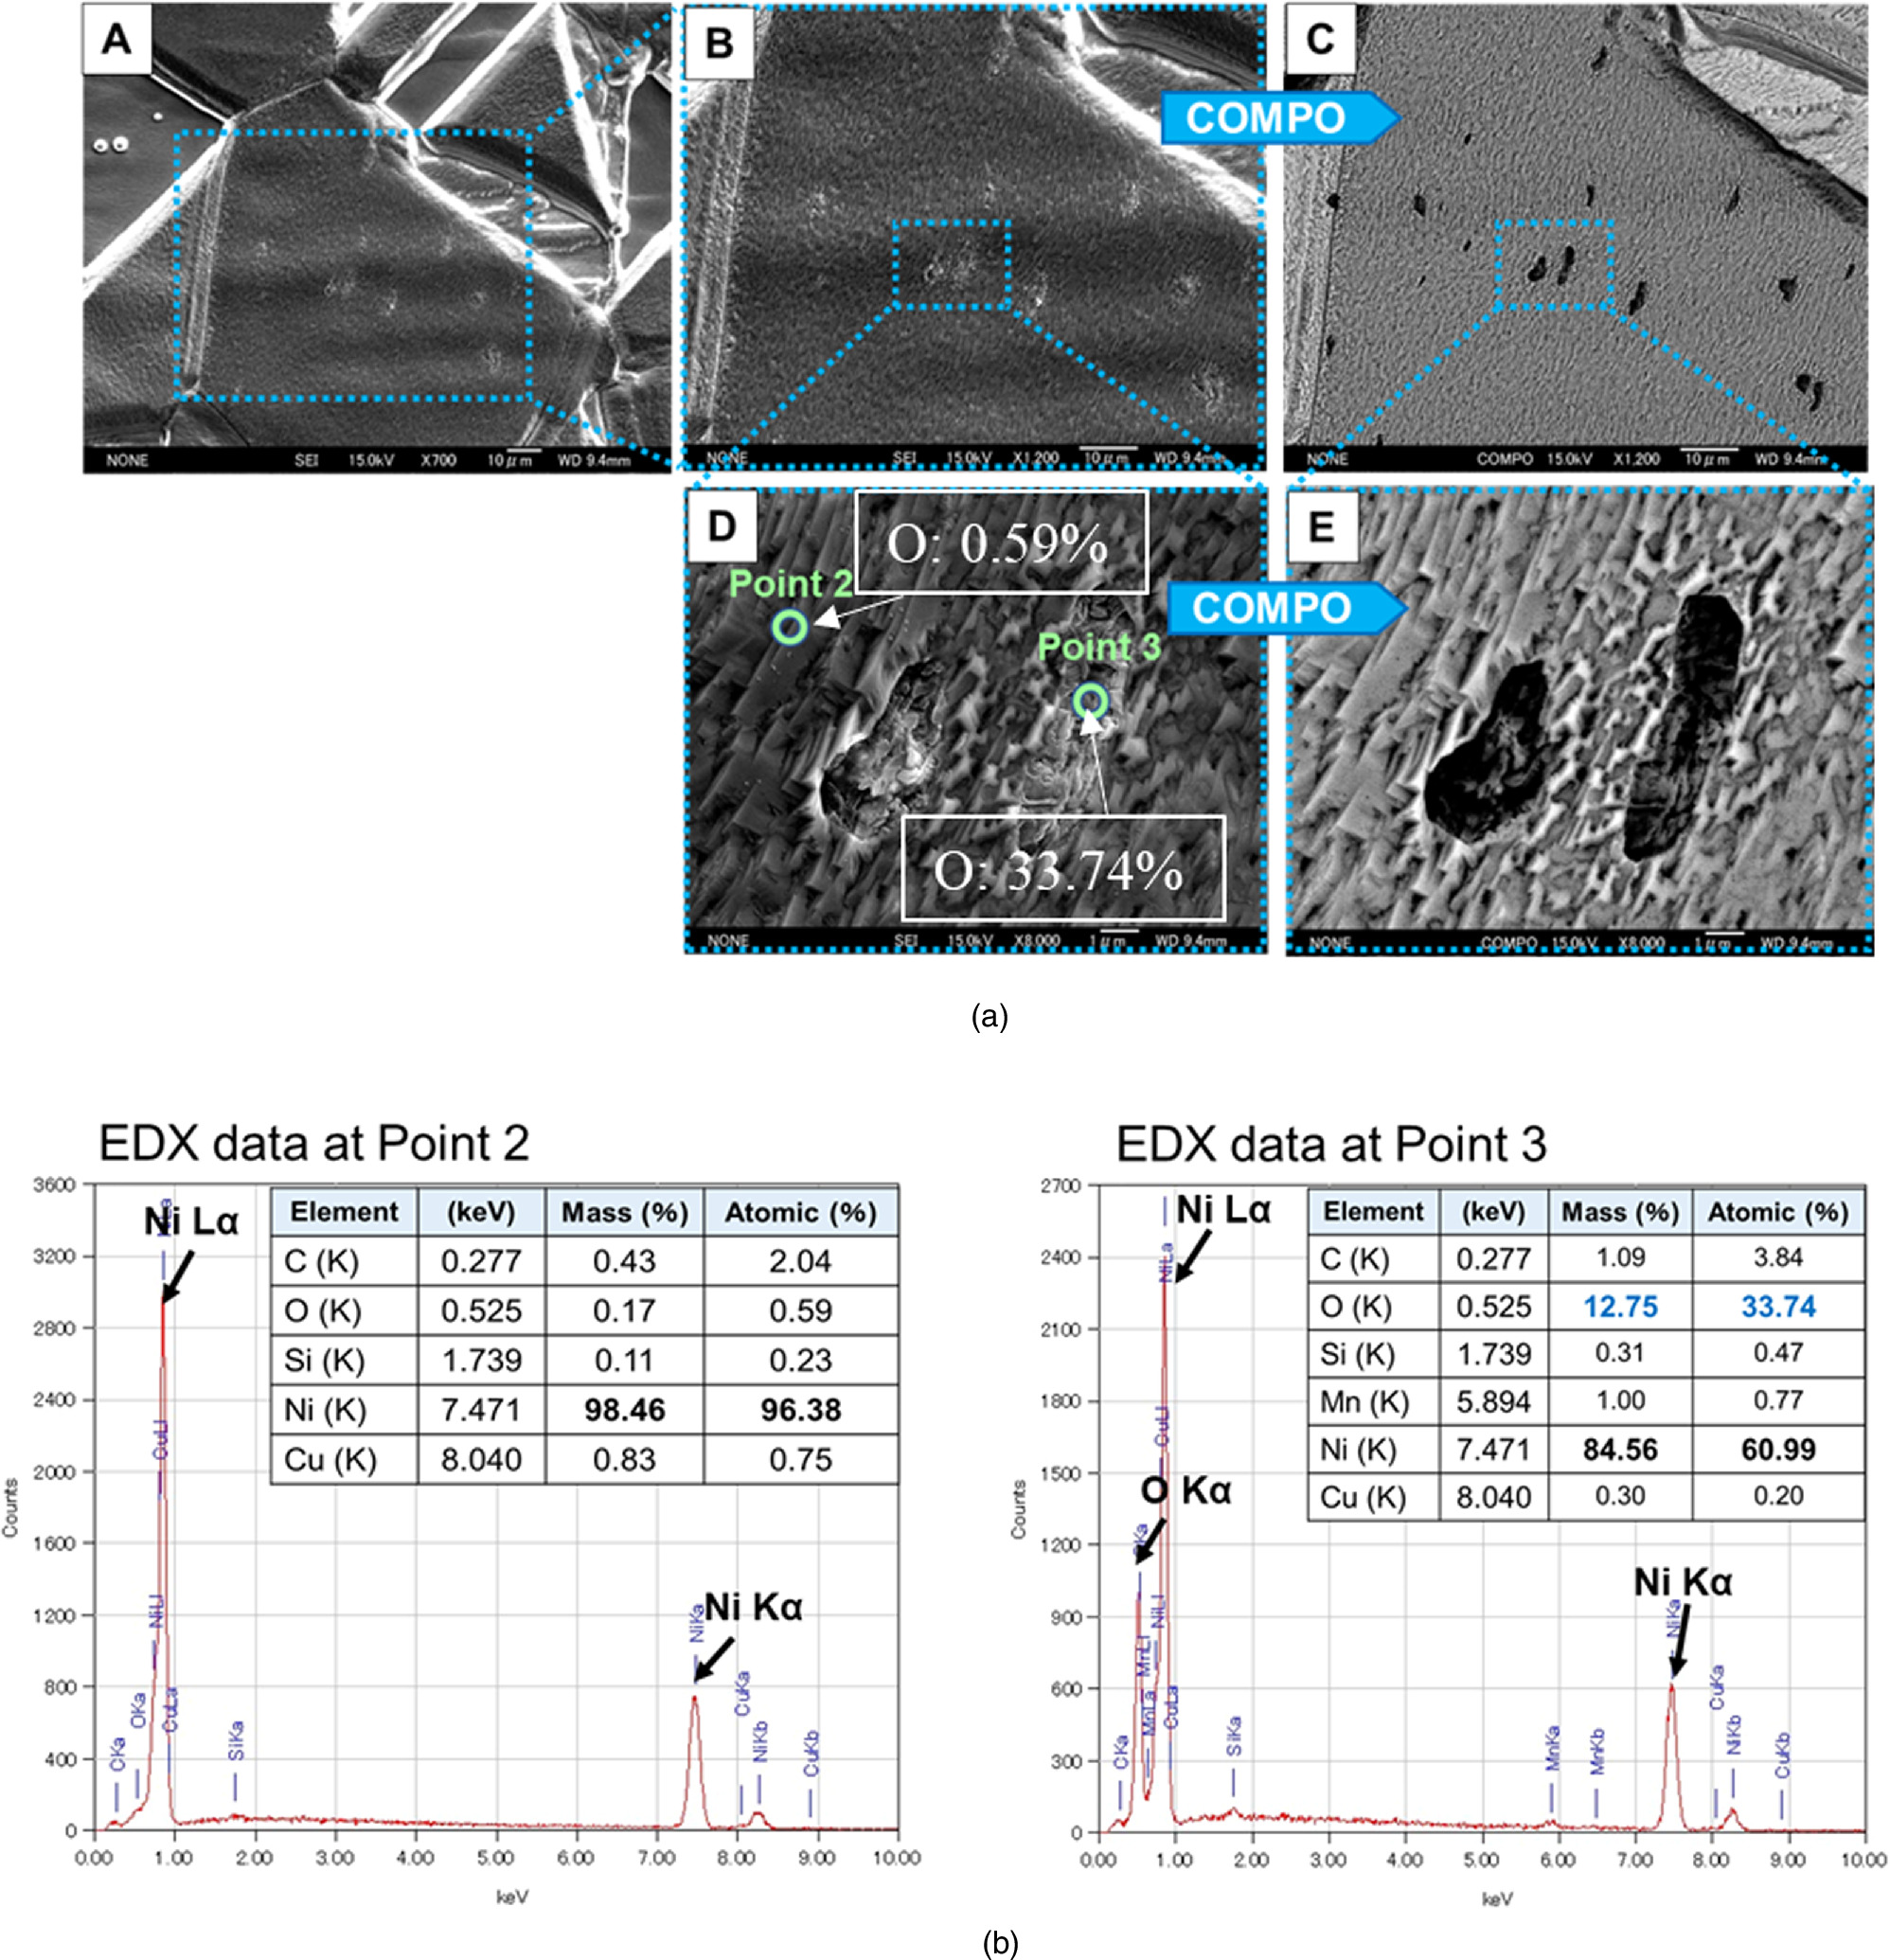
Fig. 17. SEM-EDX analysis for a sample after experiment generating up to 7 W of excess heat; (a) Morphologic observation of the sample and (b) EDX spectrum and elements present at about a few μm on the surface.
Download figure:
Standard image High-resolution imageAfter the experiment, the sample is covered with NiO or Ni(OH)2 because of exposure to the atmosphere. However, its thickness is so thin that it is usually below the detection limit of the EDX spectrum, which is less than 1% in atomic number; since EDX detects elements present at a few micrometers on the surface, oxygen on the very thin surface is hardly detected. In addition, the Cu sputtered before the experiment was very thin, and Cu diffused into the interior during the experiment, resulting in low values in the EDX spectra.
Figure 18 shows the SEM-EDX analysis of a sample after an experiment generating up to 9 W of excess heat. This sample had six layers of Cu (3.8 nm) and Ni (20 nm) deposited by magnetron sputtering after surface etching with an Ar ion beam instead of the usual HNO3 surface etching. Numerous particles and clumps can be seen in image B in Fig. 17(a). COMPO image C in Fig. 18(a) indicates the presence of lighter elements. Images D and E are magnified images of image B. The EDX spectra of points 4 and 5 are shown in Fig. 18(b). As can be seen, points 4 and 5 do not contain many elements other than Ni and O, and the concentrations of O are very high at 21.8% and 38.1%. As already mentioned, the elemental concentrations calculated from the EDX spectra are averaged over a few μm of the surface; the high concentrations of 21.8% and 38.1% for O are values that cannot be explained by surface oxidation, as in Fig. 17. On the other hand, the analysis results for point 6, where no surface particles and clumps exist, are shown in Fig. 18(b). Here, the O concentration is 0.77%, almost the same as the pre-experiment analysis results (Fig. 16).
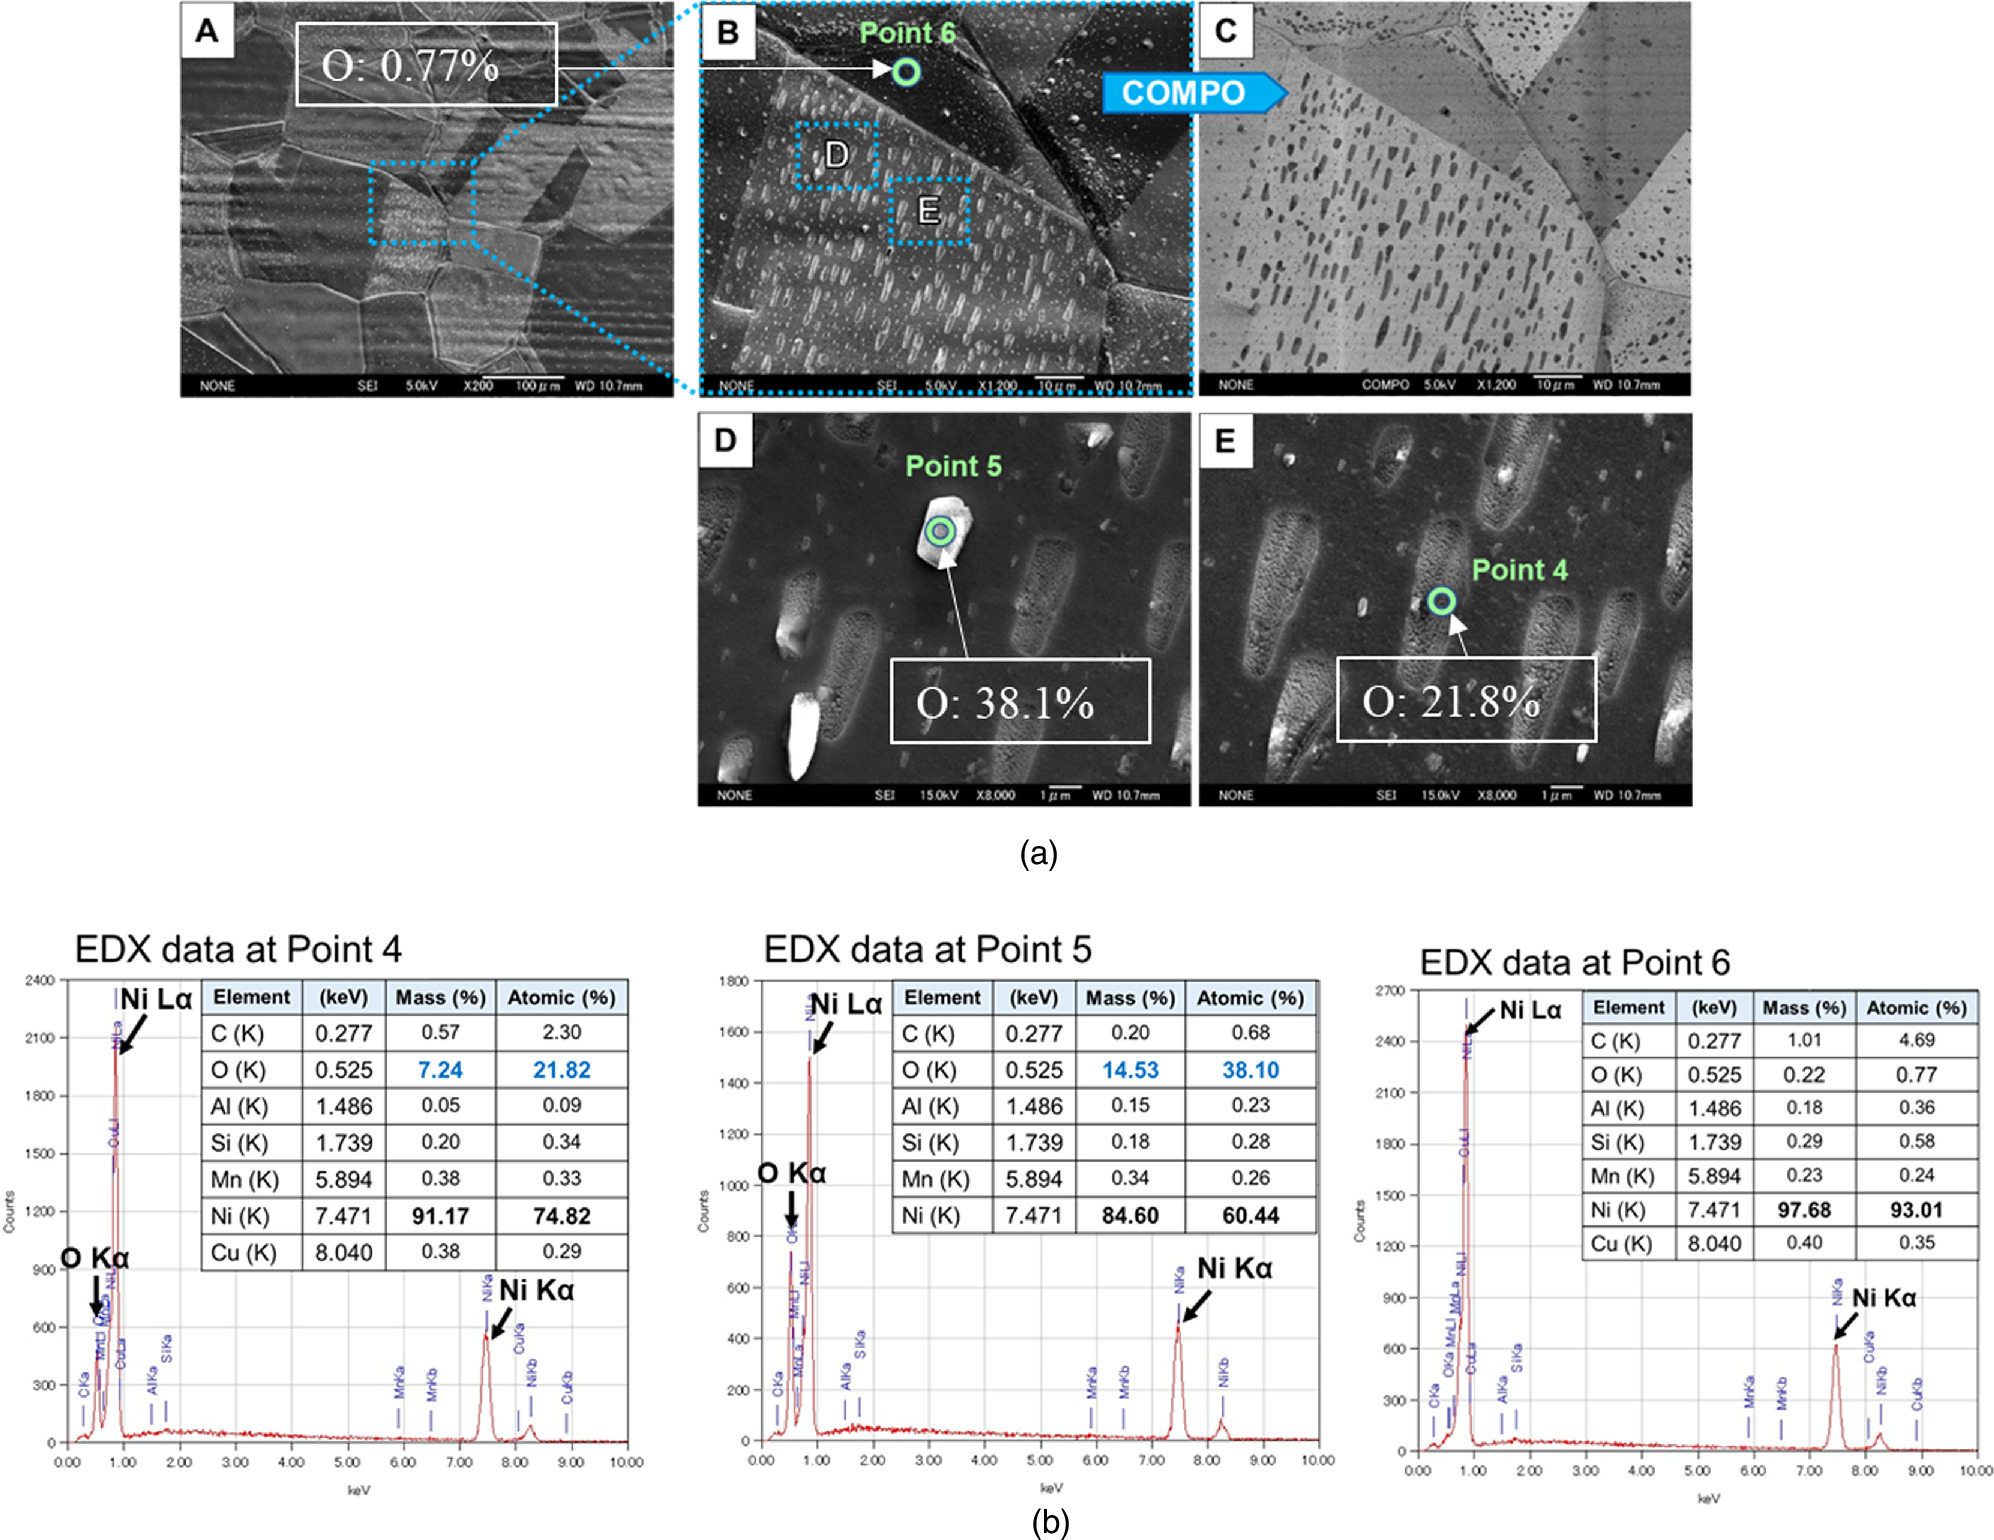
Fig. 18. SEM-EDX analysis of a sample after an experiment generating up to 9 W of excess heat; (a) Morphologic observation of the sample and (b) EDX spectrum and elements present at about a few μm on the surface.
Download figure:
Standard image High-resolution imageA comparison of depth analysis by TOF-SIMS between samples before and after the experiment is demonstrated in Fig. 19. Depth profiles were obtained using negative ion (Cs-) and ion energy was 2 kV and ion current was 40 nA. In this TOF-SIMS analysis, the vertical axis represents the dimensionless number of counts for each ion divided by the total number of counts. The depth profile of the sample before the experiment is plotted in Fig. 19(a). Nanoscale layers of Cu and Ni are sputtered alternately on the Ni bulk. O is higher at the top surface and at the interface between the Ni bulk and the thin film. Other impurities such as C and Si were also observed.
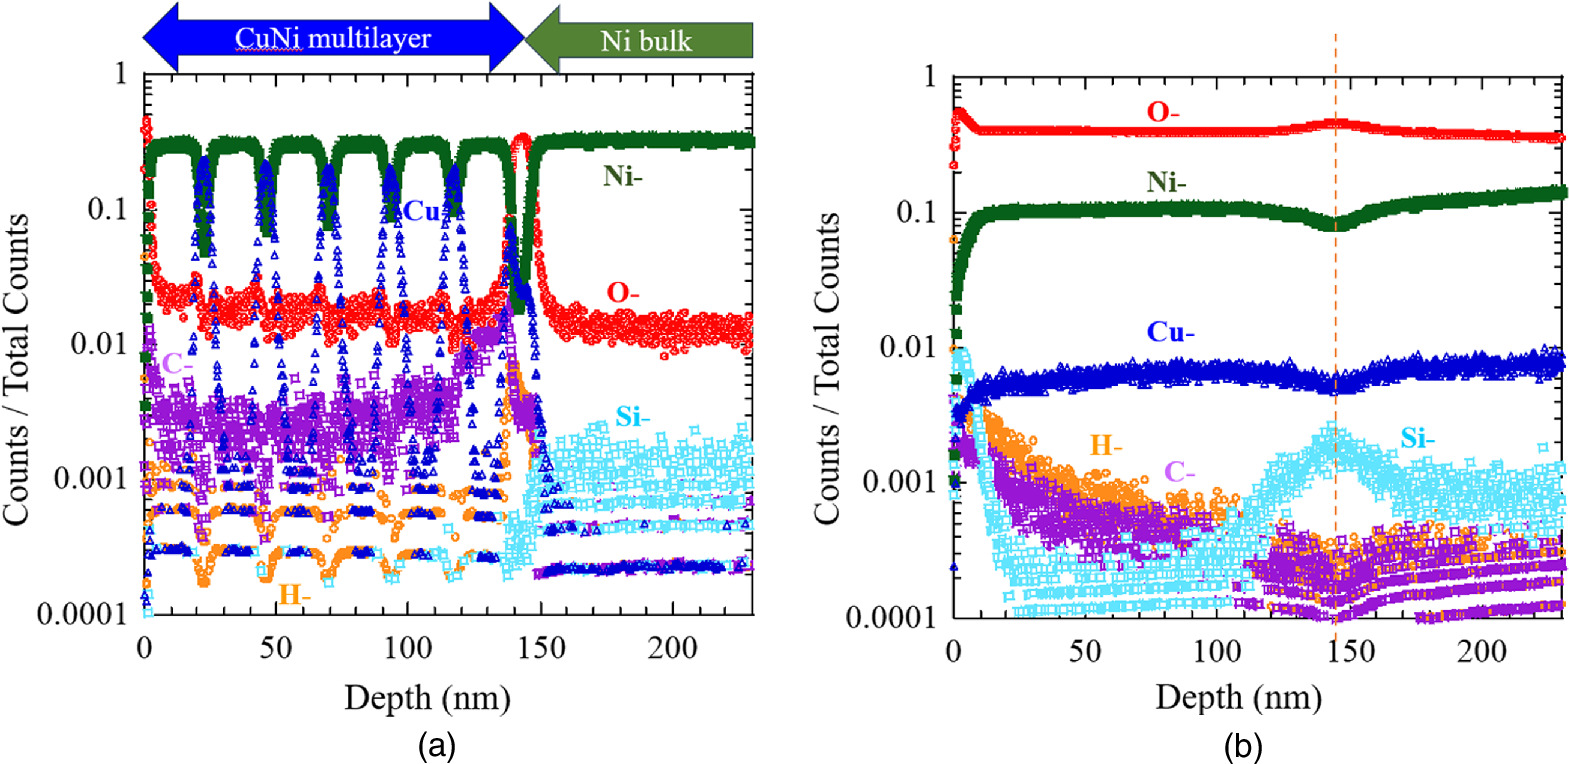
Fig. 19. Comparison of depth analysis by TOF-SIMS between samples before and after the experiment; (a) Depth profile of the sample before the experiment and (b) depth profile of the sample shown in Fig. 18 after the experiment in which excess heat of up to 9 W was generated.
Download figure:
Standard image High-resolution imageThe depth profile of the sample after the experiment in which excess heat of up to 9 W was generated is shown in Fig. 19(b). Since TOF-SIMS has a larger beam diameter than EDX, we selected a region in this sample with relatively many particles and clumps, where very high oxygen concentrations were detected by EDX, for analysis. As can be seen in this graph, the most abundant ion is O–, with a value of nearly 50%. Note that the orange vertical dashed line in the figure for each ion indicates the area near the interface between the surface multilayer and the Ni bulk. Although the TOF-SIMS signal is difficult to discuss quantitatively because the values vary depending on the ionizability of each element, there is no doubt that the oxygen concentration is high not only on the surface of the sample but also in the interior of the sample.
Experiments were conducted to see if the regions of very high oxygen concentration, frequently observed in heat-generating samples, with many particles and clumps, would be observed if the sample had a very high oxygen concentration prior to the experiment. Table II tabulates EDX analysis results for a sample that was subjected to forced oxidation with the expectation of high residual oxygen concentration and the same process as in a normal experiment. The Cu and Ni nano-structured multilayer metal composites sample was oxidized at 700 °C for 2 h in the air. This is because the surface temperature during an experiment is about 700 °C. Reduction and absorption at normal absorption temperature (300 °C) with hydrogen at 30 kPa for about 10 h in a similar manner to the normal experiment. The results of EDX analysis at representative points within and at the grain boundaries of the sample are shown in Table II. No spots with very high oxygen concentrations were observed in this sample. The surface was uniform, and no regions of very high oxygen concentration were found. The emissivity measured after forced oxidation at 700 °C under atmospheric pressure was more than 0.5, indicating that the surface was covered with a thick oxide film. Even forced oxidation samples have oxygen concentrations below 5% after the normal hydrogen absorption process.
Table II. EDX analysis results for a sample that was subjected to forced oxidation with the expectation of high residual oxygen concentration and the same process as in a normal experiment.
| Intra-grain | Grain boundary | ||||
|---|---|---|---|---|---|
| Element | Mass (%) | Atomic (%) | Element | Mass (%) | Atomic (%) |
| C | 0.97 | 4.50 | C | 0.90 | 4.18 |
| O | 0.39 | 1.35 | O | 0.51 | 1.78 |
| Si | 0.33 | 0.65 | Si | 0.38 | 0.77 |
| Ni | 94.03 | 89.71 | Ni | 93.70 | 89.30 |
| Cu | 4.29 | 3.78 | Cu | 4.51 | 3.97 |
Next, the results of the Q-mass analysis of the gas released from the sample during the heat generation experiment are described. During the heat generation experiment, the chamber is in a vacuum and the pressure is less than 10−4 Pa. Therefore, in the background condition where no gas is released from the sample, the gas analysis results by Q-mass are close to the leakage components from the atmosphere. Table III shows the so-called cracking patterns. 36) It shows the mass number and the corresponding signal intensity for Q-mass for the atmospheric leakage component. According to this data, the value of Mass32 (O2)/Mass28 (N2+CO) should be about 0.23. In our experiment, Mass32/Mass28 was almost consistent with the literature value of 0.23 during the baking process.
Table III. Cracking pattern of leaked air (residual gas). 36)
| Mass number | 14 | 28 | 32 | 40 |
| Relative intensity | 4.0 | 100 | 22.9 | 2.0 |
Figure 20 shows the correlation between excess heat generation intensity and Mass32/Mass28 of gas released from the sample. Figure 20(a) shows typical cases of large and small excess heat. Six layers of Cu (3.8 nm) and Ni (20 nm) samples were used in the large excess heat case and six layers of Cu (3.5 nm) and Ni (20 nm) samples were used in the small excess heat case. Hydrogen loading was performed at a hydrogen pressure of 250 Pa in the first half and at a hydrogen pressure of 30 kPa in the second half. As can be seen from this figure, a significant difference in excess heat values can be seen between the two cases. Furthermore, a weak positive correlation between hydrogen loading pressure and excess heat might be possible.

Fig. 20. Correlation between excess heat generation intensity and Mass32/Mass28 of gas released from the sample; (a) The time variation of the excess heat for samples with two different compositions, and (b) the gases generated from these two samples.
Download figure:
Standard image High-resolution imageThe results of the gas analysis for these two experimental cases are shown in Fig. 20(b): the horizontal axis of the two bar graphs shows the experimental process with varying power input during the experiment, corresponding to the graph of excess heat in Fig. 20(a). The vertical axis is the value of Mass32/Mass28 calculated from the Q-mass measurement. In the case of small excess heat, Mass32/Mass28 is larger than 0.23 in a few cases, but in the case of large excess heat, it is larger than 0.23 at many measurement points. In some measurement points, the value is about three times larger than 0.23. Thus, the value of Mass32 (O2)/Mass28 (N2+CO) is significantly above the background value. It suggests that oxygen gas may have been released during the heat generation experiment.
The results of the above SEM-EDX, TOF-SIMS, and Q-mass analyses for oxygen are summarized in Table IV. As already mentioned, the oxygen concentration by EDX in the samples before the experiment was less than 1%, and even in the heat-producing samples after the experiment, the oxygen concentration was usually less than 1% in many surface areas of the samples. This is likely due to oxidation by the atmosphere after sample removal. However, there are regions of high oxygen concentration (RHOC) in certain parts of the heat-producing samples. The oxygen concentration in these areas was more than 10% by EDX, and in some cases was nearly 40%. In addition, TOF-SIMS analysis of the area containing many RHOC showed the oxygen concentration reached nearly 50% up to a depth of 250 nm region. In order to confirm that the RHOC region may have been caused by the sample being oxidized by residual oxygen gas during the experiment, the sample was heated at 700 °C in air and allowed to absorb hydrogen as in a normal experiment. As a result, no areas similar to the RHOC regions were observed, and all were below 5% with nearly uniform oxygen concentrations. Furthermore, the Q-mass analysis of the Mass32(O2)/Mass28(N2+CO) values was much larger than the normal values for the ratio of atmospheric leakage components in the samples with large excess heat.
Table IV. Summary of oxygen concentrations.
| SEM-EDX &TOF-SIMS analyses | ||
|---|---|---|
| Results | O (atomic%) | Q-mass analysis |
| Many surface areas in the heat-producing samples | <1% | Mass32(O2)/ Mass28(N2+CO) for the sample with large excess heat was much larger than background |
| Region of High Oxygen Concentration (RHOC) in the heat-generated samples | >10% | |
| Highest oxygen concentrations in the forced oxidation sample | <5% | |
3.2. Discussion
3.2.1. Anomalous heat generation
Released excess energy per hydrogen was evaluated based on the experimental result shown in Table V. The amount of excess energy was calculated as 0.76 MJ by time integration of excess power. Since it is unlikely that all of the absorbed hydrogen atoms reacted, it can be estimated that the average energy released per absorbed total hydrogen was more than 12 keV H–1. In the previously reported example, a total of 1.1 MJ of energy was released, or 16 keV H–1 per hydrogen, 8,31) The values obtained in previous experiments with nanoparticles were roughly 0.1 to 1 keV per hydrogen or deuterium. 23–25) The values obtained with the present experimental method are comparable or higher, and in any case, it is clear that this is not a phenomenon that can be explained by known chemical reactions. If we assume that about 1/100 of the absorbed hydrogen would react, the value of 1.2 MeV H–1 in this experiment would be at the level of nuclear reactions.
Table V. Excess energy density calculated by the data in Fig. 7.
| Absorbed H [mol) | 6.7E-04 |
| Absorbed number of H | 4.0E+20 |
| Total excess energy [J) | 7.6E+05 |
| Excess energy density [J/H-mol) | 1.1E+09 |
| Excess energy density [eV/H) | 1.2E+04 |
Figure 21 shows a diagram and table showing the excess heat generation examples shown in Fig. 8 as the generated energy density per absorbed hydrogen. It can be seen from the table that the amount of hydrogen absorbed is not so different in each case, but the energy generated per hydrogen differs by about one order of magnitude. It should be added that when the surface of the multilayer sample was covered with impurities such as oil, this level of hydrogen absorption was not observed: and excess energy was not detected in many cases.
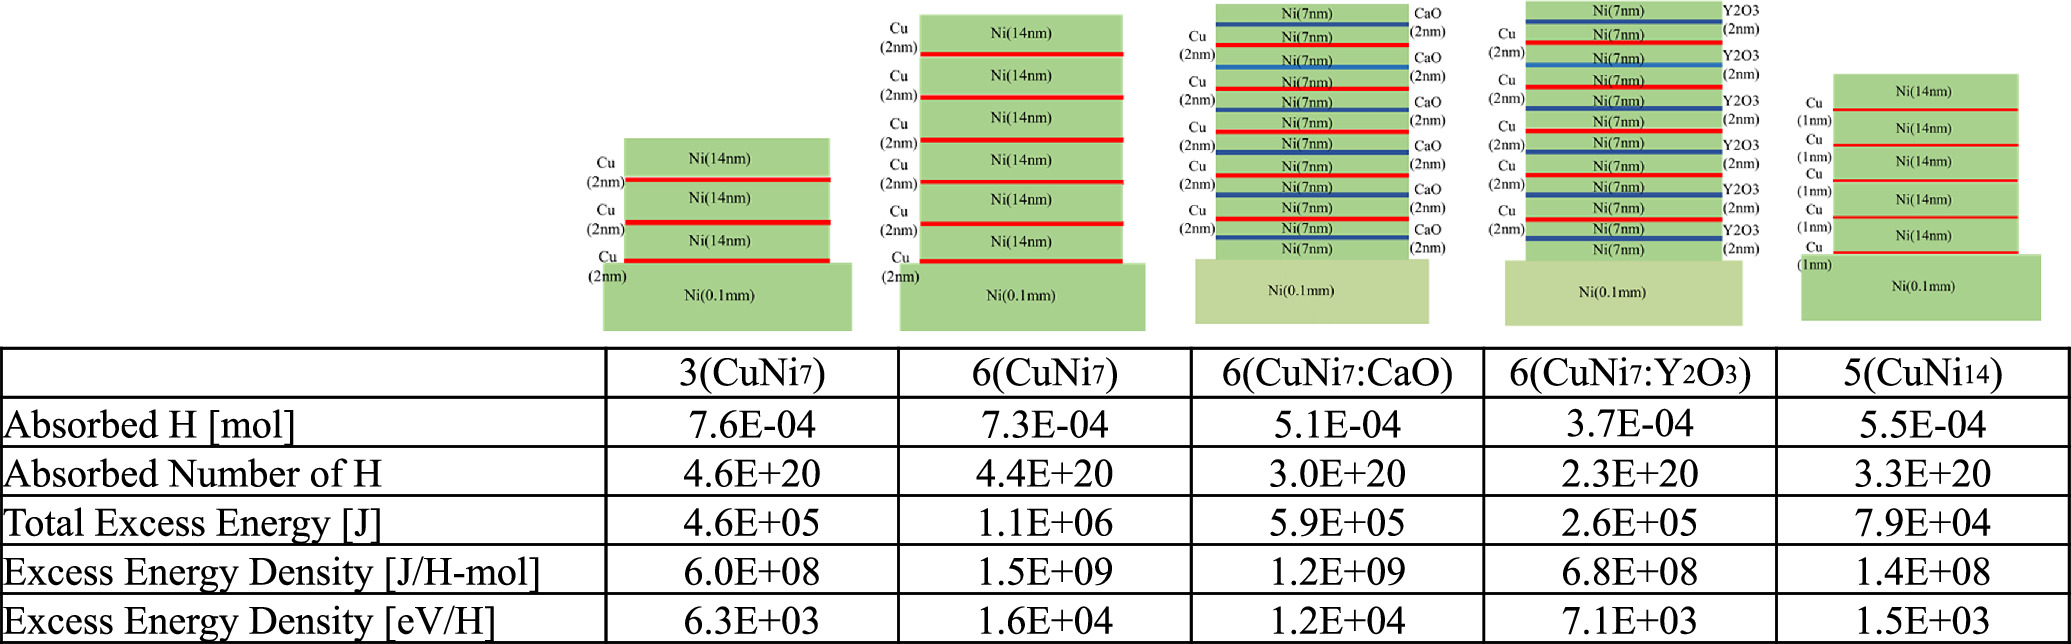
Fig. 21. Excess energy density per absorbed hydrogen depending on the ratio of Cu to Ni, the number of layers, and the material inserted into Ni.
Download figure:
Standard image High-resolution imageFigure 22 shows a comparison of the energy generated per gram of fuel obtained in previous experiments with chemical reactions (methane and hydrogen burning) and nuclear reactions (fission and fusion). As can be seen, the experimental data obtained so far is at a level higher than that of chemical reactions and lower than that of nuclear reactions. However, as mentioned earlier, it is difficult to assume that all the absorbed hydrogen will react, so our present experimental result is supposed to be an underestimated value. If the energy at the level of 109 J g−1 shown by the dotted line were converted into electricity with a thermal efficiency of about 30%, 100 kWh of electricity would be obtained from 1 g of hydrogen fuel. In the case of Japan, the average electricity consumption is 400–500 kWh per month, and 4–5 g of hydrogen is enough to provide electricity for a month. Anyway, it is important that the generated energy of more than keV per hydrogen cannot be explained by known chemical reactions. Then, we call the present heat generation phenomena "anomalous heat generation."
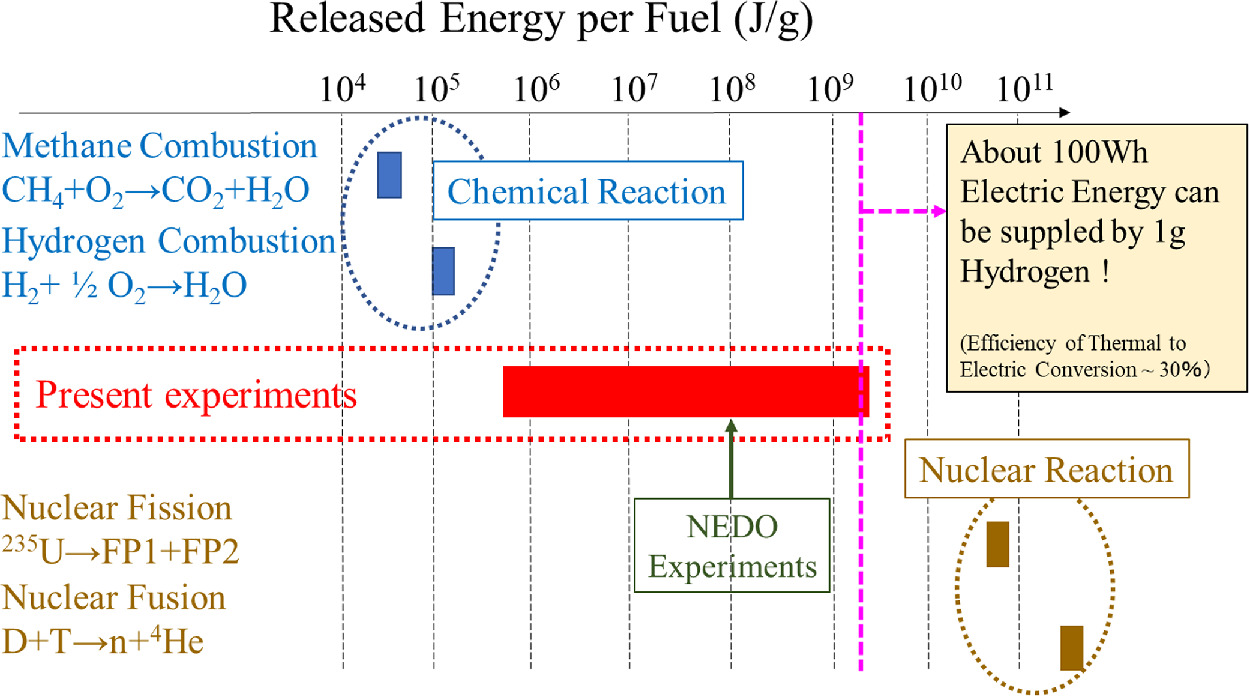
Fig. 22. Comparison of the energy obtained in the present experiments with chemical and nuclear reactions.
Download figure:
Standard image High-resolution image3.2.2. Heat burst
Let us examine the possibility that the observed intentional heat burst phenomenon demonstrated in Fig. 11 was caused by some chemical reactions. Figure 23 plots the change in Tc during the heat burst shown in Fig. 11(a). A heat burst phenomenon, induced by perturbation of input power, lasted for at least 1.2 × 10⁴ s. The first time in this hatched triangle corresponded to 6.0 W of excess heat, and the last time to finish the experiment was 5.6 W of excess heat. Therefore, the hatched triangle can be calculated as (6.0–5.6) × 1.2 × 104 = 4.8 (kJ). Energy generated by a single intentionally induced heat burst is more than 4.8 kJ in this example.

Fig. 23. The amount of energy generated by an intentionally induced heat burst cannot be explained by any known chemical reaction.
Download figure:
Standard image High-resolution imageConsider the following chemical reactions that may cause the heat burst for some reason.
- (i)If all the residual gas were oxygen and the absorbed hydrogen would be oxidized and generate heat.
- (ii)If the residual gas would be oxygen, and the Ni metal would be oxidized by it.
- (iii)If the residual gas consisted of mixed gas (H2:O2 = 2:1), and the combustion energy would give energy to the surface of the two samples.
During the heat release experimental cycle, all the hydrogen introduced for absorption was evacuated, and the degree of vacuum was less than 1 × 10⁻⁴ Pa when the heat burst phenomenon was observed. The volume of the chamber is about 9 L, then the number of moles of residual gas was less than 4 × 10⁻¹⁰ mol. It is known that the combustion reaction of hydrogen is about 290 kJ mol−1 and the heat of formation of nickel oxide is about 240 kJ mol−1. Based on the number of moles of residual gas in the chamber, the heat generated in each case can be calculated as less than (i) 6 × 10⁻⁵ J, (ii) 2 × 10⁻⁴ J and (iii) 8 × 10⁻⁵ J. Comparing these values to the energy increased by the heat burst, 4.8 kJ, shows that they are completely negligible. This clearly shows that at least the above chemical reactions (i)–(iii) cannot explain the heat burst phenomenon observed in this study. Therefore, the amount of energy generated by even a single intentionally induced heat burst cannot be explained by any known chemical reaction. Therefore, the observed heat generation in the present experiments is still an "anomalous heat."
The research significance of observing the heat bursts shown in Figs. 11(a) and 12 in terms of improving the reliability of excess heat measurements are as follows. Usually, in the case of heat measurement as shown in Fig. 6, the heat generation is evaluated using a calibration curve as described before, and there are some cases where people question whether the heat dissipation conditions are different between the time of calibration and the time of the heat generation experiment due to variations in the way the sample is mounted, etc. However, since the heat burst phenomenon is observed under the same heat dissipation conditions, it cannot be explained by the difference in experimental conditions between the calibration and heat generation experiments. In other words, the observation of the heat burst phenomenon enhances the reliability of excess heat experiments.
Furthermore, the ability to intentionally induce heat burst phenomena has allowed this technique to be successfully used as a reaction control method: a combination of negative and positive input power perturbations was successfully used to increase excess heat without giving extra energy as shown in Fig. 14. This intentional heat burst phenomenon roughly replicates that of a 6-layer Cu and Ni sample with Ni/Cu in the range of 5 to 7. From previous experiments, it has been found that this heat burst phenomenon depends on the composition and structure of the sample, the surface temperature of the sample, and the magnitude and time width of the perturbation of the input power. Since the control of anomalous heat generation phenomena is an important issue for the future, we would like to conduct experiments with different parameters of these parameters to establish this as a method of reaction control in the future.
Intentional heat bursts have another important significance. Based on the heat burst phenomenon, we developed the hypothetical reaction model shown in Fig. 5. Based on the results of many previous studies 37–41) on metal and defects, we speculate that heat bursts are caused by fluctuations in hydrogen diffusion due to perturbations in input power, resulting in the hydrogen concentration at the capture site exceeding a certain threshold value. We are currently observing this phenomenon under various parameters and using the results to utilize to elucidate the mechanism of the heat burst phenomenon.
The experimental results related to this heat burst phenomenon were observed by the Focardi team. 12) They used Ni rods and hydrogen. They observed excess heat by once bringing the temperature of the Ni rods down to near RT and then abruptly returning them to their original input power level. Although the geometry and composition of the Ni samples were different, they have in common that hydrogen diffusion caused the heat burst phenomenon.
3.2.3. Material and gas analysis
As described in the experimental results section, there are RHOC in certain parts of the heat-producing samples. The oxygen concentrations in these regions were greater than 10% by EDX and in some cases close to 40%. The elements C, Al, Si, and Mn detected by EDX or TOF-SIMS as shown in Figs. 16–19 were presumed to originate from the Ni bulk or surface contaminants as impurities. However, the O ratios at the RHOC seem to be quite higher than what could result from impurities from Ni bulk or surface contaminants. Besides, the gas analysis results also suggest that oxygen gas is released from the sample, supporting the EDX and TOF-SIMS results.
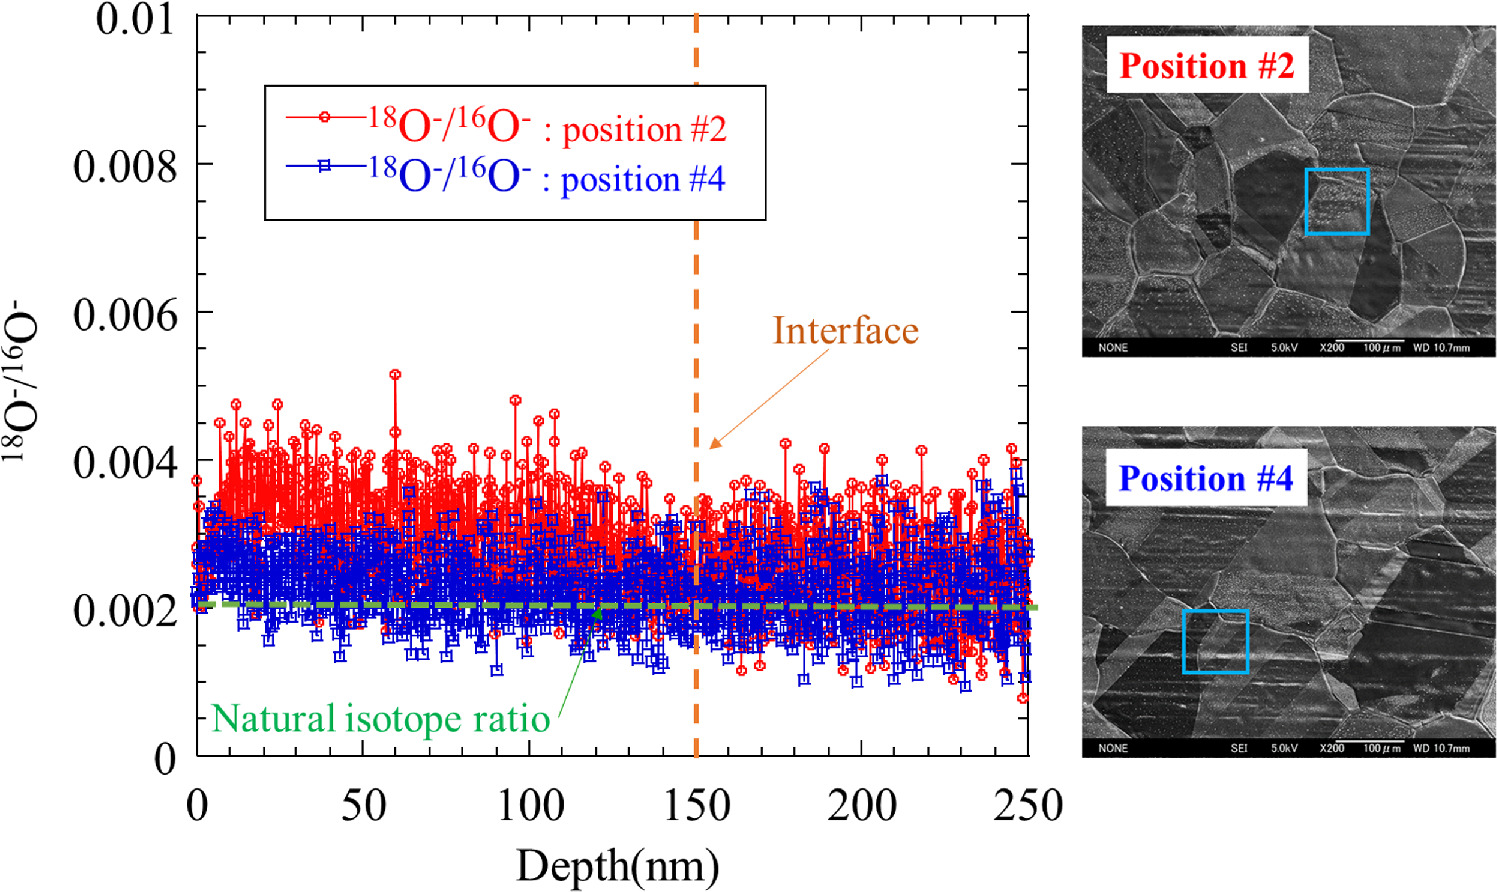
The fact that RHOC was observed in the sample with heat generation that cannot be explained by any known chemical reaction leads us to postulate a scenario in which some type of nuclear reaction plays some role in explaining this anomalous heat generation. Figure 24 shows the preliminary results for the ratio of 18O to 16O for the samples described in Figs. 18 and 19. Position #2 has a much larger value than the natural isotope ratio in the multilayer region on the surface. The ratio of 18O to 16O differs between position #2 and position #4 of the same sample. This result suggests that some nuclear processes may have caused the isotopic ratios to deviate from their natural values. However, depth distribution data of this isotope ratio has not been measured in many cases, so it is necessary to increase the number of measurements and examine the data from various viewpoints to obtain more reliable data in the future.
Fig. 24. Preliminary results for the ratio of 18O to 16O for the samples described in Figs. 18 and 19. Position #2 has a much larger value than the natural abundance in the multilayer region on the surface. The ratio of 18O to 16O differs between position #2 and position #4 of the same sample.
Download figure:
Standard image High-resolution image
Now, let us discuss what is the origin of the anomalous oxygen. The following four cases can be considered as possible causes of this anomalous oxygen.
- 1)Oxygen concentrations were low during the experiment, but anomalous oxidation was induced only at certain sites in the air after sample removal.
- 2)Oxygen concentrations were low during the experiment, but anomalous hydrate formation occurred only at certain sites in the air after sample removal.
- 3)Oxygen that originally existed in the Ni bulk diffused only in certain areas, forming RHOC during the experiment.
- 4)Oxygen was produced by some nuclear effect (e.g., transmutation).
Of these four cases, if (1) to (3) are the cause, they cannot be the cause of a major heat generation that cannot be explained by a chemical reaction. However, oxygen is abundant in the atmosphere, and it is difficult at this stage to deny the possibility that (1) to (3) are caused by previously unforeseen causes. In the end, it is necessary to accumulate experimental data that can negate (1) to (3) while accumulating data that suggest nuclear processes, as shown in Fig. 24, and to get closer to the mechanism of the reaction.
As mentioned in the Introduction, there have been many cases in the field of condensed matter nuclear reactions where studies have been conducted on the possible correlation between heat generation and helium-4. 17,18) In our study, we have obtained data showing a correlation between heat generation and oxygen, but so far we have not obtained any data showing a correlation with helium-4. No significant increase in mass number 4 was observed in our mass spectrometry system. There have been no reports of an increase in helium-4 observed with a method similar to ours, and similarly, this is the first report of a significant increase in oxygen. Furthermore, since it is difficult to show that oxygen is the origin of the nuclear reaction at this stage, it is necessary to clarify the nature of this anomalous heat generation phenomenon. by conducting more experiments by different research groups from ours and under different conditions in the future.
4. Conclusions
We developed an experimental method that enables us to observe anomalously large heat generation phenomena that cannot be explained by any known chemical processes using Ni-based nano-structured multilayer metal composites with hydrogen. The Ni-based nano-structured multilayer metal composites were preloaded with hydrogen gas and heated rapidly to diffuse hydrogen and trigger the heat generation reaction. The maximum energy released per total hydrogen absorption was over 10 keV H–1.
It was found that the heat burst phenomenon can be intentionally induced by perturbing the input power. This phenomenon contributes to improving the accuracy of heat generation evaluation and has potential applications in reaction control.
The heat-producing samples showed the RHOC, which was confirmed by both EDX results and TOF-SIMS. Q-mass analysis also showed that oxygen was released from the heat-producing sample, supporting the EDX and TOF-SIMS results. One item for the next step is to quantify the correlation between anomalous heat generation and high oxygen content, and at the same time measure the isotopic ratio of RHOC. Further experiments and research would clarify the nature of this anomalous heat generation phenomenon.
Acknowledgments
The authors would like to thank Prof. J. Kasagi and Dr. T. Hioki for their valuable discussions. The authors would like to thank President H. Yoshino and all the members of CLEAN PLANET Inc. for their financial and significant contribution. The authors also thank Mr. Y. Shibasaki and Prof. H. Kikunaga for their support. This work is supported by CLEAN PLANET Inc., The Thermal & Electric Energy Technology Foundation, The Iwatani Naoji Foundation, Ichimura Foundation for New Technology, and the Research Center for Electron Photon Science of Tohoku University.