
Abstract
Using isothermal micro-calorimetry, we investigate the heat generation of lithium- and manganese-rich layered oxides (LMR-NCMs) during the first cycle in which LMR-NCM exhibits a pronounced voltage hysteresis leading to a low energy efficiency (≈73%). In the first charge, LMR-NCM shows a unique voltage plateau at ≈4.5 V where irreversible structural rearrangements lead to an activation of the material as well as a large voltage hysteresis. We found that only a fraction of the lost electrical work (≈43%) is converted into waste heat. Thereby, the heat flow profile of the first charge is unique and shows considerable heat generation during the voltage plateau. With complementary electrochemical methods, contributions of conventional sources of heat, i.e., because of polarization and entropy, are determined. However, they do not cause the considerable generation of heat during the voltage plateau. Our results therefore suggest that the structural rearrangements during activation lead to a significant generation of heat. In window-opening experiments, we demonstrate that the activation is a gradual process and that the heat generated during the first discharge is directly linked to the extent of activation during the preceding charge. We also investigate the effect of the degree of overlithiation on the heat generated during activation.
Export citation and abstract BibTeX RIS

This is an open access article distributed under the terms of the Creative Commons Attribution 4.0 License (CC BY, http://creativecommons.org/licenses/by/4.0/), which permits unrestricted reuse of the work in any medium, provided the original work is properly cited.
Lithium- and manganese-rich layered oxides (LMR-NCMs) such as Li1.14(Ni0.26Co0.13Mn0.6)0.86O2 are promising candidates for next-generation Li-ion batteries. Compared with conventional layered NCMs, they provide higher reversible capacities of up to 250 mAh g−1. This is because a part of the transition metals (TMs) in the TM layer is replaced by lithium, thereby leading to an overlithiation of the structure. By using inexpensive manganese, a low material cost compared with other state-of-the-art cathode materials, which contain high amounts of nickel and cobalt, is achieved. 1
However, the practical application of LMR-NCMs is still limited by several challenges such as voltage fading, 2 oxygen evolution, 3,4 high resistances, 5 and a pronounced voltage hysteresis. 1,6,7 The hysteresis of the voltage is still present under open-circuit conditions and is thus an intrinsic bulk property of LMR-NCM. In addition to the open-circuit voltage (OCV), other parameters show a path-dependence as a function of state-of-charge (SOC), viz., the cathode resistance, 5 the lattice parameters, 8 and the entropy curve. 9 Interestingly, all of these hysteresis phenomena occur only for an activated LMR-NCM material, i.e., after charging it to 4.8 V vs Li+/Li. Thereby, the activation of the LMR-NCM is a gradual process and the first charge occurs via a two-step voltage profile. During the initial sloping potential region, lithium (Li) is removed from the Li-sites, and the charge is compensated by the oxidation of the transition metals (TMs). In this first region (below ≈125 mAh g−1 or at ≈4.4 V vs Li+/Li), the material cycles reversibly (i.e., the coulombic efficiency is close to 100%, the peaks in the dQ/dV profile are symmetrical, 1,10 and the lattice parameters, 8 resistance, 5 and entropy 9 of the charge and discharge direction coincide). Upon further charging, the voltage curve shows a plateau at ≈4.5 V vs Li+/Li, and the charge compensation includes oxygen redox, which enables the anomalously high first-charge capacity of more than 300 mAh g−1 and leads to irreversible structural rearrangements. During the upper voltage plateau, the long-range "honey-comb" ordering disappears 10,11 and chemically available Li sites are lost, thereby leading to a large irreversible capacity loss during the first cycle. Several structural and electronic changes are associated with the activation process and discussed in the literature. These include irreversible 3,12 and reversible 13,14 oxidation of oxygen, partly reversible TM migration, 1,7,10 the formation of Li/TM dumbbells, 1,15 and the formation of dislocations. 16 All of these processes happen during the upper voltage plateau and cause a substantial hysteresis between the first charge and discharge voltage curve. This loss of voltage combined with the large irreversible capacity leads to a very low electrical energy efficiency of ≈73% for the first cycle.
The aim of the present study is to investigate the heat generated during the first cycle and to answer the following questions: (i) How much of the electrical work, which is lost during the first cycle, is converted into waste heat? (ii) What can we learn about the activation processes from the heat generation profile as a function of SOC? (iii) What effect does the activation have on the generation of heat during the subsequent discharge? (iv) How does the degree of overlithiation influence the generation of heat during activation? The lost electrical work, measured by galvanostatic cycling, can usually be directly converted into the expected waste heat of a battery when a full, reversible charge/discharge cycle is considered. However, because LMR-NCM undergoes irreversible processes during the first activation cycle, the material at the end of the first cycle clearly differs from the pristine material. The irreversible capacity loss observed and the substantially lower voltage on discharge are direct consequences. Thus, the difference between the charge and discharge energy is only a measure of lost electrical work and does not provide information about the amount of waste heat or its generation during charge and discharge. The heat generation during the activation of LMR-NCM can be analyzed only by means of calorimetry. By applying operando isothermal micro-calorimetry (IMC), we aim to analyze the generation of heat as a function of state-of-charge (SOC), thereby gaining insight into the activation processes. With the investigation of parasitic reactions, the Dahn group demonstrated that IMC is a reliable technique for precisely analyzing the thermal behavior of batteries.
17–19
In our previous IMC study,
20
we discuss the heat generation of LMR-NCMs during regular cycling and introduce a new heat source into the general energy balance model: the heat resulting from OCV hysteresis,  This term is required to describe the thermal behavior of active materials with a pronounced OCV hysteresis such as LMR-NCM. Using IMC, Assat et al.
21
investigated the heat generation of Li2Ru0.75Sn0.25O3, which serves as a model system for LMR-NCM materials. They report a large heat release during the upper voltage plateau in the first charge. This is ascribed to a chemical stabilization process correlated to the irreversible structural rearrangements during activation.
This term is required to describe the thermal behavior of active materials with a pronounced OCV hysteresis such as LMR-NCM. Using IMC, Assat et al.
21
investigated the heat generation of Li2Ru0.75Sn0.25O3, which serves as a model system for LMR-NCM materials. They report a large heat release during the upper voltage plateau in the first charge. This is ascribed to a chemical stabilization process correlated to the irreversible structural rearrangements during activation.
In the following, we use IMC to measure the heat generated during activation of LMR-NCMs in LMR-NCM/Li half-cells at C/10 and 25 °C. We also determine the irreversible heat using a galvanostatic intermittent cycling protocol. The reversible heat is calculated based on potentiometric entropy measurements. 9 However, entropic heat is shown to be negligible for the present study. Thus, from the difference between the observed heat and the expected calculated heat value, the heat resulting from activation and hysteresis is determined as a function of SOC.
Experimental
Calculation approach
When a battery is charged or discharged, heat is generated. Under isothermal conditions, the total heat flow can be expressed according to Eq. 1. In general, three main contributions to the heat generation can be identified: (i) the irreversible heat flow,  (ii) the reversible heat flow,
  and (iii) the parasitic heat flow,
Irreversible heat originates from cell polarization, which causes the cell voltage under load,  to differ from that under open-circuit conditions,
  This term, which is the first one on the right hand side of Eq. 1, is always exothermic. It can be calculated from electrochemical cycling data with an intermittent protocol explained in the section "Determination of irreversible heat by intermittent cycling". The second term, the reversible heat, is caused by the changes in the entropy of the cathode and anode as a function of SOC. Depending on the sign of the applied current,
  , this contribution can be either exothermic or endothermic. For reversible processes,
  is equal to zero if a complete charge/discharge cycle is considered. The reversible heat was determined from entropy measurements described in the section "Determination of reversible heat" belowand is discussed in more detail elsewhere.
9
The third term on the right hand side of Eq. 1 comprises all heat flow from sources other than intercalation. This can include any side reactions such as electrolyte decomposition
17–19
or SEI formation.
22
A detailed discussion of the different sources of heat can be found in our previous IMC study,
20
in which we also elucidated the necessity to add another term to the general heat equation for materials that show a significant hysteresis in their OCV, such as LMR-NCMs. We thus introduced in our previous work the heat resulting from OCV hysteresis,
is equal to zero if a complete charge/discharge cycle is considered. The reversible heat was determined from entropy measurements described in the section "Determination of reversible heat" belowand is discussed in more detail elsewhere.
9
The third term on the right hand side of Eq. 1 comprises all heat flow from sources other than intercalation. This can include any side reactions such as electrolyte decomposition
17–19
or SEI formation.
22
A detailed discussion of the different sources of heat can be found in our previous IMC study,
20
in which we also elucidated the necessity to add another term to the general heat equation for materials that show a significant hysteresis in their OCV, such as LMR-NCMs. We thus introduced in our previous work the heat resulting from OCV hysteresis,  20
For this purpose, we assume that the voltage measured under OCV conditions,
20
For this purpose, we assume that the voltage measured under OCV conditions,  , is not equal to the (hypothetical) thermodynamic equilibrium potential,
  , which cannot be measured. A potential difference and thus a similar expression as for the irreversible heat generated by polarization is created. The heat flow of LMR-NCM/Li cells is thus as follows:
However, this theoretical heat balance must be adjusted for the present study. For the first cycle of LMR-NCM/Li cells, the contribution from  was found to be negligible. A detailed discussion of this simplification can be found in the section "Estimate of the magnitude of other sources of heat during the first cycle activation" at the end of the Results section below. There, we also explain why the parasitic heat, which was estimated from measurements of a symmetrical Li/Li cell, is assumed to be insignificant. The heat balance used for the calorimetry study presented here thus simplifies to:

The total heat generation is measured by isothermal micro-calorimetry (IMC) as described below. Thus, the additional heat term resulting from OCV hysteresis and activation,  , is determined from the difference between the total measured heat flow,
  , and the calculated irreversible heat. This simplification means that what we identify as
  includes contributions from
  and
and  In the section "Estimate of the magnitude of other sources of heat during the first cycle activation", we will demonstrate that these contributions are insignificant. Nevertheless, we still want to make clear that they are not zero, even though this is assumed for the calculation in Eq. 3.
Electrode fabrication and battery assembly
We used three different Li- and Mn-rich layered oxides (LMR-NCM) with varying degrees of overlithiation. According to the notation Li1+δ [TM]1-δ O2, BASF SE (Germany) provided us with a low-(δ = 0.14), mid- (δ = 0.17), and high-lithium material (δ = 0.20), which correspond to 0.33 li2MnO3, 0.42 li2MnO3, and 0.50 li2MnO3 when written in the notation x Li2MnO3 •(1-x) LiTMO2 that was used by Teufl et al. 3 This study focuses on the low-lithium material, which has been analyzed by means of calorimetry 6,20 and entropy. 9 Its exact composition is Li1.14(Ni0.26Co0.14Mn0.60)0.86O2 and will further on be referred to as "0.33 LMR-NCM." The LMR-NCMs with δ = 0.17 and δ = 0.20 will be referred to as "0.42 LMR-NCM" and "0.50 LMR-NCM," respectively. For electrode preparation, inks of the cathode active material (CAM) were prepared by mixing 92.5 wt% LMR-NCM, 3.5 wt% polyvinylidene-fluoride binder (PVdF, Solef 5130, Solvay, Belgium), and 4 wt% conductive carbon (Super-C65, Timcal, Switzerland) with N-methyl pyrrolidine (anhydrous, Sigma-Aldrich, Germany). The dispersion was mixed in a planetary orbital mixer (solid content ≈58 wt%; Thinky, USA), and the resulting ink was coated onto aluminum foil (≈15 μm, MTI, USA). After drying, the coatings were calendered (GK 300 L, Saueressig, Germany) to a porosity of ≈42%–45%. For electrochemical testing, the electrodes were dried for a minimum of 12 h at 120°C in a dynamic vacuum (Büchi, Switzerland). The loading of the LMR-NCM electrodes was ≈11.6 mg cm−2, which corresponds to ≈2.9 mAh/cm2 based on a nominal reversible capacity of 250 mAh/gLMR-NCM.
Coin cells (type CR2032) were assembled in an argon-filled glovebox (O2, H2O < 0.1 ppm, MBraun, Germany) with the manufactured cathodes (14 mm diameter), two glass fiber separators (17 mm diameter, glass microfiber #691, VWR, Germany), and a Li counter electrode (15 mm diameter, 450 μm thickness, 99.9%, Rockwood Lithium, USA). The electrolyte was composed of 100 μl of a 1m LiPF6 in an FEC:DEC-based (12:64 v:v) solvent with 24 vol% of an additional fluorinated co-solvent (BASF SE, Germany). All data reported here originate from constant current (CC) cycling at a C-rate of C/10, whereby the C-rate is referenced to a nominal reversible capacity of LMR-NCM of 250 mAh g−1. We use the term "state-of-charge" (SOC) to describe the nominal specific capacity (in mAh/gCAM) that was extracted from the cathode. It can hence be directly converted into the amount of Li in the cathode. With this definition, an SOC of 0 mAh g−1 means that the material is fully lithiated (Li1.14(Ni0.26Co0.13Mn0.6)0.86O2) while at an SOC of 346 mAh g−1, the LMR-NCM would be fully delithiated. Two sets of identical cells were analyzed in this study: (i) one set was cycled inside the calorimeter as described in Isothermal micro-calorimetry section; (ii) the second set of cells was used to determine the irreversible heat by intermittent cycling described in Determination of irreversible heat by intermittent cycling section. All data that is shown here was reproduced with at least two identical cells. For clarity, the figures below show data from one representative cell without error bars from the repeat measurement because the error bars are mostly smaller than the symbols in the figures.
Isothermal micro-calorimetry
The LMR-NCM/Li coin cells were transferred to the isothermal micro-calorimeter directly after assembly. A TAM IV calorimeter equipped with a 20 ml micro-calorimeter (stability ± 50 μK, accuracy ± 300 nW, precision ±100 nW, TA Instruments, USA) was used. The cells were cycled inside the IMC in a custom-made coin cell holder, which was connected by Cu-P bronze wires (Duo-Twist wire WDT-36–25, 36 AWG, Lakeshore, USA) to a potentiostat (SP200, BioLogic, France). A detailed description of the coin cell holder can be found elsewhere. 23 For clarification, the study presented here was conducted with a preceding but very similar sample holder model compared to that shown by Kunz et al., 23 which is why the setup and parameter values reported here, differ slightly from theirs.
All measurements were performed at 25 °C under isothermal conditions after internal gain calibration. On the reference side of the calorimeter, a dummy cell with the same content as the actual sample cell but without the cathode active material was used in order to ensure high measurement accuracy by having a comparable heat capacity of both cells. Before the experiment was started, we waited for the signal to reach a pre-set stability criteria (drift < 10 nW/h, standard deviation < 150 nW for 60 min). As the system identification process suggests, the calorimetric setup can be described as dynamical 2nd order system (PT2 system). Typically, such systems can be empirically characterized by the according unit step-response when a rectangular heat flow is applied as an input signal (for more details see Kunz et al. 23 ). The two time-constants T1 and T2 of the systems transfer-function we derived during the calibration process are T1 = 57 s and T2 = 131 s. This results in a time delay of 682 s until 99% of the steady-state heat flow value is detected. A positive sign in the observed heat flow indicates that heat is generated by the cell.
Galvanostatic cycling was done at C/10. First, a formation cycle was conducted between 2.0–4.8 V (all voltages are reported further on vs Li+/Li), followed by a stabilization cycle (2.0–4.7 V), which was not further analyzed, and another cycle (2.0–4.7 V) representative of the reversible cycling behavior of the LMR-NCM materials after their first-cycle activation. After each half-cycle (i.e., whenever the upper or lower cutoff was reached), the CC phase was followed by a 6 h open-circuit phase in order to enable separation of the heat flow during charge and discharge. Two identical cells were measured for each experiment in order to ensure the reproducibility of the results. The raw heat flow data obtained by IMC were normalized by the cathode active material mass and corrected for their relative y-offset by subtracting a baseline. For the charge half-cycles, a constant y-offset was determined prior to the start of the CC phase. For the discharge half-cycles, an exponential decay function fitted to the observed gradually subsiding heat flow signal was used as a baseline during the preceding OCV phase. Because the heat flow signal in the rest phase after charging did not converge to a stable value within the 6 h of relaxation, we were unable to use a simple y-offset for the discharge half-cycles. Because of the time delay, the integration of the heat flow of an individual charge or discharge half-cycle includes not only the heat signal obtained during current flow but also that obtained during the subsequent relaxation phase. Of the 6 h relaxation phase applied, we included only the first 1.5 h into the calculation. This is sufficient to obtain most of the actual heat signal, yet not so long that parasitic heat flows might be erroneously included in the calculation. A waiting time of 1.5 h might seem ineptly long considering the time delay of ≈11 min until 99% of the signal is observed in the calibration measurement. However, the determined time delay needs to be classified as a signal response of an ideal system, i.e. an electrical resistor, whose heat generation strictly follows the applied current profile. The reported value hence solely describes the time delay of the IMC instrument. When the applied current of a coin cell with a real cell chemistry is switched off at the beginning of a rest phase, equilibration processes within the electrodes occur and lead to heat generation with much longer time constants. For a reliable analysis of IMC data, it is hence crucial to critically assess how much of the rest phase will be included into the integration of the heat signal. This value should be reported to allow comparison to other reports and instruments.
Determination of irreversible heat by intermittent cycling
Complementary to the IMC measurements, electrochemical testing was performed with identical cells at 25 °C in a temperature-controlled oven (Binder, Germany) using a Biologic potentiostat (VMP300, Biologic, France). To calculate the irreversible heat according to Eq. 3, the overpotential,  , was determined by intermittent cycling. The cycling protocol applied is similar to a galvanostatic intermittent titration and was used as in our previous study,
20
in which the approach is described in more detail. The first cycle was conducted between 2.0–4.8 V, followed by a stabilization cycle (2.0–4.7 V), which was not further analyzed, and another cycle (2.0–4.7 V) representative of the reversible cycling behavior of LMR-NCMs after their first-cycle activation. All cycles were conducted at C/10. Figure 1 shows the voltage curve of a 0.33 LMR-NCM/Li cell obtained by intermittent cycling during the first charge and discharge (black solid line). The cycling procedure includes (dis)charging steps of ΔSOC = 2.5% followed by a relaxation phase of
, was determined by intermittent cycling. The cycling protocol applied is similar to a galvanostatic intermittent titration and was used as in our previous study,
20
in which the approach is described in more detail. The first cycle was conducted between 2.0–4.8 V, followed by a stabilization cycle (2.0–4.7 V), which was not further analyzed, and another cycle (2.0–4.7 V) representative of the reversible cycling behavior of LMR-NCMs after their first-cycle activation. All cycles were conducted at C/10. Figure 1 shows the voltage curve of a 0.33 LMR-NCM/Li cell obtained by intermittent cycling during the first charge and discharge (black solid line). The cycling procedure includes (dis)charging steps of ΔSOC = 2.5% followed by a relaxation phase of  = 1 h. This was repeated until the upper (lower) voltage cutoff was reached. Using this approach,
  is determined as the difference between the last voltage value at current flow,
  , and the open-circuit voltage,
  , at the end of the intermittent relaxation phase, as shown in the inset of Fig. 1. The average of the final 300 s of the OCV phase are used as
  The intermittent cycling method is not applicable for determining
  for the first SOC point during charging or discharging because there is no preceding voltage relaxation in the charge (discharge) direction. By applying small ΔSOC steps, we aim to minimize the effect of this missing data point.

Figure 1. Voltage curves of the first cycle of a 0.33 LMR-NCM/Li cell at C/10. During intermittent cycling, the (dis)charging was interrupted every ΔSOC = 2.5% for 1 h and when the upper or lower cutoff potential was reached. The OCV values ( ) at the end of each OCV rest phase are depicted as blue circles and the measured voltage (
 ) as a solid black line. A voltage curve from a continuous cycle of an identical cell is shown for comparison (dashed orange line). The inset shows voltage and current of the cell from intermittent cycling as a function of time at an SOC ≈ 180 mAh g−1 during discharge. This illustrates how the overpotential,
  is calculated from the difference between the last voltage point on load,
  and
and 
Download figure:
Standard image High-resolution imageThe measurement of  after 1 h of relaxation means that slow relaxation processes that happen on the order of hours or even weeks (i.e., lithium diffusion in the solid phase) are not included into the calculation of the overpotential and hence the irreversible heat. However, prolonged relaxation phases at every ΔSOC = 2.5% would lead to severe self-discharge effects and an uncertainty in the determination of the nominal SOC. From previous experiments, we know that a 1 h OCV phase leads to reliable SOC data and a tolerable inaccuracy in the determination of
  For example, when the last discharging step in Fig. 1 is considered, the overpotential
  determined after
  = 1 h amounts to ≈96% of that after
  = 6 h. Nevertheless, we want to emphasize that a longer rest phase would generally lead to higher values for
  Since
Since  is calculated by subtracting
  from the total heat signal, this means that the heat because of hysteresis and activation would be slightly smaller if a longer rest phase were chosen. However, the error is small in comparison to other measurement inaccuracies.
As can be seen in Fig. 1, the charge and discharge capacities of an LMR-NCM/Li cell from constant current cycling (as applied for the IMC cells, dashed orange line) are slightly lower than from the intermittent cycling (solid black line). These deviations amount to ≈−2% for the charge capacity and ≈−4% for the discharge capacity and can be explained by the different cycling procedures. Because in the intermittent protocol, a 1 h rest phase is applied every ΔSOC = 2.5%, any concentration gradients which are formed in the cell during cycling (e.g., because of liquid or solid diffusion limitations) are continuously minimized. This means that the intercalation processes are closer to equilibrium and that more Li-ions can be (de-)intercalated during intermittent cycling compared with a constant current cycling. In addition, self-discharge phenomena might occur for the cells subjected to intermittent cycling, especially at high SOCs during charge because they spend more time at high voltages. When the upper voltage plateau is considered (SOC > 125 mAh g−1), both cell types spend ≈6 h in this region during the constant current phase. However, while for the IMC cells, only another 6 h during the subsequent OCV phase must be added, the cells from intermittent cycling go through ≈27 OCV phases of 1 h each in this region. This may enhance self-discharge phenomena and lead to a higher observable charge capacity. Because the deviations are rather small, the results from intermittent cycling can still be used to complement those from the IMC cells.
Determination of reversible heat
As shown in Eq. 2, the reversible heat is calculated as a product of the applied current, temperature, and temperature-dependent OCV value,  The latter was measured as a function of SOC after (dis)charging the cell to a certain SOC point and allowing it to relax until the change in OCV over time was less than ≈0.2 mV/h. After this relaxation,
  was determined by linearly varying the temperature of the cell between 5 °C and 35 °C in an Espec temperature chamber (LU114, Espec, Japan) while recording the respective OCV variation (VMP300, Biologic, France). A detailed description of the method applied and the results for the low- and high-lithium material are reported elsewhere.
9
was determined by linearly varying the temperature of the cell between 5 °C and 35 °C in an Espec temperature chamber (LU114, Espec, Japan) while recording the respective OCV variation (VMP300, Biologic, France). A detailed description of the method applied and the results for the low- and high-lithium material are reported elsewhere.
9
Results and Discussion
Heat generation during activation of LMR-NCM
The cyclic voltage curves of the first and the third cycle of an LMR-NCM/Li cell at C/10 are shown in Fig. 2a. The second cycle is not shown because it is not representative of the continuous cycling. The first charge-discharge profile (blue curve in Fig. 2a) starts with an initial sloping region, which is associated with the oxidation of transition metals (Ni and Co), followed by a voltage plateau at ≈4.5 V during which irreversible structural changes such as transition metal migration,
1,7,10
oxygen redox,
13,14
and the loss of a honeycomb ordering
10,11
occur. The first charge of LMR-NCM thus includes unique activation processes, which cause the cell resistance,
5
the lattice parameters,
8
and the entropy curve
9
to differ from those of the following cycles. Furthermore, at high SOCs (voltage > 4.6 V), oxygen is released from the near-surface region of the material.
3,12
The voltage profile of the first charge differs significantly from that of the following cycles (black curve in Fig. 2a). In contrast, the subsequent discharge voltage curve agrees with those of following cycles. Compared with the charge, the discharge in the first cycle occurs at a much lower average potential, and the discharge capacity that can be achieved is ≈40 mAh g−1 lower because of an irreversible loss of capacity. Both factors combined lead to a significantly lower discharge energy and a considerable loss of electrical energy during the first cycle, which is shown in Table I ( ). In other words, the energy efficiency of the first cycle (≈73%) is significantly lower than that of the third cycle (≈90%).

Figure 2. (a) Voltage curve of the first cycle (blue) and the third cycle (black) of a 0.33 LMR-NCM/Li cell at C/10. Panels (b) and (c) show the heat flow profiles during charge and discharge, respectively, with the heat flow of the first cycle in blue and the third cycle in black. The heat measured by IMC is shown by thick solid lines and originates from the same cell of which the voltage curves are shown in (a). The irreversible heat calculated from intermittent cycling is depicted as filled symbols connected by thin lines, with error bars from two different cells.
Download figure:
Standard image High-resolution imageTable I. Measured and calculated energy losses for a 0.33 LMR-NCM/Li cell at C/10 and 25 °C for the first and third cycle. The charge (Echa) and discharge electrical energy (Edis), the relative electrical energy efficiency (Edis/Echa) and the absolute electrical energy loss (Echa-Edis) are shown together with the total heat generation measured by IMC (QIMC,total), and the ratio of total heat/electrical energy loss for the whole cycle. Energy terms are given in mWh g−1 and ratios in %.
| Cycle |
 [mWh g−1] [mWh g−1] |
 [mWh g−1] [mWh g−1] |
 [%] [%] |
 [mWh g−1] [mWh g−1] |
 [mWh g−1] [mWh g−1] |
 [%] [%] |
|---|---|---|---|---|---|---|
| 1 | 1240.1 | 906.5 | 73 | 333.6 | 143.0 | 43 |
| 3 | 972.8 | 878.7 | 90 | 94.1 | 87.7 | 93 |
Table I furthermore illustrates that for the third cycle, the electrical energy lost ( ) is almost completely observed as waste heat by IMC (
 ). With 93%, the accuracy of this measurement is comparable to our previous study,
20
where we discuss possible error sources that might have led to the deviation observed. These include the cables connecting the coin cell holder, which might remove heat from the cell and hence the detector. Another issue is the choice of the integration limit for the calculation of the IMC heat. From the 6 h OCV phase at the end of each half-cycle, only the first 1.5 h were considered for the calculation, as explained in Isothermal micro-calorimetry section. This should be enough time to include the diminishing heat generation resulting from the time delay of the calorimeter and the equilibration processes within the cell, yet not too long to erroneously include too much heat from parasitic processes, such as electrolyte decomposition. However, if the heat signal of the complete rest phase had been taken instead, the resulting total IMC heat would correspond to 97% of the electrical work lost. Overall, we conclude that within the accuracy of the IMC measurement quasi all of the electrical energy lost during the third cycle is converted into waste heat. Table II shows that ≈33% of the overall measured heat of 87.7 mWh g−1 is dissipated during charge (28.7 mWh g−1) and ≈67% during discharge (59.0 mWhg−1). The irreversible heat determined from intermittent cycling thereby covers ≈57% of the heat generated during charge and ≈47% of the heat observed during discharge. The residual part of the heat is caused by the OCV hysteresis, which is discussed in detail in our previous IMC study.
20
The analysis of the first cycle shown in Table II illustrates that of the total heat ≈55% is generated during charge (78.8 mWh g−1) and ≈45% during discharge (64.2 mWh g−1). The irreversible heat determined by intermittent cycling accounts for ≈19% of the heat during charge and ≈43% of the heat during discharge. The fact that only a small share of the heat generated during the first charge is due to polarization effects means that a considerable amount is caused by another heat source. This will be discussed in more detail in Heat resulting from activation and hysteresis section. A comparison of the absolute numbers of
). With 93%, the accuracy of this measurement is comparable to our previous study,
20
where we discuss possible error sources that might have led to the deviation observed. These include the cables connecting the coin cell holder, which might remove heat from the cell and hence the detector. Another issue is the choice of the integration limit for the calculation of the IMC heat. From the 6 h OCV phase at the end of each half-cycle, only the first 1.5 h were considered for the calculation, as explained in Isothermal micro-calorimetry section. This should be enough time to include the diminishing heat generation resulting from the time delay of the calorimeter and the equilibration processes within the cell, yet not too long to erroneously include too much heat from parasitic processes, such as electrolyte decomposition. However, if the heat signal of the complete rest phase had been taken instead, the resulting total IMC heat would correspond to 97% of the electrical work lost. Overall, we conclude that within the accuracy of the IMC measurement quasi all of the electrical energy lost during the third cycle is converted into waste heat. Table II shows that ≈33% of the overall measured heat of 87.7 mWh g−1 is dissipated during charge (28.7 mWh g−1) and ≈67% during discharge (59.0 mWhg−1). The irreversible heat determined from intermittent cycling thereby covers ≈57% of the heat generated during charge and ≈47% of the heat observed during discharge. The residual part of the heat is caused by the OCV hysteresis, which is discussed in detail in our previous IMC study.
20
The analysis of the first cycle shown in Table II illustrates that of the total heat ≈55% is generated during charge (78.8 mWh g−1) and ≈45% during discharge (64.2 mWh g−1). The irreversible heat determined by intermittent cycling accounts for ≈19% of the heat during charge and ≈43% of the heat during discharge. The fact that only a small share of the heat generated during the first charge is due to polarization effects means that a considerable amount is caused by another heat source. This will be discussed in more detail in Heat resulting from activation and hysteresis section. A comparison of the absolute numbers of  in Table II indicates that the heat generated during discharge is similar for the first and the third cycle and that a comparable proportion of the heat observed is due to polarization effects. In contrast, with
  78.8 mWh g−1, the total heat released during the first charge is almost three-fold of that released during the third charge (28.7 mWh g−1). The most striking observation is that for the first cycle, the lost electrical energy (333.6 mWh g−1) far exceeds the waste heat observed by IMC (143.0 mWh g−1), as Table II shows. In fact, only ≈43% of the energy lost is converted into heat. From the analysis of the third cycle, we know that this cannot be caused by instrumental errors. The question thus arises as to why the electrical energy lost cannot be observed as waste heat. In order to clarify this, we need to revisit the cyclic voltage curve in Fig. 2a, which shows that the charge/discharge process is not a closed loop for the first cycle. The large irreversible loss of capacity (≈40 mAh g−1) together with the fact that the first charge profile is unique and includes irreversible processes mean that the first cycle is not a thermodynamically reversible process. Simply speaking, the LMR-NCM material at the end of the first cycle differs from the pristine material at the beginning. The difference in the charge and discharge energy therefore includes not only waste heat but also a considerable amount of electrical energy that is consumed by irreversible processes in the active material or that cannot be extracted anymore during discharge because of the restructuring of the LMR-NCM and the loss of chemically available Li sites. From the voltage curve alone, it is therefore not possible to assess how much waste heat will be released during the first cycle. IMC measurements enable us to quantify the heat generated during the activation cycle of LMR-NCM as a function of SOC and separate it into its share in charge and discharge direction, which, to our knowledge, is reported here for the first time.
Table II. Measured and calculated energy losses for a 0.33 LMR-NCM/Li cell at C/10 and 25 °C for the first and third cycle separated by charge and discharge direction. The heat measured by IMC during charge (QIMC,cha) and discharge (QIMC,dis) and the respective irreversible heat (Qirrev,cha and Qirrev,dis) are shown together with the ratio of the irreversible/measured heat during charge and discharge. Energy terms are given in mWh g−1 and ratios in %.
| Cycle |
 [mWh g−1] [mWh g−1] |
 [mWh g−1] [mWh g−1] |
 [%] [%] |
 [mWh g−1] [mWh g−1] |
 [mWh g−1] [mWh g−1] |
 [%] [%] |
|---|---|---|---|---|---|---|
| 1 | 78.8 | 15.2 | 19 | 64.2 | 27.5 | 43 |
| 3 | 28.7 | 16.2 | 57 | 59.0 | 27.6 | 47 |
In addition to the overall heat generation, the heat flow profiles provide valuable information resolved as a function of SOC. The heat flow curves of the first and the third cycle of an LMR-NCM/Li cell measured by IMC at C/10 are shown in Fig. 2b for the charge direction and in Fig. 2c for the discharge direction. In both plots, the heat flow measured by IMC,  (solid lines), is contrasted with the irreversible heat generation,
  (filled symbols), determined from identical cells by intermittent cycling. As explained in Isothermal micro-calorimetry section, a 6 h rest phase was applied between charge and discharge of the IMC cells in order to enable separation of the heat flow of the two respective half-cycles. The heat flow was measured as a function of time and with the applied constant current this time axis was converted into an SOC scale. However, we wish to emphasize that with this approach, the time delay of the calorimeter is neglected. As was already discussed in our previous IMC study,
20
the resulting error is small for slow C-rates. With the C/10 current applied here, it is in the order of ≈2% when the time delay of ≈11 min, until 99% of the signal is observed, is compared to the duration of the first charge (≈12 h).
(filled symbols), determined from identical cells by intermittent cycling. As explained in Isothermal micro-calorimetry section, a 6 h rest phase was applied between charge and discharge of the IMC cells in order to enable separation of the heat flow of the two respective half-cycles. The heat flow was measured as a function of time and with the applied constant current this time axis was converted into an SOC scale. However, we wish to emphasize that with this approach, the time delay of the calorimeter is neglected. As was already discussed in our previous IMC study,
20
the resulting error is small for slow C-rates. With the C/10 current applied here, it is in the order of ≈2% when the time delay of ≈11 min, until 99% of the signal is observed, is compared to the duration of the first charge (≈12 h).
Figure 2c shows that the heat generated during the first discharge agrees well with that during the third cycle—similar to what is expected from the voltage curve. In the first part of the discharge process (300 mAh g−1 > SOC > 175 mAh g−1), heat generation is relatively constant (≈3 mW g−1). When the cell is discharged below ≈175 mAh g−1, the heat signal increases to ≈10 mW g−1 and at the end of discharge, another sharp increase in the heat generation is observed. The irreversible heat is rather constant (≈1 mW g−1) over a wide SOC range and increases exponentially when the cell is discharged below ≈125 mAh g−1. Irreversible heat is caused by polarization effects in the cell. These include the ionic resistance of the separator, the electric resistance of the external cell contacts, the resistance of the Li anode, the charge transfer resistance of the cathode, the contact resistance between the cathode coating and the current collector, and the ionic resistance of the electron and ion conduction across the cathode. For reversible cycles such as the third cycle shown in Fig. 2, a detailed discussion on the underlying resistances causing  can be found in our previous publication
20
in which we conducted impedance measurements and concluded that the charge transfer resistance of the cathode dominates the polarization effects. Its increasing values at low and high SOC give rise to the observed curve shape as a function of SOC, which is in agreement with the results of Teufl et al.
5
The data in Fig. 2c suggest that the polarization effects in the first discharge agree with those of the third cycle. The difference observed between
can be found in our previous publication
20
in which we conducted impedance measurements and concluded that the charge transfer resistance of the cathode dominates the polarization effects. Its increasing values at low and high SOC give rise to the observed curve shape as a function of SOC, which is in agreement with the results of Teufl et al.
5
The data in Fig. 2c suggest that the polarization effects in the first discharge agree with those of the third cycle. The difference observed between  and
and  will be discussed in more detail in the next chapter.
In contrast to the discharge direction, the heat generation observed by IMC during the first charge differs significantly from the profile during the third charge as can be seen in Fig. 2b. During activation,  has a constant region with values between 1 and 2 mW g−1 at the beginning of charge until the cell reaches an SOC of ≈100 mAh g−1, where the heat signal starts to increase. At SOC > 125 mAh g−1, the heat flow profile then shows a saturation behavior, where
  is between ≈7 mW g−1 and ≈12 mW g−1. At the end of charge, another steep increase is observed. In contrast, during the third charge, the heat flow profile exhibits a U-shape starting at ≈4.5 mW g−1 at low SOC. This is followed by a plateau around ≈1.5 mW g−1 in the mid-SOC region and an increase up to ≈10 mW g−1 at the end of the charge. The heat flow curves during activation and the following cycles thus differ significantly in case of the charge direction. With the results from intermittent cycling, we can analyze whether the observed mismatch is caused by differences in the irreversible heat profile. For the low SOC region, both heat flow profiles are dominated by the irreversible heat. In the third charge, which starts at ≈40 mAh g−1 because of the irreversible capacity loss in the first cycle (see voltage profile in Fig. 2a), the irreversible heat and IMC signal agree well below ≈200 mAh g−1, which means that the measured heat is mainly caused by polarization effects. In the first charge,
  is close to
  in the SOC region <100 mAh g−1. The observed mismatch between the first and the third charge in the low SOC region is thus caused by the irreversible heat flow. For the third charge, the results for
  agree with those previously reported,
20
thereby indicating that the charge transfer resistance of the cathode dominates the underlying polarization effects. Based on the impedance measurements by Teufl et al.,
5
it is known that for a cell with an LMR-NCM cathode that has not yet been charged beyond 100 mAh g−1, the polarization effects are significantly lower and have a different profile as a function of SOC compared to a cell that underwent a full activation cycle. The observed mismatch in the
agree with those previously reported,
20
thereby indicating that the charge transfer resistance of the cathode dominates the underlying polarization effects. Based on the impedance measurements by Teufl et al.,
5
it is known that for a cell with an LMR-NCM cathode that has not yet been charged beyond 100 mAh g−1, the polarization effects are significantly lower and have a different profile as a function of SOC compared to a cell that underwent a full activation cycle. The observed mismatch in the  curves of the first and the third charge in the SOC region below ≈100 mAh g−1 are thus caused by differences in the underlying cathode resistance, which dominate the irreversible heat. However, for the SOC range in which the mismatch between the
  curves of the first and the third charge is most striking (>100 mAh g−1), the results from intermittent cycling prove that this is not caused by the irreversible heat. When comparing the curves for
  in the first (blue symbols) and the third charge (black symbols) in Fig. 2b, we observe that in this SOC range, the curves for
  agree well for both cycles. For the first charge, there must therefore be an additional source of heat, which can no longer be observed in the following cycles. This additional heat generation will be discussed in detail in the following.
Heat resulting from activation and hysteresis
Figure 3a and Fig. 3b show a detailed analysis of the heat flow that is observed during the first activation charge and discharge. There, heat generation measured by IMC (solid lines) is compared with the irreversible heat flow determined by intermittent cycling (black circles and shaded gray area). As mentioned in the Experimental section, the intermittent cycling was conducted with identical cells as used for the IMC experiments. The apparent charge and discharge capacity of the cells from intermittent cycling is slightly higher than that of the IMC cells because of the different cycling procedures (see Determination of irreversible heat by intermittent cycling section).
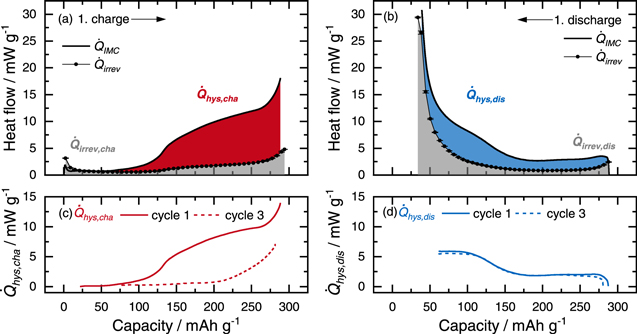
Figure 3. Heat flow of a 0.33 LMR-NCM/Li cell during activation at C/10: (a) and (b) show the heat flow measured by IMC,  (solid black lines) together with the irreversible heat flow determined by intermittent cycling,
  (black circles) during charge and discharge. The colored areas in (a) and (b) correspond to the irreversible heat (gray) and the heat resulting from OCV hysteresis (red for charge, blue for discharge). The error bars for
  are calculated from the measurement of two identical cells. The generation of
  for charge and discharge is plotted in (c) and (d); the solid lines correspond to the
  generation during the first cycle, and the dashed lines represent the third cycle.
Download figure:
Standard image High-resolution imageFor the charge half-cycle, the IMC signal agrees with the calculated value of  until SOC ≈100 mAh g−1, i.e., up to the point where the gradual transition to the upper voltage plateau initiates (see Fig. 2a). During the transition to the upper voltage plateau that is reached at ≈125 mAh g−1,
  increases significantly, while
  remains constant, indicating that an additional source of heat is present for LMR-NCM. When comparing the heat generation profiles in Fig. 3a to the voltage curve in Fig. 2a, it becomes clear that the onset of this large heat generation coincides with the beginning of the upper voltage plateau during which irreversible structural rearrangements lead to the activation of the LMR-NCM. We thus ascribe this large generation of heat to these activation processes, as suggested by Assat et al.
21
for the first cycle of Li2Ru0.75Sn0.25O3. The additional heat source shall here be termed
remains constant, indicating that an additional source of heat is present for LMR-NCM. When comparing the heat generation profiles in Fig. 3a to the voltage curve in Fig. 2a, it becomes clear that the onset of this large heat generation coincides with the beginning of the upper voltage plateau during which irreversible structural rearrangements lead to the activation of the LMR-NCM. We thus ascribe this large generation of heat to these activation processes, as suggested by Assat et al.
21
for the first cycle of Li2Ru0.75Sn0.25O3. The additional heat source shall here be termed  and is illustrated by the red shaded area in Fig. 3a for the first charge. Above ≈125 mAh g−1,
  is the main source of heat. For the discharge direction, the IMC signal deviates from the irreversible heat over the whole SOC range. This means that there is a continuous
  generation corresponding to the blue shaded area in Fig. 3b. To better analyze the profile of the
  generation, Fig. 3c and Fig. 3d show the difference curve, which is obtained by subtracting
  from
from  in the respective upper panels (solid lines for the first cycle). For the charge direction, the generation of
  starts at ≈100 mAh g−1 with a steep increase until ≈140 mAh g−1, where the curvature changes into an approximately linear slope. In the SOC range between ≈140 mAh g−1 and ≈260 mAh g−1, the
  generation continuously rises from ≈4.5 mW g−1 to ≈10 mW g−1. At the end of charge, another steep increase to ≈14 mW g−1 is observed. Figure 3d shows that, during the discharge half-cycle,
  is generated over the entire SOC range. The heat flow profile of
  can be described with two plateaus at high and low SOC that are connected by a step-like feature: at the beginning of discharge, a constant value of ≈2 mW g−1 is observed, which increases when the cell is discharged below ≈170 mAh g−1. The second plateau is reached at SOCs < 100 mAh g−1, where
  is ≈5 mW g−1. The
  generation thus shows a clear asymmetry between the first charge and discharge.
When we compare the generation of  during the first cycle with that during the third cycle (solid vs dashed lines in Fig. 3c and Fig. 3d, we see a clear difference for the charge direction. For the discharge cycles, on the other hand, both
  curves overlap, as do the total heat flow and the irreversible heat generation,
  (see Fig. 2c). The fact that the heat evolution during discharge in the first and the consecutive cycles agrees resembles the behavior of the lattice parameters
8
and the entropy curve
9
of the same LMR-NCM material reported in the literature. In contrast, while the irreversible heat during charge at SOCs above ≈100 mAh g−1 is fairly comparable for the first and the third cycle, the overall heat signal differs significantly (see Fig. 2b). This, in turn, leads to a considerably different
(see Fig. 2c). The fact that the heat evolution during discharge in the first and the consecutive cycles agrees resembles the behavior of the lattice parameters
8
and the entropy curve
9
of the same LMR-NCM material reported in the literature. In contrast, while the irreversible heat during charge at SOCs above ≈100 mAh g−1 is fairly comparable for the first and the third cycle, the overall heat signal differs significantly (see Fig. 2b). This, in turn, leads to a considerably different  generation profile. In the third cycle,
  is observed only at high SOCs (>200 mAh g−1), where it increases steadily and reaches a maximum of ≈7 mW g−1 at the end of charge, as reported in our previous study.
20
On the other hand, in the first charge, the onset of
is observed only at high SOCs (>200 mAh g−1), where it increases steadily and reaches a maximum of ≈7 mW g−1 at the end of charge, as reported in our previous study.
20
On the other hand, in the first charge, the onset of  is earlier (≈100 mAh g−1), and the overall heat generation observed is substantially higher (
 ≈12.3 mWh g−1 for the third vs
  ≈63.8 mWh g−1 for the first charge). Thus, what we label here as
  is not the same for the first and any consecutive cycle, because
  during the first charge includes the heat generation from irreversible activation processes, which occur only during the upper voltage plateau of the first charge half-cycle.
Interestingly, for the charge direction, the onset of  in the first cycle occurs in the same SOC region where the transition to the upper voltage plateau initiates (at ≈100 mAh g−1). Thus, in the SOC window between ≈100-125 mAh g−1, both the voltage curve and the
  curve show a steep increase. At SOCs above ≈150 mAh g−1, the upper voltage plateau is reached, and the voltage curve flattens out. In this SOC range, the
  profile increases in an approximately linear manner. The major proportion of
  is generated in this high SOC region, which coincides with the upper voltage plateau of the cell. As explained above, irreversible processes
10,13
occur during the upper voltage plateau. Our results clearly indicate that this activation process generates a significant amount of heat release.
is generated in this high SOC region, which coincides with the upper voltage plateau of the cell. As explained above, irreversible processes
10,13
occur during the upper voltage plateau. Our results clearly indicate that this activation process generates a significant amount of heat release.
There are also some similarities between the  generation during activation and the gas release measured by on-line electrochemical mass spectrometry (OEMS). For a similar LMR-NCM material as used in the present study, Strehle et al.
12
and Teufl et al.
3
report that the CO2 generation during the first charge starts between ≈100-125 mAh g−1. This coincides with the sloping region at the beginning of the upper voltage plateau and the onset of the
generation during activation and the gas release measured by on-line electrochemical mass spectrometry (OEMS). For a similar LMR-NCM material as used in the present study, Strehle et al.
12
and Teufl et al.
3
report that the CO2 generation during the first charge starts between ≈100-125 mAh g−1. This coincides with the sloping region at the beginning of the upper voltage plateau and the onset of the  generation observed here. The increase of the CO2 concentration as a function of SOC resembles the shape of the
  signal up to ≈270 mAh g−1. When the cell is charged even higher, both
  and the CO2 generation show a steep increase. In this high SOC range, O2 generation is observed by OEMS.
3,12
The CO2 evolution below 4.6 V (≈270 mAh g−1) is attributed to the chemical decomposition of Li2CO3, which reacts with protons formed by either the anionic oxidation of the electrolyte or trace impurities.
3,12,24
The CO2 and O2 evolution at high SOC are ascribed to the release of lattice oxygen from the surface of the LMR-NCM particles, which either reacts with the electrolyte to form CO2 or is evolved as O2.
4
An O-depleted spinel/rock salt surface layer is thereby formed around the LMR-NCM particles.
3,12,13
and the CO2 generation show a steep increase. In this high SOC range, O2 generation is observed by OEMS.
3,12
The CO2 evolution below 4.6 V (≈270 mAh g−1) is attributed to the chemical decomposition of Li2CO3, which reacts with protons formed by either the anionic oxidation of the electrolyte or trace impurities.
3,12,24
The CO2 and O2 evolution at high SOC are ascribed to the release of lattice oxygen from the surface of the LMR-NCM particles, which either reacts with the electrolyte to form CO2 or is evolved as O2.
4
An O-depleted spinel/rock salt surface layer is thereby formed around the LMR-NCM particles.
3,12,13
Let us first discuss the decomposition of Li2CO3. According to the enthalpies of formation listed in the NIST database,
25
the enthalpy of reaction for Li2CO3 + 2 HF  2 liF + H2O + CO2 is ≈−155.6 kJ/
 and thus exothermic. The decomposition of Li2CO3 as a surface impurity is reported to be on the order of ≈0.6 wt%,
12
which means that per gram of LMR-NCM active material, only ≈80 μmol of Li2CO3 are decomposed. The enthalpy of the decomposition thus translates to a heat generation per gram of LMR-NCM of ≈3.5 mWh g−1. When we calculate absolute numbers for
and thus exothermic. The decomposition of Li2CO3 as a surface impurity is reported to be on the order of ≈0.6 wt%,
12
which means that per gram of LMR-NCM active material, only ≈80 μmol of Li2CO3 are decomposed. The enthalpy of the decomposition thus translates to a heat generation per gram of LMR-NCM of ≈3.5 mWh g−1. When we calculate absolute numbers for  based on the difference between the total heat measured by IMC and the irreversible heat determined by intermittent cycling shown in Table i and Table II, we observe that
  amounts to ≈63.8 mWh g−1 (≈20 kJ mol−1, based on a molecular mass of the 0.33 LMR-NCM of 88.5 g/mol) for the first charge of LMR-NCM. Compared to this value, the decomposition reaction can explain only a small fraction of the observed heat generation. We can therefore exclude that it is the predominant source of the
  generation. However, as mentioned in Calculation approach section, other sources of heat, such as reversible and parasitic heat, contribute to the overall heat signal, but as will be shown in Estimate of the magnitude of other sources of heat during the first cycle activation section, both of these terms are negligible compared to the magnitude of the heat generation observed. The second process that causes gas evolution at high SOCs is the transformation of the surface-near region of the LMR-NCM particles from a layered to a spinel/rock salt structure.
3,12,13
At high degrees of delithiation, this process is reported to be exothermic.
26,27
According to DFT calculations by Wang et al.,
26
layered Li0.25NiO2 can be transformed to rock salt NiO and/or spinel LiNi2O4 with reaction enthalpies of ≈−10 kJ mol−1 to ≈−15 kJ mol−1. However, in the presence of electrolyte, which reacts with the evolved O2, the heat is reported to be approximately 10 times higher, with numbers between ≈−75 kJ/mol for Li0.45Ni0.33Co0.33Mn0.33O2 and ≈−130 kJ/mol for Li0.45Ni0.8Co0.15Al0.05O2 in 1.2 m LiPF6/EC:EMC (3:7 wt%).
27
It needs to be stressed that these literature values refer to a complete material decomposition, while in the present study only a few mol% of the LMR-NCM at the particle surface are expected to be reconstructed.
3,12
For the first charge, we observe that
generation. However, as mentioned in Calculation approach section, other sources of heat, such as reversible and parasitic heat, contribute to the overall heat signal, but as will be shown in Estimate of the magnitude of other sources of heat during the first cycle activation section, both of these terms are negligible compared to the magnitude of the heat generation observed. The second process that causes gas evolution at high SOCs is the transformation of the surface-near region of the LMR-NCM particles from a layered to a spinel/rock salt structure.
3,12,13
At high degrees of delithiation, this process is reported to be exothermic.
26,27
According to DFT calculations by Wang et al.,
26
layered Li0.25NiO2 can be transformed to rock salt NiO and/or spinel LiNi2O4 with reaction enthalpies of ≈−10 kJ mol−1 to ≈−15 kJ mol−1. However, in the presence of electrolyte, which reacts with the evolved O2, the heat is reported to be approximately 10 times higher, with numbers between ≈−75 kJ/mol for Li0.45Ni0.33Co0.33Mn0.33O2 and ≈−130 kJ/mol for Li0.45Ni0.8Co0.15Al0.05O2 in 1.2 m LiPF6/EC:EMC (3:7 wt%).
27
It needs to be stressed that these literature values refer to a complete material decomposition, while in the present study only a few mol% of the LMR-NCM at the particle surface are expected to be reconstructed.
3,12
For the first charge, we observe that  amounts to ≈63.8 mWh g−1 (≈20 kJ mol−1). However, these calculated numbers refer to the whole SOC range, whereas O2 evolution from the CAM reconstruction is observed only at high SOC. By fitting a baseline through the
  profile between 100 mAh g−1 and 250 mAh g−1, the heat generation that is observed on top of this baseline at higher SOCs (i.e., between ≈250-280 mAh g−1) can be integrated. We thus estimate the additional heat generated above 250 mAh g−1 to be ≈1.1 mWh g−1 (≈0.36 kJ mol−1). Assuming that ≈3 mol% of the LMR-NCM at the surface are transformed to a spinel/rock salt structure,
3,12
the expected energy values are between 0.3 kJ mol−1 and 0.45 kJ mol−1, assuming no reaction of the evolving O2 with the electrolyte
26
and between 2.25 kJ mol−1 and 3.9 kJ mol−1 with electrolyte decomposition.
27
Because the OEMS studies indicate that the CO2 signal increases once O2 is detected,
3,12
a combination of both reactions is observed. We therefore conclude that the increase in the
profile between 100 mAh g−1 and 250 mAh g−1, the heat generation that is observed on top of this baseline at higher SOCs (i.e., between ≈250-280 mAh g−1) can be integrated. We thus estimate the additional heat generated above 250 mAh g−1 to be ≈1.1 mWh g−1 (≈0.36 kJ mol−1). Assuming that ≈3 mol% of the LMR-NCM at the surface are transformed to a spinel/rock salt structure,
3,12
the expected energy values are between 0.3 kJ mol−1 and 0.45 kJ mol−1, assuming no reaction of the evolving O2 with the electrolyte
26
and between 2.25 kJ mol−1 and 3.9 kJ mol−1 with electrolyte decomposition.
27
Because the OEMS studies indicate that the CO2 signal increases once O2 is detected,
3,12
a combination of both reactions is observed. We therefore conclude that the increase in the  profile above ≈250 mAh g−1 might be correlated to the reconstruction of the CAM particle surface from a layered to an O-depleted spinel/rock salt structure. The heat of this reaction together with the heat generated when the evolved O2 reacts with the electrolyte might be the cause of the sharp increase in the IMC signal towards the end of charge (see Fig. 3c). However, a more thorough analysis is required to prove this hypothesis. Moreover, it is important to stress that the O2 evolution of the LMR-NCM can explain only this rather small part of the overall
  heat above ≈250 mAh g−1. Most of the heat generation observed is thus caused by bulk phenomena and not by the gas evolution from the LMR-NCM particle surface.
The findings discussed above feed into a scheme for the reaction energy landscape of LMR-NCM shown in Fig. 4. It is similar to previously reported hysteresis loops for molecular hysteresis
28,29
and follows the scheme drawn for the Li-rich layered model material Li[Li0.33Ru0.5Sn0.17]O2.
21
The first cycle (Fig. 4a) starts from the pristine material, which is electrochemically oxidized on charge requiring the electrical charge energy  The difference between
  in Fig. 4 and
  as used above, e.g. in Table I, is that the latter is the measured electrical charge energy (1240.1 mWh g−1) including the overpotential (and thus
  ) while
  is the charge energy describing the thermodynamics of the system in equilibrium without any polarization effects (
 =1224.9 mWh g−1 or ≈384 kJ/mol). The electrochemical charge reaction (termed as "ECact" and marked in blue in Fig. 4) is followed by a chemical process (red), in which the LMR-NCM bulk structure is rearranged. In the scheme in Fig. 4a, this is visualized by the transition from the intermediate (gray) to the stable charged state (black). The structural modification happens during the upper voltage plateau and is most likely caused by a combination of irreversible processes (e.g., anionic redox, TM migration, and/or the loss of the honeycomb ordering), whereby the definitive mechanism is still under debate.
8,13,30
While we cannot make any statement on the mechanistic processes during activation, we are able to measure the heat release associated with these activation processes. The material conversion to the stable charged state thus explains the considerable heat generation observed during the upper voltage plateau in the first charge,
=1224.9 mWh g−1 or ≈384 kJ/mol). The electrochemical charge reaction (termed as "ECact" and marked in blue in Fig. 4) is followed by a chemical process (red), in which the LMR-NCM bulk structure is rearranged. In the scheme in Fig. 4a, this is visualized by the transition from the intermediate (gray) to the stable charged state (black). The structural modification happens during the upper voltage plateau and is most likely caused by a combination of irreversible processes (e.g., anionic redox, TM migration, and/or the loss of the honeycomb ordering), whereby the definitive mechanism is still under debate.
8,13,30
While we cannot make any statement on the mechanistic processes during activation, we are able to measure the heat release associated with these activation processes. The material conversion to the stable charged state thus explains the considerable heat generation observed during the upper voltage plateau in the first charge,  as indicated by the top red arrow in Fig. 4a. In other words, the
  generation observed is a measure of the enthalpy of reaction for the activation process (viz., ≈20 kJ/mol or ≈63.6 mWh g−1). Because of the irreversible structural rearrangements in the bulk of the material, the discharge occurs via a different pathway, which generates the electrical discharge energy,
  Note that here
  is the sum of
  and
and  because of the opposite sign of the polarization as compared to the charge direction. Thus
  equals ≈934 mWh g−1 or ≈293 kJ/mol. The electrochemical process is again followed by a chemical step, which generates the heat
  that is marked by the lower red arrow in Fig. 4a and that amounts to ≈12 kJ mol−1 (≈36.7 mWh g−1, corresponding to the
  fraction that is not due to
  see Table II).
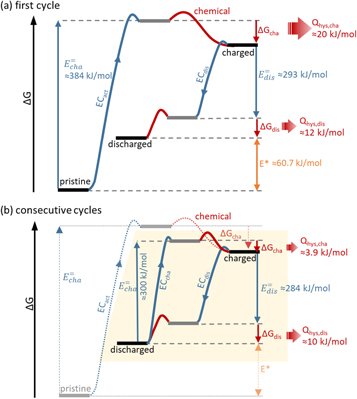
Figure 4. Scheme of the reaction energy landscape (not true to scale) excluding polarization losses for (a) the first cycle and (b) all consecutive cycles (region marked in yellow) of LMR-NCM/Li cells, with the data extracted from IMC measurements at C/10 and from intermittent cycling data at 25 °C. Blue lines indicate electrochemical processes (EC) with the conversion of the respective electrical energy ( ), and red lines indicate chemical processes with the respective chemical energy (
 ), which is evolved as heat (
 ). The heat terms calculated are based on the
  results discussed in the text. Black bars indicate stable energy levels (pristine/charged/discharged), and gray bars indicate intermediate states. Essential findings of the scheme are: (i) The first charge is an irreversible process, meaning that its energetic pathway in panel (a) is unique and can no longer be accessed once the material is activated, (ii) the difference between the first charge and discharge energy is explained by the conversion of electrochemical energy into heat (
 ) and by the energy loss (
 ) caused by the structural rearrangements during activation.
Download figure:
Standard image High-resolution imageAs one can see from Fig. 4a, an important finding is that, after the first cycle, the material has not returned to its initial state because of the irreversible processes that occurred during the first charge. As a result, the voltage curve is not a closed loop. Thus, from the electrochemical data alone, it cannot be determined how much energy is lost as heat during the first cycle. In contrast, for conventional active materials, the released heat is equal to the electrical energy lost during a reversible cycle with a closed voltage curve, and the CAM returns to its initial state after a complete cycle. There, the total lost heat per cycle can be calculated from the integration of the voltage curve. On the other hand, in the case of the first cycle of LMR-NCM, we observe that the electrical discharge energy  is significantly lower than the charge energy
  due to three main factors (note that the energy loss due to polarization are not included Fig. 4a): (i) the stabilizing chemical steps convert electrochemical energy into waste heat,
  during charge and discharge; (ii) the irreversible modifications during activation change the CAM in such a way that not all Li extracted during charge can be re-inserted during discharge (irreversible capacity loss); and (iii) these irreversible rearrangements lead to a lower discharge potential, even under OCV conditions, thereby lowering the discharge energy. By complementing electrochemical data with heat flow data from IMC, we determine
  and (i)
  which enables us to assess how much of the electrical energy is lost as a result of the irreversible rearrangements (ii + iii). Based on Table I, this energy loss term can be calculated by subtracting
  from
from  It is also accessible from Fig. 4a, where this energy is termed
  and results from the difference between
  and the sum of
 and
and  By definition, both approaches lead to the same result for
  ≈190.6 mWh g−1 (≈60.7 kJ mol−1), corresponding to 15% of the charge energy and accounting for 57% of the total energy loss. This energy was put into the system in the form of electrical energy upon charge but was neither lost as heat nor extracted as electrical energy during discharge. It is visualized as orange double arrow in Fig. 4. However, it cannot be determined what proportion of this energy loss
  is simply due to the loss of chemically available Li sites in the CAM (irreversible capacity loss) and to what extent
  corresponds to electrochemical energy that was consumed for the structural rearrangements of the LMR-NCM material during the first-charge activation process. What is reported here as
  is thus a measure of the lost electrical work not converted into heat that thus represents a maximum possible value for the electrochemical energy consumed for structural rearrangements. This energy term can be determined only by quantifying the other sources of energy loss by IMC. To the best of our knowledge, this is reported here for the first time.
Figure 4b illustrates the reaction energy landscape for the reversible cycles following the first cycle, as suggested by Assat et al.
21
The charge process occurs via a different pathway than during the first cycle, and the electrical charge energy  is less than during activation. Again, the redox step is followed by a stabilizing structural rearrangement. For the charge after activation, this chemical step generates significantly less heat,
  (≈3.9 kJ mol−1 or ≈12.5 Wh g−1, see Table II) than during the first cycle. The consecutive discharge is analogous to that observed during the first cycle, with the calculated
  value only slightly lower (≈10 kJ mol−1 or ≈31.4 Wh g−1, see Table II) than during the first cycle, because the SOC window has slightly decreased from the first to the third cycle. Because all consecutive cycles are reversible, the proposed reaction mechanism is now a closed loop (highlighted by the yellow area in Fig. 4b). Nevertheless, it is a hysteresis loop because of the path-dependence between the charge and discharge direction, thereby implying that (de-)lithiation occurs via metastable pathways. A more detailed discussion on the hysteresis phenomena in LMR-NCM during cycles other than the first activation cycle can be found in our previous entropy study
9
as well as in the IMC study by Assat et al.
21
A quantitative analysis of the corresponding
value only slightly lower (≈10 kJ mol−1 or ≈31.4 Wh g−1, see Table II) than during the first cycle, because the SOC window has slightly decreased from the first to the third cycle. Because all consecutive cycles are reversible, the proposed reaction mechanism is now a closed loop (highlighted by the yellow area in Fig. 4b). Nevertheless, it is a hysteresis loop because of the path-dependence between the charge and discharge direction, thereby implying that (de-)lithiation occurs via metastable pathways. A more detailed discussion on the hysteresis phenomena in LMR-NCM during cycles other than the first activation cycle can be found in our previous entropy study
9
as well as in the IMC study by Assat et al.
21
A quantitative analysis of the corresponding  heat terms for LMR-NCM/Li cells is reported in our previous publication.
20
The comparison of the reversible cycle and the first charge in Fig. 4b (dashed lines) further underlines that the first charge is a unique process, which irreversibly changes the LMR-NCM material and leads to a different energy landscape for the following cycles.
heat terms for LMR-NCM/Li cells is reported in our previous publication.
20
The comparison of the reversible cycle and the first charge in Fig. 4b (dashed lines) further underlines that the first charge is a unique process, which irreversibly changes the LMR-NCM material and leads to a different energy landscape for the following cycles.
Window-opening experiments
As described above in the context of Fig. 4, the first charge includes irreversible processes that occur during the upper voltage plateau and which release heat,  which can be observed at SOC>100 mAh g−1. In order to further analyze this heat generation during activation, charge window opening experiments were conducted. In these experiments, nominally identical cells were charged by intermittent cycling to different upper SOC limits and discharged to 2.0 V. Figure 5 shows the OCV curves resulting from intermittent cycling to the upper limits of 75 mAh g−1, 125 mAh g−1, 175 mAh g−1, and 225 mAh g−1 and compares them to a full cycle to the upper voltage cutoff of 4.8 V (≈290 mAh g−1). For each of these curves, a new cell was used so that for each SOC value a cell with a pristine LMR-NCM was used. For the first two cells which were charged only to SOC values that lie in the initial sloping region of the voltage curve, the charge and discharge OCV curves overlap and no hysteresis is observable, which is in agreement with the literature.
1,8
However, as soon as a cell is charged beyond ≈125 mAh g−1, where the upper voltage plateau starts, there is a path dependence between the charge and discharge OCV curves. The resulting hysteresis loop grows continuously with increasing upper voltage cutoff. Those intermediate scanning curves can provide valuable insight into the nature of the structural rearrangement and the corresponding energy barrier that lead to the hysteresis phenomena.
29
As long as the SOC window is restricted to the region below ≈125 mAh g−1, the LMR-NCM apparently shows a reversible behavior. However, as soon as the delithiation proceeds beyond this critical point, which is the beginning of the upper voltage plateau, the energy barriers can be overcome and the irreversible material transformation occurs. This causes the system to remain in the new stable state that persists even upon the relithiation of the LMR-NCM material. The gradual growth of the hysteresis loop observed for the OCV is also reported for other material properties, such as the cell resistance
5
and the partial molar entropy.
9
A similar observation was made for the lattice parameters of LMR-NCM, which also show a reversible behavior when the material is charged to an upper limit of ≈100 mAh g−1, while they exhibit a path dependence for a full activation cycle.
8
which can be observed at SOC>100 mAh g−1. In order to further analyze this heat generation during activation, charge window opening experiments were conducted. In these experiments, nominally identical cells were charged by intermittent cycling to different upper SOC limits and discharged to 2.0 V. Figure 5 shows the OCV curves resulting from intermittent cycling to the upper limits of 75 mAh g−1, 125 mAh g−1, 175 mAh g−1, and 225 mAh g−1 and compares them to a full cycle to the upper voltage cutoff of 4.8 V (≈290 mAh g−1). For each of these curves, a new cell was used so that for each SOC value a cell with a pristine LMR-NCM was used. For the first two cells which were charged only to SOC values that lie in the initial sloping region of the voltage curve, the charge and discharge OCV curves overlap and no hysteresis is observable, which is in agreement with the literature.
1,8
However, as soon as a cell is charged beyond ≈125 mAh g−1, where the upper voltage plateau starts, there is a path dependence between the charge and discharge OCV curves. The resulting hysteresis loop grows continuously with increasing upper voltage cutoff. Those intermediate scanning curves can provide valuable insight into the nature of the structural rearrangement and the corresponding energy barrier that lead to the hysteresis phenomena.
29
As long as the SOC window is restricted to the region below ≈125 mAh g−1, the LMR-NCM apparently shows a reversible behavior. However, as soon as the delithiation proceeds beyond this critical point, which is the beginning of the upper voltage plateau, the energy barriers can be overcome and the irreversible material transformation occurs. This causes the system to remain in the new stable state that persists even upon the relithiation of the LMR-NCM material. The gradual growth of the hysteresis loop observed for the OCV is also reported for other material properties, such as the cell resistance
5
and the partial molar entropy.
9
A similar observation was made for the lattice parameters of LMR-NCM, which also show a reversible behavior when the material is charged to an upper limit of ≈100 mAh g−1, while they exhibit a path dependence for a full activation cycle.
8
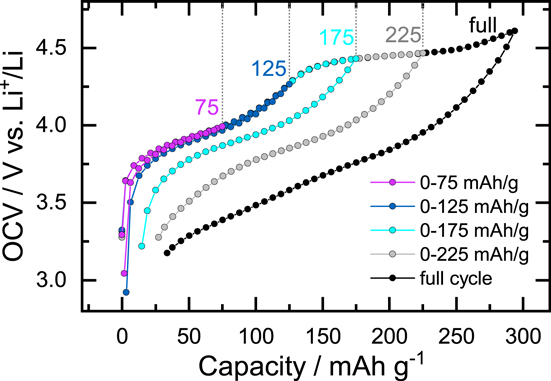
Figure 5. OCV curves of identical 0.33 LMR-NCM/Li cells during activation at C/10 collected during intermittent cycling to various upper SOC limits. During this window-opening experiment, the cells were charged to different upper SOC limits and discharged to 2.0 V with a 1 h rest phase every ΔSOC = 2.5%. The OCV values determined at the end of each rest phase are shown as function of the upper SOC limit with a color as indicated: (i) 75 mAh g−1 (pink), (ii) 125 mAh g−1 (dark blue), (iii) 175 mAh g−1 (light blue), and (iv) 225 mAh g−1 (grey). Data from a full cycle to the upper cutoff voltage of 4.8 V are shown in black (≈290 mAh g−1). Each of these five different experiments was conducted with a new cell, i.e., with pristine LMR-NCM.
Download figure:
Standard image High-resolution imageTo analyze whether the heat signal of LMR-NCM/Li cells behaves analogously, we conducted IMC measurements with nominally identical cells as used above. The new cells were charged at constant current to the upper SOC values of 75 mAh g−1, 125 mAh g−1, 175 mAh g−1, or 225 mAh g−1, followed by a 6 h rest phase and a discharge to 2.0 V (i.e., continuous and not intermittent cycling). Figure 6a shows the resulting IMC curves for these five cells together with the irreversible heat determined from intermittent cycling for the first charge to various upper charge limits (color gradient as indicated in the figure caption). Reference data for a full first cycle with charge to the cutoff voltage of 4.8 V (≈290 mAh g−1) are shown in black. As expected, the heat flow profiles of  (solid lines) and
  (symbols) during the first charge shown in Fig. 6a agree with the reference data set of the full charge, reflecting the good cell-to-cell reproducibility. The corresponding
  curves in Fig. 6c (i.e., the difference between
  and
and  in Fig. 6a) indicate that with increasing charge window, the generation of
  increases but that the onset and profile shape are independent of the SOC limit, as one would expect. The cells, which were charged to only 75 mAh g−1 did not show any
  generation.

Figure 6. Heat flow of 0.33 LMR-NCM/Li cells during constant-current activation at C/10. In this window-opening experiment, nominally identical cells were charged to different upper SOC limits and discharged to 2.0 V. The resulting heat profiles are colored as indicated for the upper SOC limits of (i) 75 mAh g−1 (pink), (ii) 125 mAh g−1 (dark blue), (iii) 175 mAh g−1 (light blue), and (iv) 225 mAh g−1 (grey). Data from a full cycle to an upper cutoff voltage of 4.8 V are shown in black (≈290 mAh g−1). Panels (a) and (b) show the heat flow measured by IMC ( solid lines) together with the irreversible heat flow determined by intermittent cycling (
 circles, calculated from the cells shown in Fig. 5) during charge and discharge. The generation of
  for charge and discharge is plotted in (c) and (d). The error bars for
  are calculated from the measurement of two identical cells.
Download figure:
Standard image High-resolution imageFigure 6b shows the heat generation curves for the discharge after charging the cells to the various SOC limits. The observed  signals for the cells charged to 75 mAh g−1 and 125 mAh g−1 are very close to their respective irreversible heat curves, indicating insignificant
  generation. In contrast, the cells that were charged to higher SOC values exhibit a growing difference between
  and
and  corresponding to an increasingly more pronounced
  generation. Apart from the growing
  value with increasing charge window, the onset of the steep increase in the
  curves also changes: this step-like feature is around ≈175 mAh g−1 for a cell after full activation and is observed at later points during discharge (i.e., at lower SOCs) for cells that were charged only to 225 mAh g−1 (onset at ≈120 mAh g−1) or 175 mAh g−1 (onset at ≈65 mAh g−1). Thus, the more the LMR-NCM material becomes "activated" during the first charge, the more and the earlier
  is generated in the consecutive discharge. This observation proves that the heat resulting from hysteresis, which is observed in the first and every other discharge, is a consequence of the activation processes during the first charge. In agreement with literature reports on the behavior of the cell resistance,
5
the partial molar entropy,
9
and the lattice parameters
8
of LMR-NCM, our IMC measurements suggest that the activation that occurs during the upper voltage plateau is a gradual process. The irreversible rearrangements become increasingly more complete, the more the cell is delithiated, resulting in an increasing
is generated in the consecutive discharge. This observation proves that the heat resulting from hysteresis, which is observed in the first and every other discharge, is a consequence of the activation processes during the first charge. In agreement with literature reports on the behavior of the cell resistance,
5
the partial molar entropy,
9
and the lattice parameters
8
of LMR-NCM, our IMC measurements suggest that the activation that occurs during the upper voltage plateau is a gradual process. The irreversible rearrangements become increasingly more complete, the more the cell is delithiated, resulting in an increasing  generation in both the charge and discharge direction. The critical point for this activation process is the onset of the upper voltage plateau at an SOC of ≈125 mAh g−1. The presence of intermediate scanning curves for all these bulk phenomena indicates that the structural rearrangement is not a sequential process that occurs via individual domains (e.g., first small LMR-NCM particles and then large ones) or from the surface to the center of the CAM particles, but rather that it is a continuous process within the entire bulk of the LMR-NCM material.
Effect of the degree of overlithiation on the heat generation
The degree of overlithiation (i.e., the amount of Li in the TM layer) influences the electrochemical performance of LMR-NCM but also plays an important role for the hysteresis phenomena. A higher degree of overlithiation leads to a higher theoretical capacity of the LMR-NCM material. 3 Figure 7 shows the voltage curves during the first constant-current cycle at C/10 for LMR-NCM/Li half-cells prepared with LMR-NCMs with various degrees of overlithiation, namely with 0.33 LMR-NCM (black), 0.42 LMR-NCM (blue), and 0.50 LMR-NCM (green). In agreement with the literature, 1,3 the charge capacity increases with increasing degree of overlithiation and reaches 289 mAh g−1 for 0.33 LMR-NCM, 322 mAh g−1 for 0.42 LMR-NCM, and 325 mAh g−1 for 0.50 LMR-NCM. Moreover, a longer activation plateau is observed for a higher degree of overlithiation, as was reported by Croy et al. and Teufl et al. 1,3 The charge energy of the first cycle thus increases with the degree of overlithiation: it is 1240 mWh g−1 for 0.33, 1401 mWh g−1 for 0.42, and 1427 mWh g−1 for 0.50 LMR-NCM. The first-cycle irreversible capacity loss shows no clear trend as a function of overlithiation, amounting to 40 mAh g−1 (≡86% first-cycle coulomb efficiency) for the 0.33, 29 mAh g−1 (≡91%) for the 0.42, and 57 mAh g−1 (≡82%) for the 0.50 LMR-NCM material. The first-cycle discharge energy is highest for the 0.42 LMR-NCM material (1048 mWh g−1), which shows the lowest irreversible capacity loss. For the 0.33 LMR-NCM, the first-cycle discharge energy is 907 mWh g−1, for the 0.50 LMR-NCM it is 949 mWh g−1. The electrical energy loss resulting from the difference between the charge and the discharge energy increases with increasing degree of overlithiation and is summarized in Table III. In agreement with the literature, 1,3 the hysteresis loop of the charge and discharge voltage increases with the degree of overlithiation. Moreover, for the same LMR-NCM types as used in this study, the variation of the lattice parameters as a function of SOC depends on the degree of overlithiation. 8 In a previous entropy study on 0.33 LMR-NCM and 0.50 LMR-NCM, we found that the partial molar entropy curves of LMR-NCM/Li cells differ when plotted as a function of SOC but agree when plotted as a function of OCV. We thus aim to analyze the different LMR-NCM materials by means of IMC in order to determine whether the heat generation is also influenced by the degree of overlithiation.
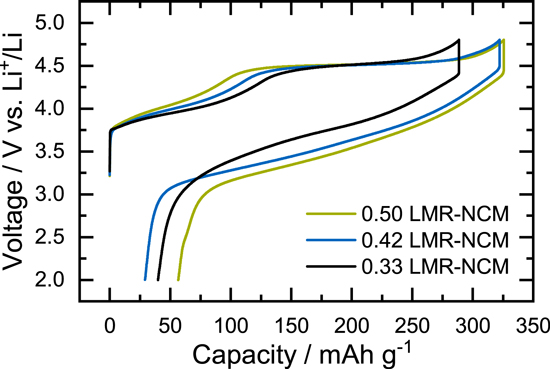
Figure 7. Voltage curves for the first constant-current cycle at C/10 for 0.33 LMR-NCM/Li (black), 0.42 LMR-NCM/Li (blue), and 0.50 LMR-NCM/Li cells at 25 °C.
Download figure:
Standard image High-resolution imageTable III. Measured and calculated energy losses for the first cycle of LMR-NCM/Li cells at C/10 and 25 °C with various degrees of overlithiation (0.33, 0.42, and 0.50 LMR-NCM as explained in the Experimental Electrode fabrication and battery assembly section). Electrical energy loss (Echa-Edis), total heat generation measured by IMC (QIMC,total), and the ratio total heat/electrical loss for the whole cycle are shown together with the integrated IMC signal and the determined heat resulting from hysteresis in charge and discharge. The latter are derived from C/10 intermittent cycling.
| LMR-NCM |
 [mWh g−1] [mWh g−1] |
 [mWh g−1] [mWh g−1] |
 [%] [%] |
 [mWh g−1] [mWh g−1] |
 [mWh g−1] [mWh g−1] |
 [mWh g−1] [mWh g−1] |
 [mWh g−1] [mWh g−1] |
|---|---|---|---|---|---|---|---|
| 0.33 | 333.6 | 143.0 | 43 | 78.8 | 63.6 | 64.2 | 36.7 |
| 0.42 | 353.3 | 183.9 | 52 | 106.7 | 91.5 | 77.3 | 56.5 |
| 0.50 | 478.4 | 211.4 | 44 | 129.5 | 111.9 | 211.4 | 60.9 |
Figure 8a and Fig. 8b show the first-cycle heat flow curves during charge and discharge measured by IMC ( solid lines) recorded at constant-current C/10 cycling as well as
  (symbols) determined from intermittent cycling at C/10 for LMR-NCM/Li half-cells with 0.33 LMR-NCM (black), 0.42 LMR-NCM (blue), and 0.50 LMR-NCM (green). Table III summarizes the integrated heat terms, including the consecutive rest phase of 1.5 h that is not shown in Fig. 8. For the first cycle, the heat measured by IMC,
  increases with increasing degree of overlithiation for both the charge and discharge direction, as does the electrical energy loss,
  (see Table III). The difference between the electrical energy loss and
  corresponds to the maximum energy for the irreversible rearrangement processes during LMR-NCM activation (i.e.,
  see discussion of Fig. 4a), amounting to ≈190.6 mWh g−1 (≈60.7 kJ/mol) for the 0.33 LMR-NCM, ≈169.4 mWh g−1 (≈54.0 kJ/mol) for the 0.42 LMR-NCM, and ≈267.0 mWh g−1 (≈85.0 kJ/mol) for the 0.50 LMR-NCM. While one might have expected increasing values of
  with increasing degree of overlithiation, this is not strictly followed, which is likely due to the large difference in the first-cycle coulomb efficiencies (highest for the 0.42 LMR-NCM, see above). The
  profiles during the first charge and discharge are shown in Fig. 8a and Fig. 8b, respectively. During the first charge, the
  curves (symbols) of the different CAMs agree until the cells reach their respective end of charge, where an increase in the cell polarization is observed. For example, for the 0.33 LMR-NCM/Li cells, the polarization within the cell increases starting at ≈275 mAh g−1. For the cells with 0.42 and 0.50 LMR-NCM, this feature occurs at higher SOCs because of the higher amount of available Li+. However, for the rest of the charge, the irreversible heat generation is fairly comparable for all CAMs. A similar trend is found for the discharge direction, where the
  curves of the different LMR-NCM/Li cells agree until the respective end of discharge is reached, where the polarization then begins to increase again. The
  signals shown in Fig. 8a (lines) indicate that with increasing degree of overlithiation, the overall heat generation increases, while the general profile shape is still comparable.

Figure 8. Heat flow measurements of LMR-NCM/Li cells at C/10 as a function of the degree of overlithiation of the LMR-NCM material: 0.33 LMR-NCM (black, same data as in Fig. 3), 0.42 LMR-NCM (blue), and 0.50 LMR-NCM (green). Panels (a) and (b) show the heat flow measured by IMC,  (solid lines) together with the irreversible heat flow determined by intermittent cycling,
  (circles) during the first charge and discharge. The generation of
  for charge and discharge is plotted in (c) and (d), with the solid lines corresponding to the
  generation during the first cycle, and the dashed lines to the third cycle.
Download figure:
Standard image High-resolution imageIn Fig. 8c, the generation of  is shown for the three different LMR-NCM materials, with the solid lines corresponding to the heat generation during the first charge and the dashed lines during the third charge. If we focus on the first cycle, the
  signals of the 0.33 and the 0.42 LMR-NCM are comparable for most of the first charge, the only difference being the onset and overall magnitude of the steep increase at the end of charge, which occurs at ≈265 mAh g−1 for the 0.33 LMR-NCM and at ≈292 mAh g−1 for the 0.42 LMR-NCM material. For the 0.50 LMR-NCM, the
  signal is generally higher over the whole SOC range, and its onset at ≈60 mAh g−1 is earlier than for the other two materials, which leads to the significantly increased
  value in Table III. The onset of the steep increase at the end of charge is at ≈300 mAh g−1 and therefore later than for the other two materials. Because we closely correlate the
  generation during the first charge with the irreversible structural rearrangements within the LMR-NCM, this calorimetric analysis suggests that for a higher degree of overlithiation, a more pronounced activation process is observed. This is in agreement with the higher amount of Li+ in the transition metal layer of LMR-NCMs with a high degree of overlithiation.
While, as discussed above, the  curves generally agree for the various materials (Fig. 8b), the
  profiles show clear differences. Because of their higher charge capacity (Fig. 7), the heat flow curves of the 0.42 and the 0.50 LMR-NCM start at a higher SOC. For the materials with a higher degree of overlithiation, the onset of the increase in
  is observed earlier during discharge (at higher SOCs). Moreover, while for the 0.33 LMR-NCM the
  signal (black) continuously increases after the onset around ≈175 mAh g−1, the
  value of the 0.42 LMR-NCM (blue) displays a saturation behavior. In case of the 0.50 LMR-NCM, the
  signal (green) even decreases at ≈75 mAh g−1 prior to the steep increase at the end of discharge. The resulting
  profiles are compared in Fig. 8d (solid lines for the first and dashed lines for the third cycle). For all materials,
  is generated over the whole SOC range, and all curve shapes can be roughly described by two plateaus connected by a step-like feature. The
  values during the first plateau at high SOC are fairly similar for all materials. However, the onset of the consecutive step-like feature is shifted to higher SOCs for a higher degree of overlithiation: for the 0.33 LMR-NCM, it is at ≈170 mAh g−1, for the 0.42 LMR-NCM at ≈225 mAh g−1, and for the 0.50 LMR-NCM at ≈240 mAh g−1. For a higher degree of overlithiation, the
  value in the second plateau is slightly higher. A remarkable difference between the
  profiles is that the curves of the 0.42 and the 0.50 LMR-NCM show a decreasing value towards the end of the respective discharge, just before the heat generation increases steeply at the end of the discharge. This dip is observed at ≈75 mAh g−1 for the 0.50 LMR-NCM and at ≈40 mAh g−1 for the 0.42 LMR-NCM, whereby it is more pronounced for the 0.50 LMR-NCM. A possible reason for this decreasing heat signal can be the occurrence of an endothermic processes, which, together with the exothermic processes (which were also present before), leads to a decrease in the net heat signal. Another possibility is the disappearance of an exothermic process at the respective SOC values. It cannot be clarified whether the absence of the dip in the heat flow profile of 0.33 LMR-NCM is a material specific property or due to the smaller effective SOC window. Further studies are necessary to address these questions.
In summary, it can be concluded that the heat flow resulting from hysteresis and activation,  differs when the degree of overlithiation is varied. In agreement with the earlier onset of the upper voltage plateau in Fig. 7, the onset and value of
  are shifted such that the total heat generation during the first charge increases with increasing degree of overlithiation. For the first discharge, the
  profile is also altered in such a way that the heat generated is higher for a higher degree of overlithiation. The fact that the onset of
  in charge and discharge direction is observed earlier within the half-cycle indicates that the underlying structural rearrangements start earlier and thus last longer the higher the degree of overlithiation.
In Fig. 8c and Fig. 8d, the  generation during the first (solid lines) and the third cycle (dashed lines) are compared. It was obtained by subtracting the irreversible heat determined by intermittent cycling from
  for the third cycle (raw data not shown here). Table IV furthermore summarizes the integrated heat generation and the electrical energy loss terms for the different LMR-NCM materials in the third cycle at C/10. With increasing degree of overlithiation, the loss of electrical energy and with it the waste heat increases. Thus, 91%–97% of the expected heat are measured by the applied method. A comparison with Table III underlines that the heat generation during the third cycle is considerably less than during the first cycle for all materials. For the heat flow profiles during charge (Fig. 8c), a mismatch between
  of the first and the third cycle is clearly observable for all materials, which is in agreement with the analysis of the 0.33 LMR-NCM material in Fig. 3. Compared with the first cycle (see Table III), the heat resulting from hysteresis is considerably less during the third cycle, but still shows an increasing trend with increasing degree of overlithiation. The
  profiles in the third cycle are quite similar for the various CAMs. All curves show no significant
  generation until an SOC of ≈200 mAh g−1 is reached, but the maximum value is higher for a higher degree of overlithiation. The
  curves of the third and the first cycle shown in Fig. 8d agree for each type of LMR-NCM. However, for the 0.42 and 0.50 LMR-NCM, the values of
  are slightly lower than that observed during the first discharge. In general, the same trend as for the 0.33 LMR-NCM is also observed for the CAMs with a higher degree of overlithiation: while the heat generation during the first and the third charge are significantly different in shape and total integral, the first discharge is similar to the consecutive ones.
Table IV. Measured and calculated energy losses for the third cycle of LMR-NCM/Li cells at C/10 and 25 °C for LMR-NCMs with various degrees of overlithiation (0.33, 0.42, and 0.50 LMR-NCM as explained in the Experimental Electrode fabrication and battery assembly section). Electrical energy loss, total heat generation measured by IMC, and the ratio total heat/electrical loss for the whole cycle are shown together with the integrated IMC signal and the determined heat resulting from hysteresis in charge and discharge.
| LMR-NCM |
 [mWh g−1] [mWh g−1] |
 [mWh g−1] [mWh g−1] |
 [%] [%] |
 [mWh g−1] [mWh g−1] |
 [mWh g−1] [mWh g−1] |
 [mWh g−1] [mWh g−1] |
 [mWh g−1] [mWh g−1] |
|---|---|---|---|---|---|---|---|
| 0.33 | 94.1 | 87.7 | 93 | 28.7 | 12.3 | 59.0 | 31.3 |
| 0.42 | 119.8 | 109.3 | 91 | 43.4 | 29.1 | 65.9 | 45.0 |
| 0.50 | 123.2 | 119.8 | 97 | 55.4 | 41.7 | 64.4 | 44.5 |
Estimate of the magnitude of other sources of heat during the first cycle activation
As was briefly outlined in the Experimental section, the general heat balance shown in Eq. 2 was simplified in the present study by neglecting the reversible and parasitic heat, leading to Eq. 3. We now discuss why this simplification is reasonable and first focus on the parasitic heat. Parasitic heat refers to all heat sources from processes other than regular intercalation, which can include any side reactions, such as electrolyte decomposition 17–19 or SEI formation. 22 These processes can happen during cycling but also open-circuit conditions, where they might lead to self-discharge. The Dahn group has published several studies investigating parasitic reactions and the corresponding heat generation. 17–19 By combining high precision coulometry and IMC, they are able to analyze the parasitic heat flow in pouch full-cells with nominal capacities over 200 mAh. In our present study, we used coin cells with a nominal capacity of ≈4 mAh and a custom-made coin cell holder for the IMC experiments. We therefore do not meet the required accuracy and signal-to-noise ratio necessary to reliably measure small heat flows such as parasitic heat. Nevertheless, we tried to estimate the contribution of the Li counter-electrode to the observed heat flow profiles of LMR-NCM/Li cells. For this purpose, we used symmetrical Li/Li coin cells with the same separator and electrolyte as in the half-cells. The Li/Li cells were cycled inside the IMC with the same current density as used in the LMR-NCM/Li cells. Moreover, a time limit was used, so that the exchanged capacity is equal to that of the LMR-NCM/Li cells. The heat flow observed from the Li/Li cells thus enables us to estimate the thermal effect of Li plating and stripping during cycling. However, because the polarization in this Li/Li cell is much lower than in the actual cells, these experiments cannot elucidate the effect of electrolyte oxidation at high potentials (e.g., at the end of the charge). The heat balance of the Li/Li cells is as follows:

The indices "ox" and "red" indicate the oxidation and reduction reaction of Li, which occur simultaneously in the symmetrical cells. If we assume that the entropy of Li plating and stripping is the same and that only the sign is opposite, the contribution of  is cancelled out in Eq. 4. Moreover, the irreversible heat can directly be determined from the potential of the Li/Li cell. Any difference from its ideal equilibrium value of zero is ascribed to overpotential of the cell, hence
  Because no reference electrode is used in this setup, we can monitor only the sum of both
  terms.
  can thus be calculated by subtracting
  from the total heat flow
  In order to transfer the calculated parasitic heat to the LMR-NCM/Li half-cell, the value obtained (data not shown) needs to be halved because only one Li electrode is present in the actual cell. The resulting values for
  are between ≈5-10 μW, corresponding to ≈0.3–0.6 mW g−1 when referenced to the LMR-NCM mass in the LMR-NCM/Li hall-cells. They are relatively constant over most of the SOC range and only increase slightly towards the lower and upper limit, presumably because of enhanced Li plating and stripping at high and low SOCs. In comparison, the overall heat flow signals measured for the LMR-NCM/Li cells during charge are between ≈5–25 mW g−1 at SOCs > 125 mAh g−1 and between ≈1–3 mW g−1 at the beginning of charge (see data for the first cycle in Fig. 8). The effect of the parasitic heat from Li on the analysis of
  which is generated starting at ≈100 mAh g−1, is thus negligible. If
  is included in the integration of
  (in mWh g−1), a relative error of ≈5% is observed for the charge direction and ≈7% for the discharge direction. For the heat flux, it is mostly dominant at the end of charge and at lower SOCs during discharge. Nevertheless, since the heat flow profile of
  is rather constant, it does not affect the analysis of the
  generation with regard to onset and curve features. We can conclude that the reported
  values to some extent include the parasitic heat resulting from Li plating and stripping and thus tend to overestimate the heat resulting from OCV hysteresis and activation. We were unfortunately unable to quantify the contribution of other parasitic reactions such as electrolyte oxidation at high potentials: after the cells were charged to 4.8 V, the heat signal showed a rather slow decay and did not approach zero even after 6 h of relaxation at open-circuit conditions, clearly indicating that parasitic processes are taking place at high potentials. Further studies are required to analyze these processes and quantify the corresponding heat terms in order to exactly determine the value of
  The unknown parasitic heat from electrolyte oxidation thus impacts the accuracy of the analysis of
  especially at high potentials. Moreover, since the average charge voltage during the first charge is significantly above that during the third cycle, the contribution from electrolyte oxidation to the total heat evolution is expected to be more pronounced during the first charge. This needs to be kept in mind when comparing the heat evolved during the first and the third charge. The same is true for the comparison of the LMR-NCM materials with different degrees of overlithiation. Since the average charge voltage is higher the more the material is overlithiated, potentially also the electrolyte oxidation is more pronounced leading to more parasitic heat evolution.
The second term that was omitted from Eq. 2 is the reversible heat due to entropy changes of the cathode and anode as a result of the (de-)lithiation during cycling. According to Eq. 2, the reversible heat is calculated based on the variation of the OCV with temperature,  the temperature, and the applied current. From potentiometric entropy measurements (see Experimental Determination of reversible heat section),
  was determined for LMR-NCM/Li cells during the first cycle. The resulting entropy curves are discussed elsewhere,
9
and the calculated theoretical reversible heat flow,
was determined for LMR-NCM/Li cells during the first cycle. The resulting entropy curves are discussed elsewhere,
9
and the calculated theoretical reversible heat flow,  is shown as green triangles in Fig. 9 together with the heat observed by IMC,
  (black) and the irreversible heat flow determined by intermittent cycling,
  (blue circles). Figure 9a shows that
  is endothermic for the charge direction and is especially pronounced at the beginning of charge at SOC < 25 mAh g−1. For the first discharge (Fig. 9b), the sign of
  is opposite because of the changed current direction. Our previous publication on the partial molar entropy in LMR-NCM investigated the entropy during activation and showed that the entropy curve during the first charge is unique and deviates significantly from those of the following charge half-cycles but also from that of the first discharge.
9
This mismatch between the charge and discharge entropy curves observed provides clear evidence for irreversible processes that happen during the first cycle and lead to entropy production in the material. This is in agreement with the aforementioned irreversible structural rearrangements in the bulk of the LMR-NCM material, which ultimately lead to the generation of
is opposite because of the changed current direction. Our previous publication on the partial molar entropy in LMR-NCM investigated the entropy during activation and showed that the entropy curve during the first charge is unique and deviates significantly from those of the following charge half-cycles but also from that of the first discharge.
9
This mismatch between the charge and discharge entropy curves observed provides clear evidence for irreversible processes that happen during the first cycle and lead to entropy production in the material. This is in agreement with the aforementioned irreversible structural rearrangements in the bulk of the LMR-NCM material, which ultimately lead to the generation of  The theoretical reversible heat that is calculated from the entropy data,
  thus includes an unknown proportion from entropy production and is not equal to the classical reversible heat,
  This is why we clearly differentiate between the calculated value,
  and the true reversible heat,
  which cannot be determined by electrochemical measurements. What we calculate as the theoretical reversible heat is the sum of the true reversible heat and entropy production. This is in accordance with the discussion on the contribution of the reversible heat during regular cycling of LMR-NCM in our previous IMC study.
20
which cannot be determined by electrochemical measurements. What we calculate as the theoretical reversible heat is the sum of the true reversible heat and entropy production. This is in accordance with the discussion on the contribution of the reversible heat during regular cycling of LMR-NCM in our previous IMC study.
20

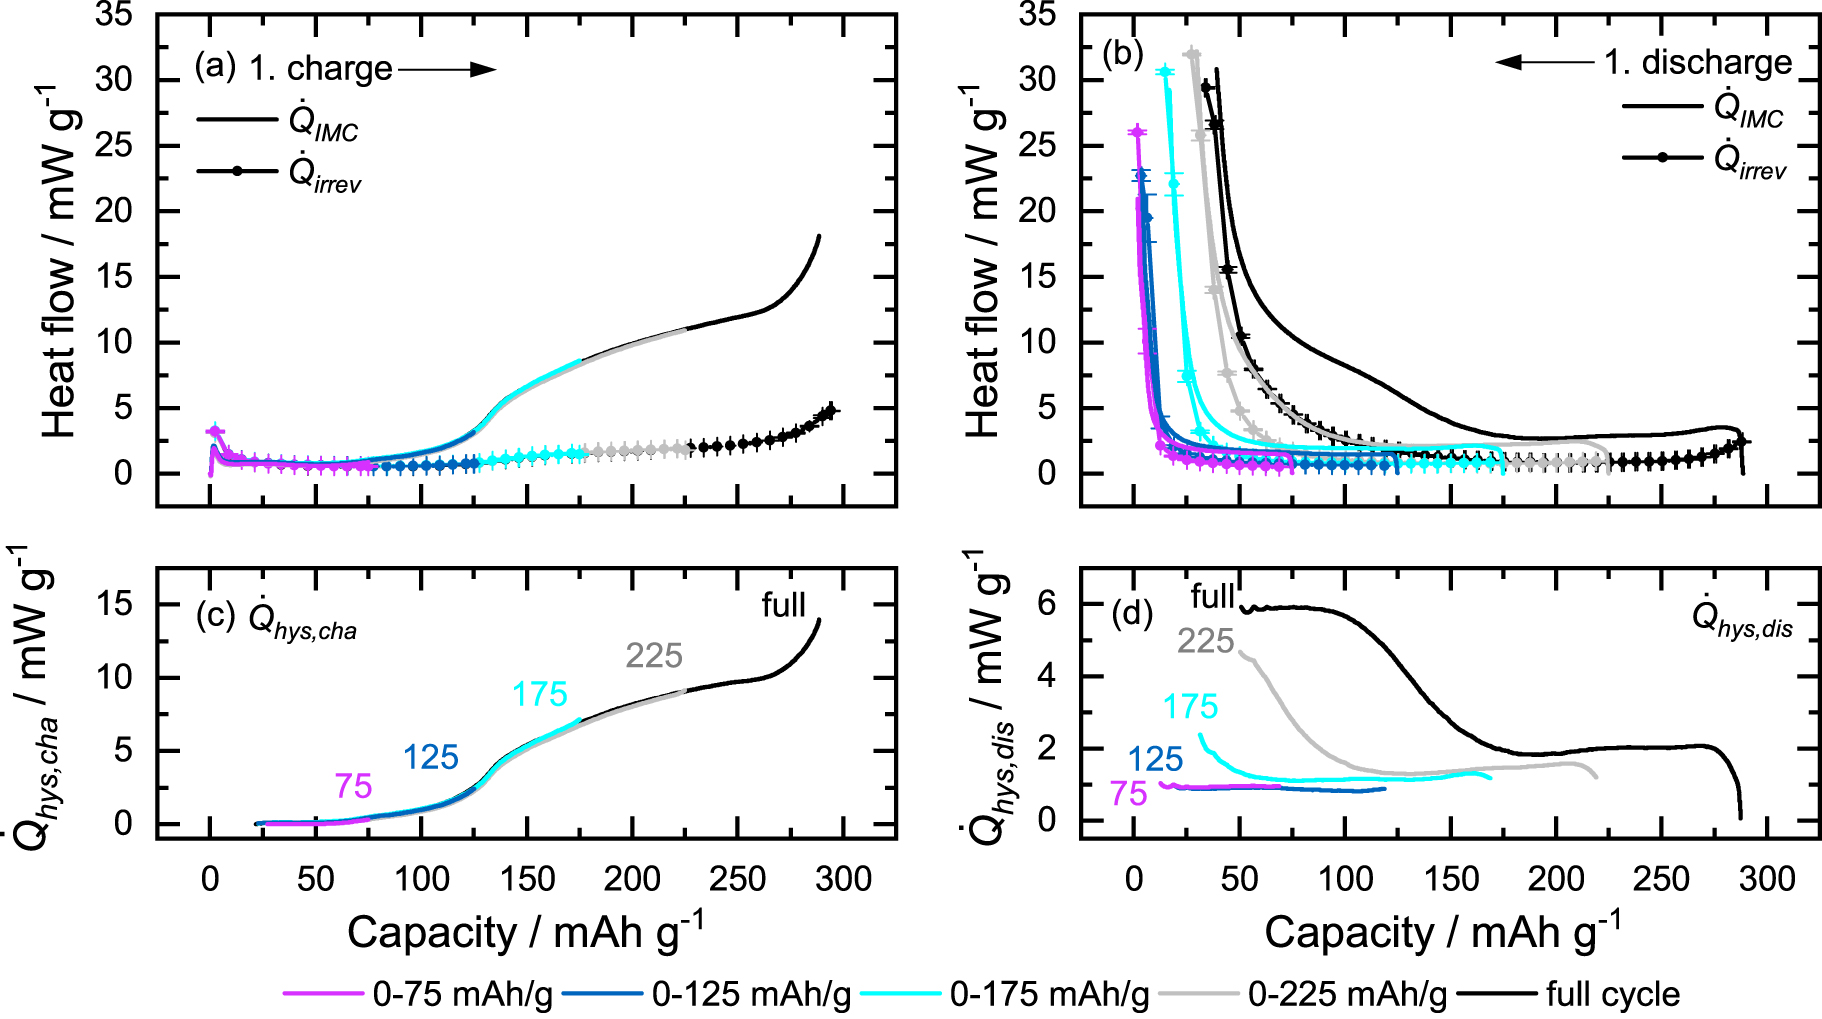
Figure 9. Heat generation of a 0.33 LMR-NCM/Li cell during activation at C/10 in the (a) charge and (b) discharge direction. The heat flow measured by IMC,  (solid black lines) is shown together with the irreversible heat flow determined by intermittent cycling,
  (blue circles), the theoretical reversible heat,
  calculated from entropy measurements (green triangles), and the sum of
  and
and  (orange line). The colored areas correspond to the difference between
  and the sum of
  and
and  The error bars for
  are calculated from the measurement of two identical cells. The error of
  is based on the calculation of the OCV variation with temperature.
9
A dashed gray line indicates the zero y-axis.
is based on the calculation of the OCV variation with temperature.
9
A dashed gray line indicates the zero y-axis.
Download figure:
Standard image High-resolution image
To assess the importance of the reversible heat for the investigation of  the following analysis is helpful. The observed total heat flow,
  is first compared to the sum of the theoretical reversible heat and the irreversible heat,
  +
+ (orange line in Fig. 9) as suggested by the general energy balance model in Eq. 2 (but neglecting the parasitic heat). In a second approach,
  is only compared to
  as was done in the present study and Eq. 3. In the first case,
  This is shown as the colored area in Fig. 9 (red during charge, blue during discharge). In the second case,
  is calculated based on Eq. 3:
  The heat resulting from OCV hysteresis and activation is shown as a colored area in Fig. 3. A comparison of both equations and Fig. 3 and Fig. 9 makes it clear that with approach (i) the contribution of the reversible heat is overestimated, because it includes entropy production, which is not necessarily generated as heat, and thus leads to an overestimation of
  in charge and an underestimation during discharge. In contrast, the second approach neglects
  and thus underestimates
  during charge and overestimates it during discharge. Here,
  conclusively includes an unknown proportion of the true reversible heat. In summary, neither of the two analysis approaches reflects the exact result of
However, by comparing the observed heat  to both calculated expectation values, we can assess how important the effect of the reversible heat is for the analysis of
  For this, it is helpful to focus on an SOC region in which the generation of
  is expected to be minimal. Any difference between
  and
and  is then predominantly caused by the reversible heat. From the window-opening experiments presented in Fig. 5, we know that in the low SOC region (<100 mAh g−1) during charge no OCV hysteresis is observed and that the contribution of
  is thus minimal. When applying calculation approach (i), the expected heat flow is the sum of
  and
and  which is depicted as an orange line in Fig. 9a. Because of the relatively large endothermic contribution of
  the expected heat flow is also endothermic below an SOC of ≈125 mAh g−1. A comparison with the observed heat (black line) shows a clear mismatch. Thus, based on this analysis,
  would give a considerable contribution in this low SOC region (red shaded area in Fig. 9a) to compensate for the endothermic heat flow calculated. However, from the OCV curves in Fig. 5, no evidence for an OCV hysteresis can be found because the LMR-NCM/Li cells cycle reversibly in the SOC window below 125 mAh g−1. In contrast, when comparing the observed heat flow in Fig. 9a only to the irreversible heat (blue circles), a reasonably good agreement is found for the low SOC region. This means that no significant
  generation is expected below 100 mAh g−1 with this analysis approach, which agrees with the OCV curves from Fig. 5. In conclusion, for the low SOC range (<100 mAh g−1) during charge, the contribution of the reversible heat can be neglected. According to the entropy measurements, this coincides with the region in which the largest
  values are determined (≈2.4 mW g−1 at the beginning of charge). For the rest of the charge,
  is only around ≈1 mW g−1. T−1h−1u−1s−1, although we cannot exclude the contribution of the reversible heat for SOCs above 100 mAh g−1 during charge, we can assume that the relative error resulting from neglecting the reversible heat is low for two reasons: First, the effect of
  was found to be negligible in the low SOC region during charge even though the highest values of
  are observed there. Its effect at higher SOCs is thus assumed to be insignificant. Second, at SOC > 125 mAh g−1, the relative effect of
  is small compared with the large
  generation. If only the
  generation during the first charge above 125 mAh g−1 is considered, the relative error between the two calculation methods is ≈13%. For the first discharge, the relative error for the calculation of the integrated
  amounts to ≈24%. Figure 9b shows that the general trend of the
  evolution (=difference between
  in black and
  in blue) is not changed when
  is considered (=difference between
  in black and
  in orange).
In summary, we want to emphasize that the simplifications used in the present study mean that the reported  includes an unknown but small contribution of reversible heat as well as heat from parasitic side reactions such as Li plating/stripping and electrolyte oxidation. Using the entropy data and results from a Li/Li IMC measurement, the maximum possible error for the reversible heat and the parasitic heat resulting from Li plating and stripping was estimated. This analysis aims to semi-quantitatively describe the onset, generation, and integral of
  during the activation of LMR-NCM. For a more accurate quantitative analysis, further experiments are required.
Conclusions
The first cycle of LMR-NCM is governed by unique, irreversible processes, which occur during the upper voltage plateau during charging. These irreversible structural rearrangements lead to a pronounced voltage hysteresis in the first cycle. This involves a substantial loss of voltage and capacity in the first discharge and leads to a very low energy efficiency of ≈73% over the first charge/discharge cycle, determined for an LMR-NCM material with a degree of overlithiation of δ = 0.14 in the notation Li1+δ [TM]1-δ O2, referred to as 0.33 LMR-NCM (based on the notation x Li2MnO3 • (1-x) LiTMO2).
In this study, the heat generation of LMR-NCM during the first activation cycle was studied by isothermal micro-calorimetry. For this purpose, LMR-NCM/Li half-cells were cycled with constant current inside an isothermal micro-calorimeter and the heat flow was measured in operando ( ). The calorimeter data were complemented with electrochemical measurements, from which the reversible and irreversible heat of LMR-NCM/Li cells was calculated. Using an intermittent cycling procedure, the irreversible heat generation resulting from polarization effects was determined (
 ). The contributions from reversible heat and parasitic heat from Li plating/stripping are negligible with respect to the relatively large heat generation during the first cycle. They were therefore neglected in the energy balance model.
In this study, three types of LMR-NCMs are examined which differ by the degree of overlithiation while the focus is on the 0.33 LMR-NCM material. For the latter, we found that only ≈43% of the electrical work lost during the first cycle is converted into heat. During the first charge, only 19% of this total heat is caused by the irreversible heat due to polarization effects. The observed mismatch between the two heat terms is caused by heat resulting from activation processes and hysteresis, which we termed  The onset of this heat evolution coincides with the beginning of the upper voltage plateau (≈100 mAh g−1) and is therefore directly related to the irreversible structural rearrangements during activation. Window-opening experiments, in which the upper SOC limit is gradually increased, indicate that when LMR-NCM is not cycled beyond this SOC, there is no evolution of
  during charge and discharge. This agrees with the absence of an OCV hysteresis in this limited SOC region and also with the absence of a path dependence reported for other parameters such as the cathode resistance,
5
lattice parameters,
8
and entropy.
9
In contrast, when LMR-NCM is charged beyond ≈100 mAh g−1, a path dependence of all these parameters gradually arises. We show that this is also true for the heat generation. This again underlines the correlation between the reported structural rearrangements during the upper voltage plateau and the heat generation observed. Moreover, the window-opening experiments indicate that the generation of
during charge and discharge. This agrees with the absence of an OCV hysteresis in this limited SOC region and also with the absence of a path dependence reported for other parameters such as the cathode resistance,
5
lattice parameters,
8
and entropy.
9
In contrast, when LMR-NCM is charged beyond ≈100 mAh g−1, a path dependence of all these parameters gradually arises. We show that this is also true for the heat generation. This again underlines the correlation between the reported structural rearrangements during the upper voltage plateau and the heat generation observed. Moreover, the window-opening experiments indicate that the generation of  in the first discharge is linked to the preceding
  evolution during charge and is thus a direct consequence of the activation processes.
By complementing the integrated total heat signal,  , with the electrical energy loss expected from the electrochemical data,
  , we can quantify how much of the electrical charge energy is neither converted into heat nor accessible as electrical energy during discharge. To our knowledge, this energy value, which we term
  is reported here for the first time.
  amounts to ≈190 mWh g−1, which corresponds to 15% of the charge energy and 57% of the total electrochemical energy loss. This is a measure of the electrical energy that is consumed for structural rearrangements during the first-charge activation of LMR-NCM. However, it represents a maximum value since it is not possible to determine which proportion of it is simply due to the loss of chemically available Li sites.
We then analyzed the effect of the degree of overlithiation on the heat generation of LMR-NCM. The electrical energy loss during the first cycle and the generation of heat resulting from activation and hysteresis,  increase with an increasing amount of Li in the TM layer. This is in agreement with the prolonged upper voltage plateau observed and indicates that the activation processes are more pronounced for a higher degree of overlithiation. For the energy that is lost as a result of structural rearrangements,
  we found no clear correlation to the degree of overlithiation but rather to the coulombic efficiency during the first cycle.
In summary, we demonstrate by IMC that the heat generation during the first charge of LMR-NCM shows a unique profile. This is dominated by heat resulting from activation processes during the upper voltage plateau. Because of the irreversibility of the first cycle, the electrical energy loss, which is easily accessible from electrochemical data, does not translate into an expected value for the generation of waste heat. IMC is thus an irreplaceable tool for quantifying the heat generation of LMR-NCM. The heat observed is a measure of the enthalpy of the structural rearrangements during activation. Further research effort is required to accurately determine parasitic heat flow (e.g. because of electrolyte decomposition) in order to obtain an exact value for the enthalpy of LMR-NCM activation. A combination of IMC and theoretical calculations may open new doors in the understanding of the structural and/or energetic processes that cause the activation of LMR-NCM during the first charge.
Acknowledgments
We would like to acknowledge BASF SE for the support within its Scientific Network on Electrochemistry and Batteries. This work was financially supported by the German Federal Ministry of Education and Research (BMBF) within the AQua HysKaDi project (grant no. 03XP0312B). We gratefully thank Alexander Hoefling for sharing his experiences in setting up an IMC.