

Abstract
Cryogenic environments are increasingly used in scientific and industrial fields. Recently, cryogenic environments are also used for storage and supply of liquid hydrogen, which is considered essential for the realization of a decarbonized society. Actuators to drive a valve that controls such a low-temperature fluid are required. In this study, a piezoelectric transducer that can be driven in the cryogenic environment has been fabricated and evaluated. Although the performance of piezoelectric elements degrades at cryogenic temperatures in general, the application of a preload can suppress the degradation of performance. Equivalent circuits were used for evaluation, and force factors and figures of merit were compared. As a result, the force factor was as high as that at RT even at cryogenic temperatures, and a high figure of merit was obtained. The result indicates that the transducer can be used for the driving of micro actuator at cryogenic temperature.
Export citation and abstract BibTeX RIS
1. Introduction
The cryogenic environment is in the range of 0.3–20 K. In such environment, quantum mechanical effects are prominent in various phenomena in addition to suppression of thermal noise and reduction of reaction rates. 1–7) Therefore, such environments are increasingly used in the fields of advanced technology industry, space industry, and so on. 8–10) The analysis technique of NMR is used to observe the phenomena caused by quantum mechanical effects. 11) The phenomenon of superconductivity is also used in linear motor trains, and space telescopes, etc. 12,13)
Liquid hydrogen, which has been the focus of much attention recently, can be efficiently converted, stored, and utilized. Thus, it is essential for realizing a decarbonized society as an alternative energy source. 14–16) The boiling temperature of liquid hydrogen is 20 K, requiring cryogenic systems and advanced insulation technology. To control cryogenic fluids in industrial field, including hydrogen systems, valves with long operating rods leading out of the equipment have been used. 17) This type of valve has a large volume because the actuator is located in the RT section. Therefore, a micro actuator that can drive the valve at cryogenic temperatures is required.
Some micro or small actuators that can be driven in cryogenic environments are studied. 18–20) Electromagnetic actuators have the advantage of high torque. However, they have the disadvantage of generating magnetic noise and imparting heat to low-temperature fluids. As for the use in wide range of environmental condition, many studies have been reported on micro piezoelectric actuators including ultrasonic transducers. 21–24) Piezoelectric actuators have the advantages of easy miniaturization and large volumetric output ratio. 25–28) The disadvantage is that the piezoelectric performance degrades as the temperature decreases, causing a reduction in vibration performance. The method of applying a preload is known to maximize the performance of piezoelectric elements. 29,30) A typical transducer using preload application is the bolt-clamped Langevin type transducer. 31–33) The transducer uses bolts and some metal plates to clamp the piezoelectric element. When a bolt is clamped, preload is applied to the piezoelectric element at the optimum torque using a torque wrench. Even in cryogenic environments, applying a preload to the piezoelectric element can prevent performance degradation. However, the use of bolts has the disadvantage that the size and the shape of the entire transducer are dependent on the bolts. In previous studies, a method of applying a preload to a piezoelectric element using the difference in thermal contraction of two metals with different thermal expansion coefficients was proposed. 34,35) Transducers with the preload mechanism were fabricated and evaluated.
In this study, the performance of the transducer without using bolt-clamping is evaluated by using an equivalent circuit.
2. Structure and principle
2.1. Preload application method
The mechanism of preload application is shown in Fig. 1. External metal shrinks thermally as the temperature decreases. The internal metals shrink in the same way. In this case, if the thermal expansion coefficient of the internal metals is smaller than that of the external metal, the amount of shrinkage of the internal metal will be smaller. This difference in thermal contraction between the external and internal metals applies a preload to the piezoelectric element.
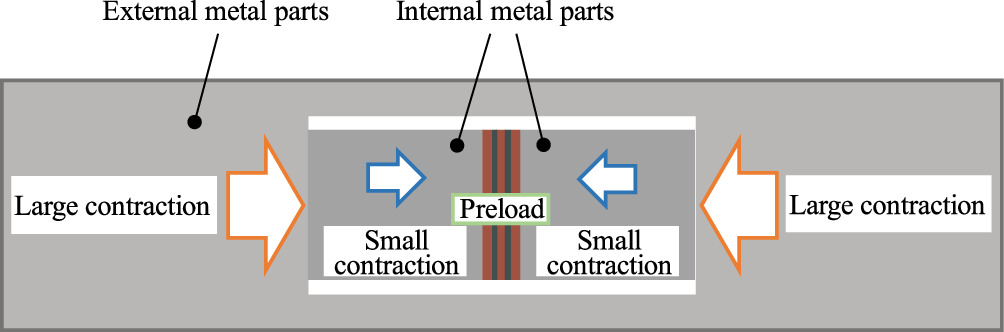
Fig. 1. Mechanism for applying preload to piezoelectric elements by using the difference of thermal expansion coefficients.
Download figure:
Standard image High-resolution image2.2. Structure of the transducer
Structure of the transducer is shown in Fig. 2. This transducer is a longitudinal vibrator that uses vibration in the thickness direction of the piezoelectric element. The transducer consists of a body made of SUS304, inner parts made of 42 invar, nickel alloy, electrode plates made of cupper, and piezoelectric elements made of lead zirconate titanate, PZT (Fuji Ceramics Company, Ltd., C-213). The 42 invar has a lower thermal expansion coefficient than SUS304. Thus, preload can be applied to the PZT due to this difference in thermal contraction. 36–38)
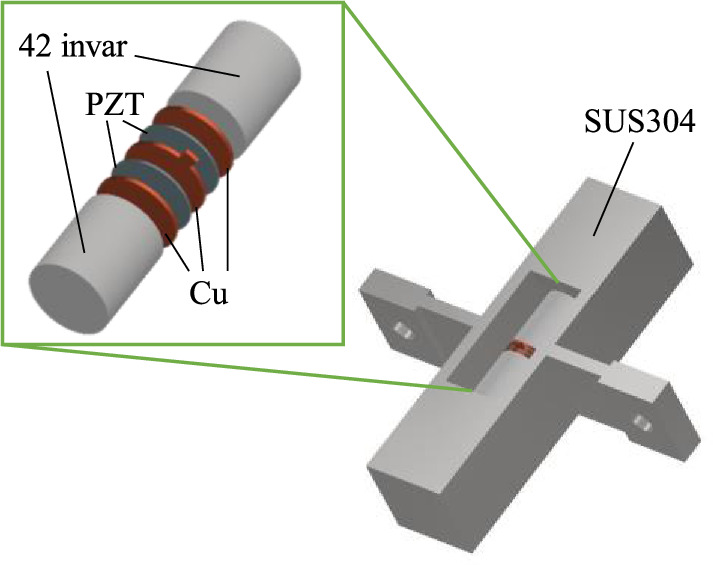
Fig. 2. Structure of the transducer for cryogenic condition without bolt-clamping mechanism.
Download figure:
Standard image High-resolution image2.3. Finite element method (FEM)
By using a FEM, static structural analysis was conducted to estimate the von-Mises stress applied to the piezoelectric element due to thermal contraction of the parts caused by the temperature decrease. The linear expansion coefficients of the materials used in the analysis 36–38) and the static structural analysis result is shown in Figs. 3, 4. In Fig. 4, the relationship between stress and temperature converged to a specific value when several analytical mesh densities of the piezoelectric element were considered. Therefore, the analytical results are shown when the number of divisions in the thickness direction is 4, which is the smallest analytical mesh density among those considered. Figure 4(b) shows the averaged von-Mises stresses on the top surface of piezoelectric element. It also shows that the preload increased with decreasing temperature, reaching a maximum at 45 K.
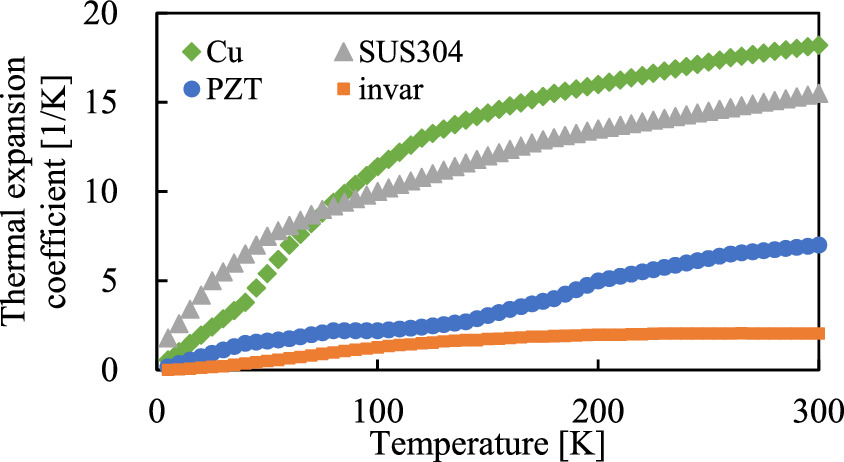
Fig. 3. Relationship between temperature and the thermal expansion coefficient of the materials used in the analysis.
Download figure:
Standard image High-resolution image
Fig. 4. Static structural analysis result about pressure; (a) Static structural analysis result when the temperature was 4.5 K, (b) Relationship between the average value of von-Mises stress applied to the piezoelectric element and temperature.
Download figure:
Standard image High-resolution imageNext, modal analysis was conducted to obtain the resonance frequencies in the longitudinal vibration mode of the transducer. The modal analysis result is shown in Fig. 5. The result shows that the resonance frequency at RT, 295 K and 4.5 K are 49.0 kHz and is 48.9 kHz.
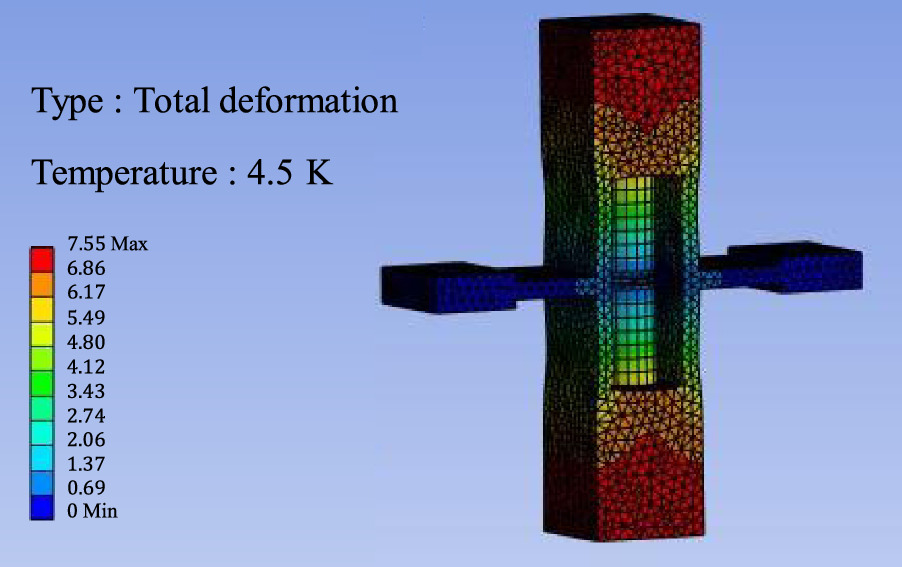
Fig. 5. Modal analysis result about transducer.
Download figure:
Standard image High-resolution image3. Experimental method
The fabricated transducer and the experimental set-up are shown in Figs. 6, 7. The transducer body in Fig. 6 has a hole in the center. The internal parts consisting of two 42 invar blocks, two PZT elements, and three Cu electrodes are inserted into this hole and assembled. The lengths of the 42 invar block, Cu electrode, and PZT element are 7 mm, 0.3 mm, and 0.2 mm, respectively, and the diameter is 6 mm. The total length of the internal part is equal to the length of the hole in the transducer body. The internal part was assembled into the hole by press-fitting using a jig. Gas cell compatible cryogenic measurement system (Pascal, GC-205-04) is used to realize a cryogenic environment. The system consists of a cryostat, a helium gas compressor, and a vacuum puller. The cryostat is composed of a shroud and a gas cell. The transducer is fixed to a gas cell, and the gas cell is filled with helium gas to enable measurement in cryogenic environments. The heater inside the cryostat allows the temperature to be maintained in the range from RT to 4.2 K. Wires connected to the transducer inside the cryostat exit from the cryostat, and the admittance is measured by connecting the frequency response analyzer (NF Corporation, FRA5095) to the wires. A laser beam can be irradiated onto the end surface of the transducer through an optical window of the cryostat. The vibration velocity is measured by a laser Doppler vibrometer (Polytech, OFV-303/OFV3001).
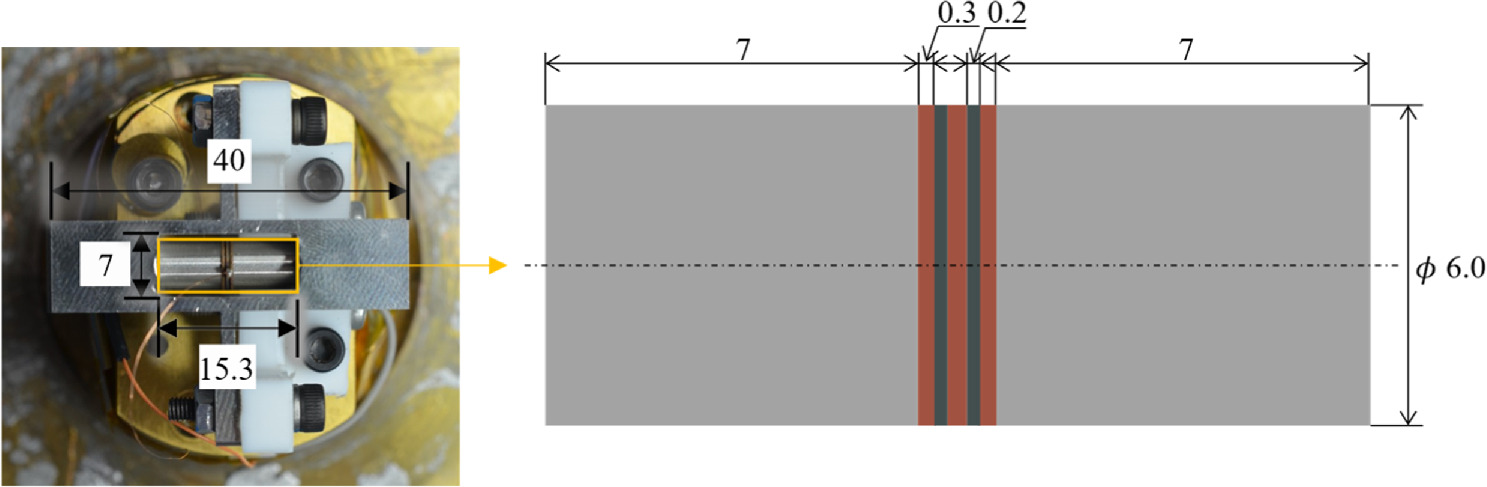
Fig. 6. Fabricated transducer for cryogenic condition without bolt-clamping mechanism.
Download figure:
Standard image High-resolution image
Fig. 7. Experimental equipment for the measurement of transducer performance; (a) Gas cell compatible cryogenic optical measurement system, (b) Inside of cryostat, (c) actual experiment by using laser Doppler vibrometer.
Download figure:
Standard image High-resolution imageAn equivalent circuit is used for the evaluation of the transducer. The equivalent circuit indicates a conversion of a mechanical system into an electric circuit using the analogy between mechanical and electrical systems. Force corresponds to voltage and vibration velocity corresponds to current.
39–42) In this way, the spring, the mass and the damper correspond to capacitance as equivalent stiffness, inductance as equivalent mass and resistance as equivalent mechanical resistance, respectively. The equivalent circuit is shown in Fig. 8 of the transducer. A simplified electrical equivalent circuit is shown in Fig. 9 when the mechanical load at both ends of the transducer is assumed to be zero.
39,43) In Fig. 9,  and
and  are equivalent resistance, equivalent inductance, and equivalent capacitance, respectively. By considering the force factor, each parameter corresponds to the equivalent mechanical resistance, equivalent mass, and equivalent stiffness in Fig. 8. The force factor can be calculated from the dynamic current
  in Fig. 9 and the measured vibration velocity value.

Fig. 8. Equivalent circuit for electrical and mechanical conversion.
Download figure:
Standard image High-resolution image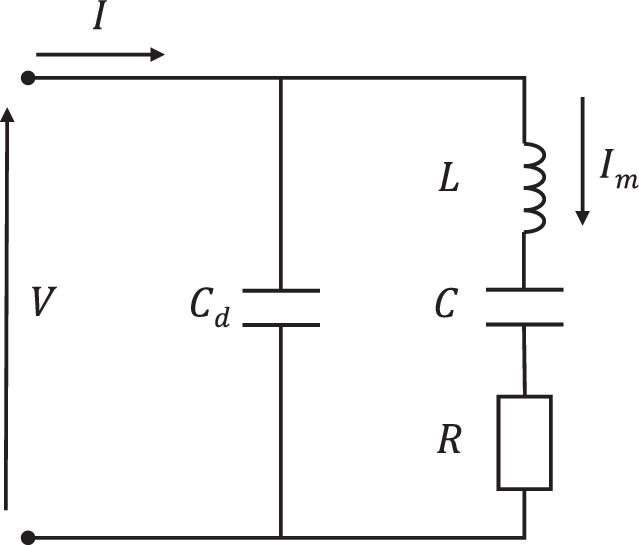
Fig. 9. Simplified electrical equivalent circuit for the evaluation.
Download figure:
Standard image High-resolution image4. Result
4.1. Admittance loops and Q factors
The measured admittance values at 295 K and 4.5 K are shown in Fig. 10. The admittance gain at low temperature is larger than that at RT, and the phase difference is also larger. Compared to the FEM simulation results, the resonance frequency at RT is smaller. The above admittance  is obtained by the following equation as

where  is conductance and
  is susceptance, and the admittance loops are defined with
  on the real axis and
  on the imaginary axis.
39) The admittance loops obtained from the measured admittance are shown in Fig. 11. The Q factor can be obtained from the admittance loop by the following equation as
on the imaginary axis.
39) The admittance loops obtained from the measured admittance are shown in Fig. 11. The Q factor can be obtained from the admittance loop by the following equation as

where  is the series resonance angular frequency,
  is the quadrant angular frequency that gives the maximum susceptance, and
  is the quadrant angular frequency that gives the minimum susceptance.
39) Figure 12 shows the estimated Q factors when the chamber temperature was changed. The admittance loops at low temperatures are larger than those at RT. The increase in Q factors with decreasing temperature is due to the increase in elasticity of the material that constitutes the transducer and the decrease in damping. The physical meaning of the Q factor is how much more reactive energy is stored than the energy consumed by the mechanical resistance,
44) and high conversion efficiency can be expected as an electromechanical conversion device in low-temperature environments. The constants of simplified electrical equivalent circuit can be obtained from Figs. 11 and 12.
is the quadrant angular frequency that gives the minimum susceptance.
39) Figure 12 shows the estimated Q factors when the chamber temperature was changed. The admittance loops at low temperatures are larger than those at RT. The increase in Q factors with decreasing temperature is due to the increase in elasticity of the material that constitutes the transducer and the decrease in damping. The physical meaning of the Q factor is how much more reactive energy is stored than the energy consumed by the mechanical resistance,
44) and high conversion efficiency can be expected as an electromechanical conversion device in low-temperature environments. The constants of simplified electrical equivalent circuit can be obtained from Figs. 11 and 12. 

 and
and  of the simplified electrical equivalent circuit can be obtained by the following equations as


where Gmax is the maximum value of conductance and  is the parallel resonance angular frequency.
39) The calculated constants are shown in Table I. Values except reactance are smaller at low temperatures than at RT.
is the parallel resonance angular frequency.
39) The calculated constants are shown in Table I. Values except reactance are smaller at low temperatures than at RT.
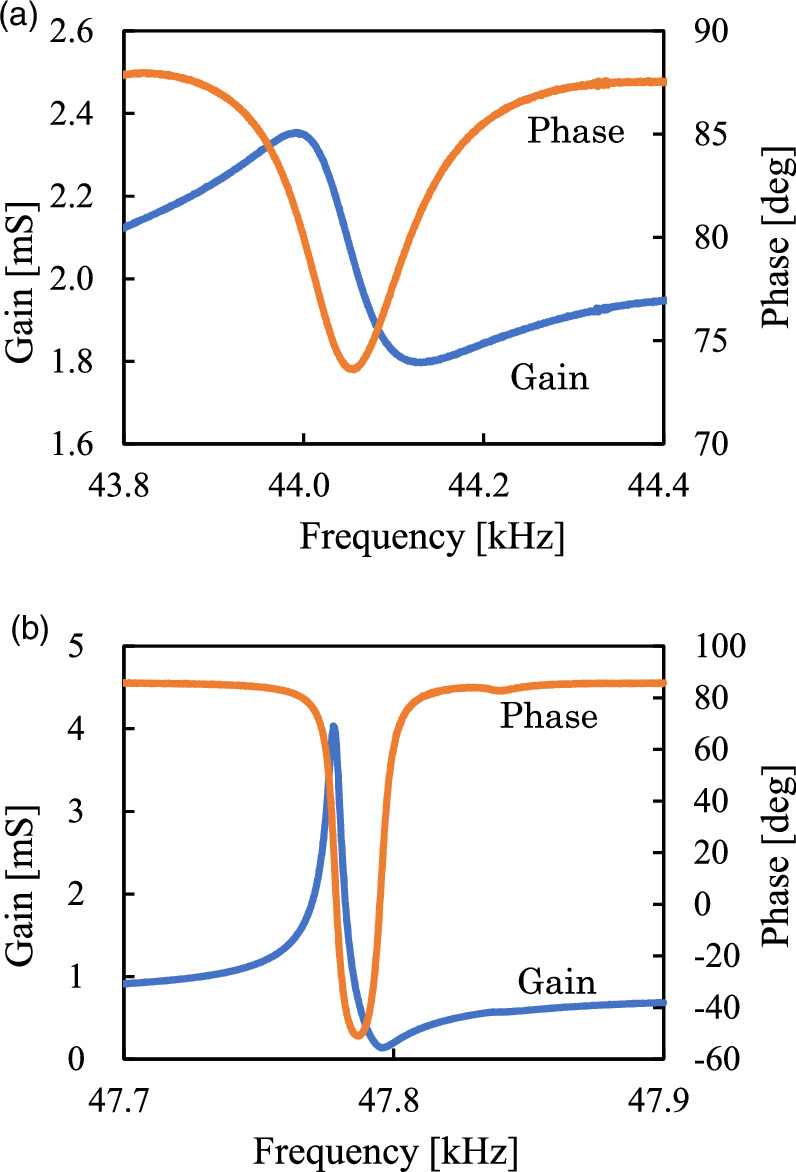
Fig. 10. Relationship between admittance gain, phase and frequency; (a) when the temperature was 295 K, (b) when the temperature was 4.5 K.
Download figure:
Standard image High-resolution image
Fig. 11. Admittance loops when the chamber temperature was changed.
Download figure:
Standard image High-resolution image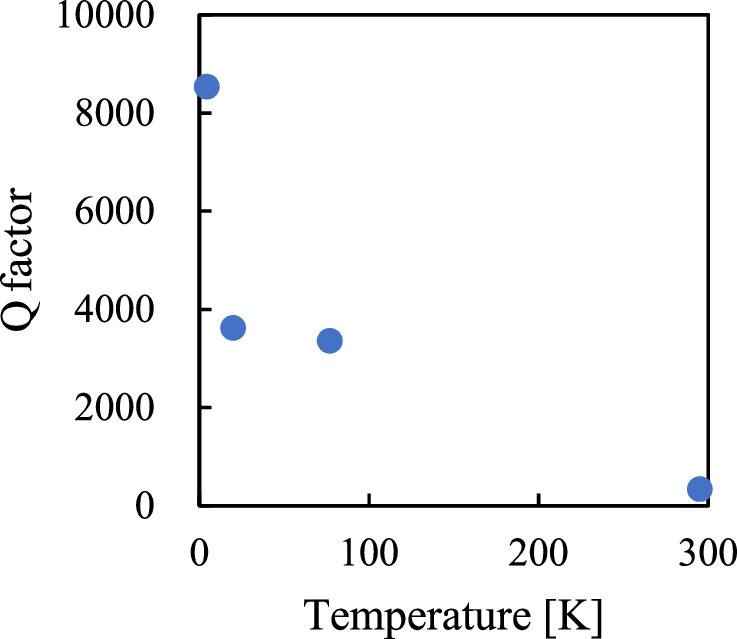
Fig. 12. Relationship between Q factors of the transducer and temperatures.
Download figure:
Standard image High-resolution imageTable I. Equivalent circuit constants when the chamber temperature was changed.
| Temperature [K] |
![$R[{\rm{\Omega }}]$](https://content.cld.iop.org/journals/1347-4065/63/3/03SP03/revision2/jjapad1e9bieqn17.gif)
|
![$C[{\rm{F}}]$](https://content.cld.iop.org/journals/1347-4065/63/3/03SP03/revision2/jjapad1e9bieqn18.gif)
|
![$L[{\rm{H}}]$](https://content.cld.iop.org/journals/1347-4065/63/3/03SP03/revision2/jjapad1e9bieqn19.gif)
|
![${C}_{d}[{\rm{F}}]$](https://content.cld.iop.org/journals/1347-4065/63/3/03SP03/revision2/jjapad1e9bieqn20.gif)
|
|---|---|---|---|---|
| 295 |

|

|

|

|
| 77 |

|

|

|

|
| 20 |

|

|

|

|
| 4.5 |

|

|

|

|
4.2. Vibration velocity values
Next, the measured transducer end surface vibration velocities at ambient temperatures of 295 K and 4.5 K and applied voltages of 20 V and 120 V as peak to peak values are shown in Fig. 13. Figure 13 shows that the nonlinearity of the vibration velocity tends to become stronger as the applied voltage increases. Additionally, the relationship between the applied voltage and the vibration velocity of the transducer end surface when the chamber temperature was changed is shown in Fig. 14. At all temperatures, the vibration velocity increases as the applied voltage increases, indicating a linear relationship between applied voltage and the vibration velocity. Then, Fig. 15 shows the relationship between the vibration velocity of the transducer's end surface and temperature when the applied voltage was changed. For all applied voltages, the vibration velocity increases with decreasing temperature compared to RT. These results show that sufficient preload is applied to the piezoelectric element as the temperature decreases. The finite element analysis results show that the preload applied to the piezoelectric element increased as the temperature decreased, and the admittance loops were larger at the lower temperature. This suggests that the vibration velocity is larger at low temperatures than at RT. However, the temperatures with maximum properties differ between the analytical and experimental results. There are two possible reasons for this problem. The physical properties of 42 invar at low temperatures have not been evaluated. In the FEM simulation, those of 36 invar, which has a similar composition to that of 42 invar, was used, and the data was obtained from the literature. 38) Because the physical properties used in the analysis differ from those of the obtained material, there may be a difference between the analytical and the experimental results. In addition, the FEM results are about the temperature characteristics of the von-Mises stress in the piezoelectric element. In those results, the stress applied to the piezoelectric element is largest at the temperature of 45 K. On the other hand, in experiments, measured admittance and vibration velocity values of the transducer are maximum at 77 K. It is necessary to take into account parameters other than the preload on the piezoelectric element for the vibration characteristics.
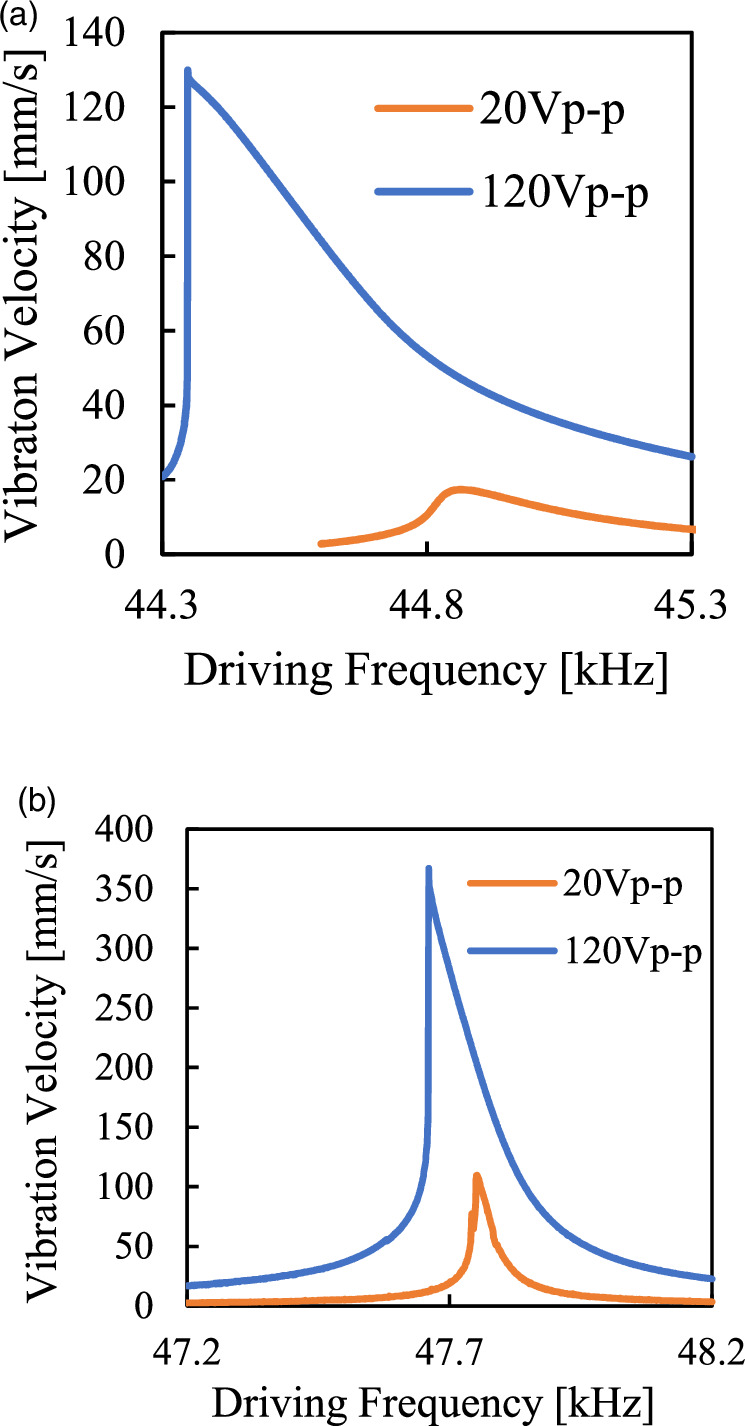
Fig. 13. Relationship between vibration velocity and driving frequency; (a) when the temperature was 295 K, (b) when the temperature was 4.5 K.
Download figure:
Standard image High-resolution image
Fig. 14. Relationship between applied voltage and vibration velocity when the chamber temperature was changed.
Download figure:
Standard image High-resolution image
Fig. 15. Relationship between vibration velocity and temperature when the applied voltage was changed.
Download figure:
Standard image High-resolution image
4.3. Force factors
The force factor was calculated from the values in Table I and the measured vibration velocity. The force factor  can be obtained by the following equation as

where  is the dynamic current in Fig. 9, and
  is the vibration velocity.
39) As
is the vibration velocity.
39) As  cannot be measured experimentally, it can be obtained from the values in Table I. The vibration velocity at 20 V as peak to peak values is used to calculate the force factor. The calculated force factors when the chamber temperature was changed are shown in Table II. Table II shows that the change in force factors with decreasing temperature is small. This tendency indicates that the efficiency of converting electrical energy into mechanical energy is maintained at the same level as at RT even in a low-temperature environment by applying a preload to the piezoelectric element.
Table II. Force factors estimated by using equivalent circuit.
| Temperature [K] |
![$A[{\rm{A}}\bullet {\rm{s}}/{\rm{m}}]$](https://content.cld.iop.org/journals/1347-4065/63/3/03SP03/revision2/jjapad1e9bieqn41.gif)
|
|---|---|
| 295 |

|
| 77 |

|
| 20 |

|
| 4.5 |

|
4.4. Figure of merit
A figure of merit can be implemented as another evaluation indicator. The figure of merit indicates how well the transducer performs, the higher the value, the better the performance of the transducer. The figure of merit  can be calculated as

where  is the capacitance ratio, expressed as
  45) From the equation, the larger
  and the smaller
  lead to a larger
  The calculated
  and
and  values are shown in Table III. From Table III, the figure of merit
  is larger at low temperatures than at RT. Those results indicate that the transducers fabricated in this study have high conversion efficiency as electromechanical conversion elements in a low-temperature environment.
Table III. Figure of merit and capacitance ratio estimated by using equivalent circuit.
| Temperature [K] |

|

|
|---|---|---|
| 295 | 995 | 0.33 |
| 77 | 609 | 5.51 |
| 20 | 898 | 4.03 |
| 4.5 | 1405 | 6.07 |
5. Conclusions
In this study, we have fabricated and evaluated the transducer that can apply preload to piezoelectric elements using the difference in thermal contraction of two different metals without using bolt clamping. Admittance and vibration velocity were measured from RT to cryogenic temperatures, and circuit element constants of the equivalent circuit of the transducer were calculated. Vibration velocity values, admittance loops and the Q factor in the low-temperature environment were larger than those in the RT.
The force factor was calculated from the equivalent circuit and compared, and values similar to those at RT were obtained at low temperatures. The figure of merit was larger at low temperatures. This result indicates that the transducers fabricated in this study have high conversion efficiency as electromechanical conversion elements in low-temperature environments. As a result, we have successfully proved that the transducer without the use of bolt clamping can perform well even in low-temperature environments.
Acknowledgments
This work was partially supported by the Grant-in-Aid for Scientific Research (B) of Japan Society for the Promotion of Science (No. JP19H02054).