
Abstract
Peptoids are biomimetic materials in which the substituent groups are located on the nitrogen atom of the peptide bond, facilitating the formation of nanosheet structures as reported by Mannige et al. [Nature, 526, 415 (2015)]. Dissipative particle dynamics (DPD) simulations were performed to investigate the aggregation stability of peptoids with different unit lengths. The crucial effective interaction parameters were determined by fragment MO (FMO) calculations, which allowed to evaluate different molecular interactions (electrostatic and dispersion) in a balanced way. The experimental observation of the unit length dependence was finally reproduced by this FMO-DPD method.
Export citation and abstract BibTeX RIS

Content from this work may be used under the terms of the Creative Commons Attribution 4.0 license. Any further distribution of this work must maintain attribution to the author(s) and the title of the work, journal citation and DOI.
Peptoids, or poly-N-substituted glycines, are a class of peptidomimetic polymers developed by Zuckermann 1) in which the side chains are attached to the nitrogen atoms of the peptide backbone. 2) This feature prevents the formation of interchain and intrachain hydrogen bonds derived from the N–H moiety and, compared to peptides, allows more direct control of aggregation ability and chemical properties through the choice of side chains and monomer structure, 3,4) with aromatic moieties (e.g. phenyl) often used as convenient substituents. 5,6) Therefore, peptoids have attracted considerable interest in the field of nano-biotechnology. In particular, Zuckermann's group 7) reported an interesting peptoid that yields nanosheet structures where the aggregation behavior depends on the unit length of the chain. Shorter units could not form stable aggregates. Calcium carbonate mineralization was modeled by this nanosheet. 8) Furthermore, the effect of halogenation (typically fluorination 9)) of the phenyl ring on the aggregation was investigated. 10)
Molecular simulations should be useful in understanding the nature of the interactions that drive peptoid aggregation. In fact, the (atomistic) molecular dynamics (MD) simulation with an empirical atomistic force field (FF) was used in Ref. 7. Recently, a special semi-empirical FF set for peptoids has been reported. 11) A coarse-grained (CG) FF has also been proposed for peptoids by modifying the empirical MARTINI set for peptides. 12) In contrast, we have developed an original procedure that performs the dissipative particle dynamics (DPD) 13) simulation of the CG type with non-empirical interparticle interaction (χ) parameters derived from the fragment MO (FMO) method. 14,15) In this FMO-DPD procedure, the multi-step evaluation of χ parameters can be performed with FCEWS (FMO-based Chi-parameter Evaluation Workflow System). 16,17) FMO-DPD has been applied to a variety of systems (including electrolyte polymer, lipid, and peptide 18–22)), indicating broad applicability. In this work, the FMO-DPD procedure was applied to the peptoid nanosheet, 7) where the aggregation stability as a function of unit length was of primary interest.
The basic structure of a peptoid nanosheet 7) and the segmentation for DPD are shown in Fig. 1 (whose unit length (L) is formally given as 2 × 7 + 2 × 7 = 28 due to n = 7). As shown in this figure, the charged group (−NH3 and −COO−) should be hydrophilic and the phenyl group should play a role of dispersion-driven stabilization with hydrophobicity, leading to the bilayer structure like membrane. The number of segments is five; they were [A] Gly main chain, [B] phenyl linker C2H6, [C] benzene (or phenyl) and side groups of [D] −NH3 +, and [E] −COO−. To investigate the effect of fluorination of phenyl, 10) fluorobenzene was also considered. For these segmented molecules, the geometry optimization was performed by GAUSSIAN16 23) at the B97D 24)/6-31 G(d) 25) level. A series of second-order perturbation (MP2) calculations 25) with ABINIT-MP 26,27) were done in parallel runs 28–30) for a list of segment moieties including environmental water parts (refer to the previous studies 18–22)), using the cc-pVDZ basis set. 31) ABINIT-MP job submissions were controlled by FCEWS. The hydration effect was accounted for by the Poisson–Boltzmann (PB) model. 32,33) Then the evaluation of χ parameters was done in a standard way with FCEWS. How to handle electrostatic interactions between charged particles (or segments) in CG simulations such as DPD 34) has often been a concern. For example, in Refs. 35 and 36 the part related to electrostatic interactions is explicitly considered. However, since the present calculations include delocalization and anisotropy of the electron distribution in a non-empirical MO scheme, and also include partial shielding effects due to hydration in the PB model, the usual DPD framework of parameter setting was retained. The lists of χ parameters and aij parameters for DPD are given in Table I. To understand the nature of the interactions in the peptoid nanosheet, the MD snapshot structure (L = 28) of Ref. 7 was subjected to the FMO interaction energy analysis 37,38) at the MP2/cc-pVDZ level, where 12 chains were extracted from the central region; the standard fragmentation protocol was adapted. 14,15)

Fig. 1. Molecular structure of a peptoid nanosheet (L = 28/n = 7). (a) Scheme of segmentation. (b) Segmented molecules.
Download figure:
Standard image High-resolution imageTable I. Lists of χ parameters and aij parameters (aii is set to 105.0). Values in brackets associated with segment [C] for the fluorinated phenyl.
| χ pararameters | ||||||
| A | B | C | D | E | Water | |
| A | 0.0 | 7.9 | −4.9 (−4.2) | −14.7 | −6.8 | 2.5 |
| B | 0.0 | 0.4 (0.2) | 2.9 | −4.3 | 7.8 | |
| C | 0.0 | 2.8 (2.6) | −10.4 (−7.9) | 5.9 (10.6) | ||
| D | 0.0 | −53.4 | −20.8 | |||
| E | 0.0 | −44.4 | ||||
| Water | 0.0 | |||||
| aij parameters | ||||||
| A | B | C | D | E | Water | |
| A | 105.0 | 130.8 | 89.1 (91.2) | 57.0 | 82.8 | 113.0 |
| B | 105.0 | 106.4 (105.8) | 114.3 | 91.0 | 130.5 | |
| C | 105.0 | 114.2 (113.6) | 71.1 (79.0) | 124.3 (139.8) | ||
| D | 105.0 | 0.0 | 37.1 | |||
| E | 105.0 | 0.0 | ||||
| Water | 105.0 | |||||
The J-OCTA 39) program suite was used to perform the DPD simulations (with the COGNAC 40) module) and to analyze the results. The DPD conditions were set in a standard manner, with the conservative force including the FMO-based aij (or χ) parameters, as in previous studies. 17–21) Since the dependence of the aggregation stability on the L/n of the peptoid unit 7) was of primary interest, the initial structures for DPD were carefully setup. Figure 2 illustrates the case of L = 12 (n = 3), where the charged parts are configured in a complementary manner. The initial setting for other cases of L = 4, 8, 16, 20, 24, 28 was done similarly. The total number of particles was about 1.5 × 10⁵ in the simulation cell, the base length of the cell was 36.8 Rc (26.1 nm in real scale). The DPD time step was 0.01 and the number step was 2.0 × 10⁵ (at least 280 ns in real time). The structure record was taken every 500 steps, resulting in a total of 400 records. If the stability of a given unit length would not be sufficient in mutual interactions, the aggregation of sheets should collapse.

Fig. 2. Example of initial structure setup (L = 12/n = 3) for DPD. In this case, the number of peptoid units is 440, and the distance between nanosheets is 0.84 Rc .
Download figure:
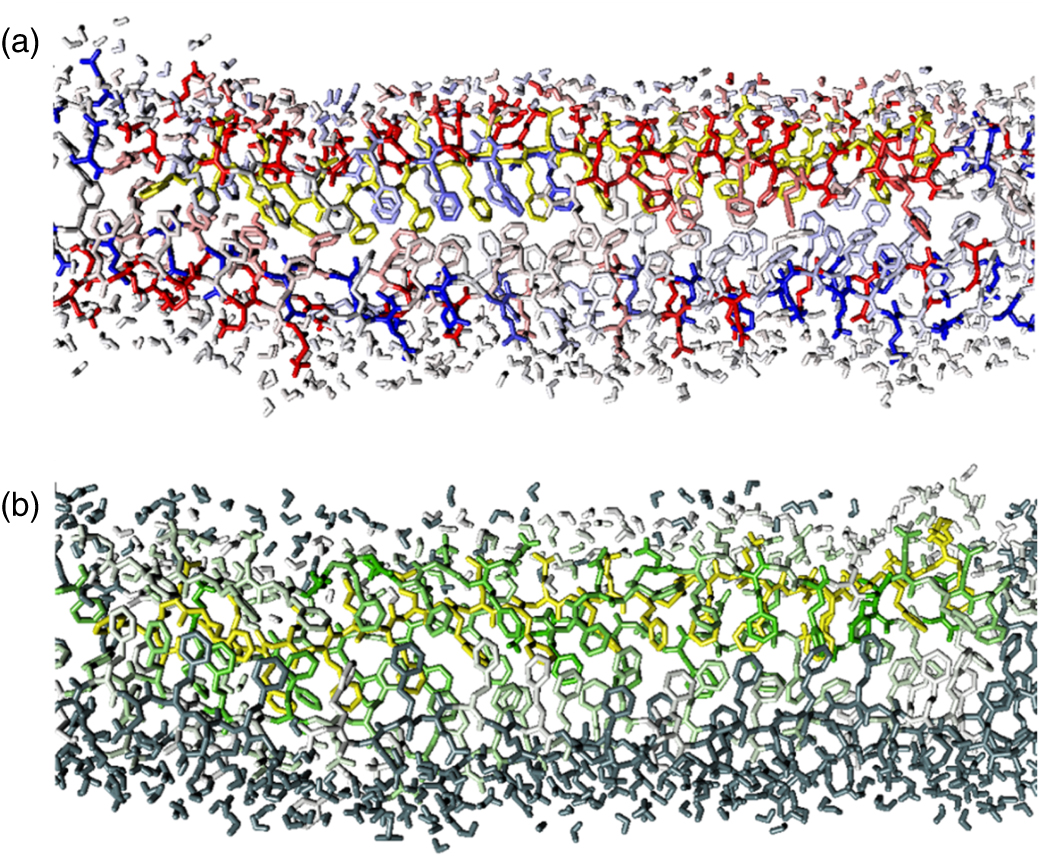
Standard image High-resolution imageFirst, the nature of the interactions in the aggregated nanosheet is investigated by the FMO interaction analysis. Figure 3 shows the visualized interaction energies of the reference chain. Both stabilized and destabilized fragments in the surrounding chains are visible in part (a) of this figure, indicating that the relatively long-range electrostatic interactions due to −NH3 + and −COO− groups are substantial. In contrast, the dispersion-like attractions (π/π and CH/π) between the phenyl groups are short-range and more internal, as shown in part (b). Thus, the length-dependent balance between stabilization and destabilization should govern the behavior of the aggregation. 7)

Fig. 3. Visualized interaction energies around the reference chain (yellow colored). The basic structure was obtained from the MD snapshot data (L = 28/n = 7) of Ref. 7. (a) Red and blue colors correspond to stabilization and destabilization, respectively (from −30 to 30 kcal mol−1 in the range). (b) The green color indicates dispersion-like stabilization evaluated at the MP2 level.
Download figure:
Standard image High-resolution imageThe results of the DPD simulations are now considered. Figure 4 shows the side views of the 400th (or final) record for the respective unit lengths for both the normal phenyl 7) and fluorinated phenyl 10) cases, and the views of the progressive records are available in the supplementary data (SD). Reference 7 reported that the aggregation of the nanosheet is experimentally visible for the length of L = 12 (n = 3), but it is not as stable. Note that the stable aggregations were observed for the lengths of L = 16 and L = 28. 7) Visually, the present simulation agrees with these experimental observations for the normal phenyl case. It is noteworthy that the structural collapse in the short lengths of L = 4 and L = 8 is considerable; see also the corresponding sequences in SD. The plots of the order parameter (OP) and the radial distribution function (RDF) are shown in Fig. 5. In particular, the decay of OP is sharp for L = 4 and slightly moderate for L = 8, consistent with Figs. 4 and S1-1 and S1-2. The OP plots of L = 12 and L = 16 decrease initially, but do not decrease thereafter. The OP plots of longer L remain stable near unity. The RDF is also consistent with the OP results, indicating that the length at L = 28 provides the most stable aggregation. Overall, the present FMO-DPD simulation has nicely confirmed the experimental results of Ref. 7.
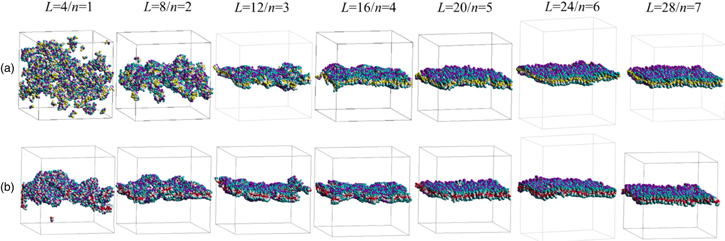
Fig. 4. DPD simulated structures with respect to unit length (each last 400th record). (a) Normal phenyl (yellow colored particle). (b) Fluorinated phenyl (red colored particle).
Download figure:
Standard image High-resolution image
Fig. 5. Plots of OP (top panel) and RDF (bottom panel) with respect to the unit length. (a) Normal phenyl. (b) Fluorinated phenyl.
Download figure:
Standard image High-resolution image
Next, the effect of fluorination on the phenyl ring 9,10) is examined. When compared to the case of normal phenyl in Fig. 4, it is clear that the fluorinated phenyl provides better aggregation stability, especially for the length of L = 8 (see Figs. S2-2 if necessary). The OP plot and RDF of L = 8 in Fig. 5 show a consistent behavior compared to the corresponding results of normal phenyl. It is noteworthy that the positions of the main peaks of RDF are shifted closer relative to those of normal phenyl. As expected from inductive electronic effects, 9,10) the fluorinated phenyl ring should provide a better aggregation capability.
In this work, we have reported a series of FMO-DPD simulations for the peptoid nanosheets, 7) and then reproduced the experimental observations on the dependence of the aggregation stability on the unit length of the chain. It was also shown that fluorination on the phenyl ring increases the aggregation strength, in agreement with the experimental observations. 10) These facts indicate that a delicate balance between stabilization and destabilization due to electrostatic and dispersion interactions can be maintained by the evaluated set of χ parameters with FCEWS. 16,17) One difficulty of this non-empirical parameterization procedure is the high computational cost for large amounts of FMO calculations, but a machine learning based system called pre_fcews has recently been developed to reduce the total cost of FMO calculations by half to one third while maintaining reliability. 41) We hope that FMO-DPD will be widely used for a variety of nano-bio systems.
Acknowledgments
For FMO calculations with FCEWS/ABINIT-MP, we used the computational resources of the MASAMUNE supercomputer at the Global Institute for Materials Research, Tohoku University (under subjects 20S0024, 2012SC0008 and 202112-SCKXX-0008) and the Fugaku supercomputer at the RIKEN Center for Computational Science (R-CCS) (under subject hp210261). DPD simulations with COGNAC of the J-OCTA suites and FMO interaction analysis with ABINIT-MP were performed on in-house servers. This work was supported by Rikkyo SFR. The authors would like to thank Dr. Taku Ozawa (JSOL Corporation) for his encouraging discussions.
Supplementary data (5.2 MB PDF)