
Abstract
We investigate the effects of several-hundred-micron thick luminescence down-shifting (LDS) films composed of sol–gel glass with Zn-based nanoparticles (NPs) dispersed on the characteristics of Si solar cells. Their internal quantum efficiencies (IQEs) are successfully measured by separating the contributions of downshifted photons in measuring reflectance for 300–400 nm, wavelengths of incident photons absorbed by the NPs. We find that IQEs for this wavelength range are more enhanced by employing thicker LDS films, i.e. LDS films with higher optical densities. We also discuss the relationship between the number density of NPs in LDS films, their optical properties, and the IQEs of cells. We observe a discrepancy between the measured and calculated IQEs and note that this is the result of downshifted photons escaping across the sides of the LDS films.
Export citation and abstract BibTeX RIS
1. Introduction
Given that photovoltaics (PVs) are a promising renewable energy source, a reduction of the loss in conversion from solar energy to electricity is essential. Luminescence down-shifting (LDS) 1–9) or luminescence down-conversion (LDC) 10–12) are assumed to improve the spectral response (SR) of cells in the UV region and reduce the loss in the UV wavelength range since the incident UV photons are absorbed, and the emitted visible photons can penetrate more deeply into the cells. 13) UV-induced degradation in perovskite-based PVs and ethylene vinyl acetate (EVA) films in PV modules can be suppressed by applying LDS or LDC effects. 14)
Several types of LDS materials were applied for Si, 1–3) III-V 4,5) and perovskite 6–8) single and multi-junction 9) solar cells. Substances with a large Stokes shift, a high quantum efficiency, an excellent photostability, manipulable absorption and emission wavelengths are preferable as LDS materials. Organic dyes 3,15) and rare-earth-doped complexes 1,2,16–19) are promising for LDS materials applied for solar cells. Semiconductor nanoparticles (NPs) are also widely applied as LDS materials since their optical absorption and emission spectra can be tuned by varying their size and changing doped species. Cd and Zn-related, 20–22) carbon-related 23) and perovskite 24,25) NPs were utilized for improving the quantum efficiency of Si cells. These semiconductor NPs were mainly synthesized by the hot-injection method. 26) The prepared NPs were hydrophobic, and were dispersed in organic solvents when they were used as LDS materials. 27)
Thicker LDS films, i.e. LDS films with higher optical densities (ODs) are preferable for more markedly improving solar cell characteristics. Several-hundred-micron thick LDS films are fabricated by dispersing LDS materials in films made of EVA, 3,17,19,24) polymethyl methacrylate (PMMA) 16,22) and silica glass. 18) Organic solvents, such as toluene, were used in forming EVA and PMMA films. The effects of these LDS films on solar cells were agrued based on their external quantum efficiencies (EQEs) in the most of the aforementioned works. This means that the two types of contributions of LDS films—reduction in reflectance at the surface of fabricated LDS films and the intrinsic LDS effects—were simultaneously investigated. We previously deposited Zn-based core–shell NPs on Si cells using the layer-by-layer (LBL) method. 28) The thickness of the deposited films was ∼100 nm. By examining the internal quantum efficiency (IQE) of cells, we directly observed the enhancement of their SR in the UV wavelength region due to the LDS of NPs. An analytical model for the relationship between the IQEs of cells and ODs of LBL-based LDS films was proposed, and the results of calculations were compared with measurements.
In this study, we investigated the intrinsic effects of thick (>500 μm) LDS films on the SR of Si cells in the UV wavelength region as the first step in precisely understanding the role of LDS films and enabling their design. The LDS films were prepared by applying a sol–gel process of water-soluble silica-based matrices and dispersing hydrophillic ZnSe/ZnS:Mn/ZnS shell-doped NPs 29) that were synthesized using the hydrothermal method, 30–33) i.e. without using organic solvents. It is also notable that elements composing NPs, Zn, Se, S and Mn, are abundant in the Earth's crust, 34) and the impact on the environment due to NPs is small. The wavelength of downshifted photons emitted from the NPs was ≈600 nm. 29,32,33) Their photoluminescence quantum yield (PLQY) was as high as 84%. 29) The ODs of the fabricated LDS films exceeded 1 in the UV wavelength region due to the thickness of the films. This means that downshifted photons unignorably contribute to the measured reflectance of cells in the UV wavelength region, which must be precisely determined for extracting IQE from EQE. We explored a method for removing the contribution of downshifted photons, and discussed the relationship between intrinsic characteristics of the cells and optical properties of the deposited LDS films. The measured results were compared with a calculation using a model that we had reported. 28) We also estimated the number density of NPs in the LDS films and discussed relationships between the number density of NPs, optical properties of LDS films, and solar cell characteristics.
2. Experiments
We synthesized ZnSe/ZnS:Mn/ZnS shell-doped NPs with a diameter of ∼5 nm. 29) We prepared two aqueous solutions with different NP concentrations. ODs at the absorption peak wavelength were measured using a cell with an optical path length of 10 mm. The ODs of the two solutions were found to be 5 and 12, respectively. The density of the NPs of each solution is proportional to the measured OD.
We deposited a sol–gel glass film with NPs dispersed on the surface of a glass plate by using a reported process. 29,35) To form sol–gel glass, we prepared a 6 ml sol mixture composed of DI water, NP solution and 3-aminopropyltrimethoxysilane (APTMS). The volume ratio of DI water:NP solution:APTMS = 4:2:1. The sol was deposited on a glass plate, and was dried under atmospheric conditions to form a gel. Sol–gel glass films made in combination with sparse/dense NP solutions are referred to as S2 and S3, respectively. Note that S2 and S3 work as LDS films. We also deposited sol–gel glass without NPs on a glass plate, S1, in which LDS does not occur.
We fabricated n-on-p Si cells by implanting B and P ions on high-resistive p-Si substrates, which were subjected to subsequent annealing. 28) The area of the emitters was 10 mm by 12 mm. Using the same conditions for preparing S1–S3, we formed a sol–gel glass film without NPs, S1', and two types of NP-dispersed sol–gel glass films, S2' and S3', on Si cells. The number density of the NPs and optical properties of sol–gel glass films on Si cells were assumed to be the same as those of films on glass plates. The thicknesses of sol–gel glass films d in S1–S3 and S1'–S3' were found to be 500–800 μm using a micrometer, as summarized in Table I. Using Rutherford backscattering spectrometry (RBS), the concentration of Se atoms was estimated to be 1.50 × 1019 cm−3 for S3', the sol–gel glass film with a higher NP density. No significant result for the concentration of Se was obtained for S2'.
Table I. Nominal thicknesses of sol–gel glass films with or without NPs measured by a micrometer.
| Sample | d (μm) | Sample | d (μm) |
|---|---|---|---|
| S1 | 550 ± 50 | S1' | 520 ± 50 |
| S2 | 684 ± 50 | S2' | 803 ± 50 |
| S3 | 655 ± 50 | S3' | 510 ± 50 |
We investigated optical characteristics, such as transmittance (T), photoluminescence (PL) spectra, the absolute PLQY and the refractive index of sol–gel glass films. The T spectra were obtained using a JASCO V-650 UV-vis spectrophotometer with a spectral resolution of 0.5 nm. The PL spectra were measured with a JASCO FP-8300 spectrofluorometer with spectral resolution of 0.5 nm. The monochromatic output of a Xe lamp (λ = 325 nm) was used for PL measurement. The absolute PLQY, or the ratio of integrated PL intensity to absorption of incident light, was measured for the incident light with λ between 300 and 400 nm. A JASCO ILF-835 100 mm integrating sphere system coupled with the spectrofluorometer was used in PLQY measurement. The refractive index was evaluated by ellipsometric measurements.
We measured the current–voltage (I–V) characteristics of S1'–S3' under the solar irradiance of AM1.5G/one sun using an in-house solar simulator as well as their reflectance (R) and EQE characteristics at room temperature. Si cells without sol–gel glass films were also characterized as a reference. In our facility for reflectance and EQE measurements, the reflected light from the cell surfaces was guided to the detector, as shown in Fig. 1(a). We placed a short-pass filter with 50% transmittance at ≃385 nm (Sigmakoki UTVAF-50S-33U) on the top of the cells to measure their reflectance for separating the contribution of downshifted visible photons from the reflectance in a UV wavelength region. The diagrams for reflectance measurement without and with the short-pass filter are shown in Figs. 1(b) and 1(c), respectively.

Fig. 1. (Color online) (a) Measurement diagram of EQE and reflectance. Optical path for reflectance measurement (b) without and (c) with a short-pass filter.
Download figure:
Standard image High-resolution image3. Results
The T spectra of S1–S3 are shown in Fig. 2. T of the three samples was commonly >80% for visible photons with λ > 400 nm. Their T was lower in the UV wavelength region. For λ < 400 nm, T of S1 was ∼ 60%, and S2 and S3 revealed a smaller transmittance in comparison with S1. T of S3 at 350 nm was 5.2%. PL spectra of these sol–gel glass films are shown in Fig. 3. We observed peaks at 600 nm in the PL spectra of S2 and S3. The PL signal of S3 was approximately twice as large as that of S2. PLQY spectra of S2 and S3 are shown in Fig. 4. The PLQY of S2, 51.8% for 350 nm, was slightly lower than that of S3, 61.5% for the same λ. The refractive indices of S1–S3 are shown in Fig. 5(a). They are compared with those of ZnS 36) and ZnSe 37) in Fig. 5(b). The refractive indices of S1–S3 were close to one another, and they were much smaller than those of ZnSe and ZnS.
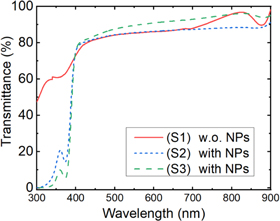
Fig. 2. (Color online) T spectra of sol–gel glass films formed on glass plates, S1–S3.
Download figure:
Standard image High-resolution image
Fig. 3. (Color online) PL spectra of sol–gel glass films with NPs dispersed, S2 and S3.
Download figure:
Standard image High-resolution image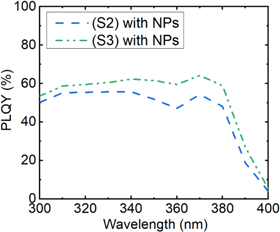
Fig. 4. (Color online) PLQY spectra of S2 and S3.
Download figure:
Standard image High-resolution image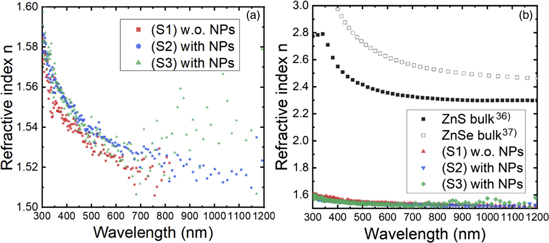
Fig. 5. (Color online) (a) Refractive indices of S1–S3. (b) Comparison of refractive indices of S1–S3 with those of ZnS 36) bulk and ZnSe bulk. 37)
Download figure:
Standard image High-resolution imageResults of the transmittance measurements implied that the absorption of S1, sol–gel glass film without NPs, was apparent for λ < 400 nm. This means that both of the sol–gel glass and NPs contributed to T of S2 and S3. The smaller T for λ < 400 nm and stronger PL signal of S3 in comparison with those of S2 were attributed to the higher number density of NPs in S3. Given that the optical properties of a single NP in S2 and S3 were assumed to be the same, the observed lower PLQY of S2 was likely to be attributable to the absorption of sol–gel glass, which did not bring about LDS.
The I–V characteristics of S1'–S3' are shown in Fig. 6. Characteristics of a reference cell are also shown for comparison. Parameters extracted from the respective curves—short-circuit current (Jsc), open-circuit voltage (Voc), fill factor, series and shunt resistances (Rs and Rsh) and conversion efficiency (η)—are summarized in Table II. We obtained a larger Jsc and a higher η in S1'–S3' in comparison with the reference cell. The surface of S3' was not entirely covered by the sol–gel glass film, which might be the origin of its lower Jsc in comparison with those of S1' and S2'. Voc and Rs in S1'–S3' (0.55–0.56 V and 2.84–3.55 Ω · cm2) were close to that of the reference cell (0.55 V and 2.66 Ω · cm2). The degradation in Rsh in S1'–S3' might be related to possible damage on the sides of the cell introduced during the deposition of sol–gel glass films. However, the reduced Rsh was still high enough and its impact on cell characteristics was negligibly small.
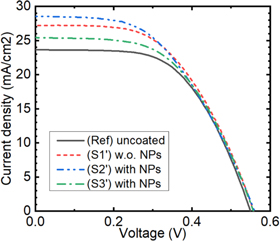
Fig. 6. (Color online) I–V characteristics of S1'–S3' under the AM1.5G/one sun solar irradiance. I–V characteristics of an uncoated cell (reference) are also shown for comparison.
Download figure:
Standard image High-resolution imageTable II. Parameters of Si cell characteristics.
| Reference | S1' | S2' | S3' | |
|---|---|---|---|---|
| Jsc (mA/cm2) | 23.6 | 28.1 | 28.5 | 25.4 |
| Voc (V) | 0.55 | 0.56 | 0.56 | 0.55 |
| Fill Factor | 0.57 | 0.51 | 0.49 | 0.54 |
| Rs (ω·cm2) | 2.66 | 3.13 | 3.55 | 2.84 |
| Rsh (103 Ω · cm2) | 22.0 | 1.01 | 0.65 | 0.85 |
| η (%) | 7.41 | 8.00 | 7.80 | 7.64 |
R spectra of S1'–S3' measured without and with a short-pass filter are shown in Figs. 7(a) and 7(b), respectively. Based on the assumption that the optical properties of the sol–gel glass films on the Si cells were the same as those of films on glass plates, we calculated the reflectance of S1'–S3' using the refractive indices and extinction coefficients of S1–S3 and Si. 38) The extinction coefficients of S1–S3 were estimated using the step described in the next section. To consider the effects of the spatial fluctuation of the thickness of sol–gel glass films, we varied d in the range of ±50 μm, and averaged the calculation results over d.
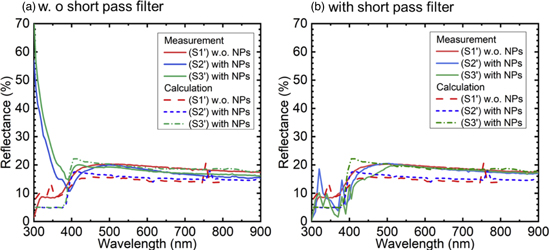
Fig. 7. (Color online) R spectra of S1'–S3' measured (a) without and (b) with the short-pass filter. Calculated results are also shown.
Download figure:
Standard image High-resolution imageThe calculated R is also shown in these figures for comparison. R of S2' and S3' measured without using the short-pass filter diverged for λ < 350 nm due to the contribution of downshifted photons. In contrast, the measured R using the short-pass filter is stable and close to the calculation, which suggests the validity of the approach employed in measuring reflectance in the UV wavelength region. We also found that R of S1'–S3' was lower than that of the reference cell in the entire wavelength region (not shown).
Figure 8 shows the EQE spectra of S1'–S3' and a reference cell for λ between 300 and 1200 nm. The enhanced EQE of S1'–S3' for λ > 400 nm, which is the origin of the increase in Jsc (Table II), is explained using a scheme where the sol–gel glass films worked as anti-reflection layers since sol–gel glass films with and without NPs brought about similar EQEs for λ > 400 nm.

Fig. 8. (Color online) EQE spectra of S1'–S3'. Spectrum for an uncoated cell (reference) is also shown for comparison.
Download figure:
Standard image High-resolution imageUsing the EQE and reflectance spectra [Fig. 7(a)], we extracted IQEs of S1'–S3' and the reference cell, which are shown in Fig. 9. We observed IQE enhancement for 300–400 nm in S2' and S3' in comparison with IQE of S1'. The IQE of S3' was approximately 16% higher than that of the reference cell at around 350 nm. The difference in the IQE spectra for λ > 400 nm between cells was not apparent, in contrast to the difference observed in the EQE spectra.
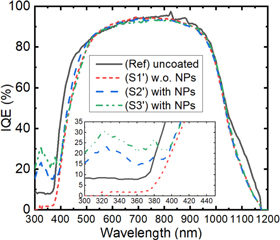
Fig. 9. (Color online) IQE spectra of S1'–S3'. Spectrum for an uncoated cell (reference) is also shown for comparison. Inset: spectra for the UV wavelength region.
Download figure:
Standard image High-resolution image4. Discussion
We discuss relationships between the number density of NPs in LDS films, their optical properties, extinction coefficient and OD, and IQE of cells in the UV wavelength region. We start with the calculation of the number density of NPs by using the following assumptions.
- (1)All of the Se atoms in the sol–gel glass films are distributed in the NP cores.
- (2)The diameter of the ZnSe cores is 5 nm.
- (3)ZnSe in the cores reveals the zincblende structure with the same lattice constant as that of bulk ZnSe crystals in the literature (5.6687 Å).
- (4)The densities of NPs in LDS films on glass plates are the same as those in films on cells as aforementioned.
Based on the above assumptions, we obtained the number density of NPs in S3 as 1.1 × 1016 cm−3. The number density of NPs of S2 was estimated to be 4.4 × 1015 cm−3 based on the OD of NP solutions and the mixing ratio of materials in the gel process.
The extinction coefficient of S1–S3, ki for Si (i = 1–3), is given by,

using the IOD (intrinsic OD) of each sol–gel glass film, which is defined as IOD =  . Noting that S1, a sol–gel glass film without NPs, also revealed optical absorption in the UV region, k due to NPs in S2 and S3, kNP,2 and kNP,3, is given by,

It was reported that NPs were periodically aligned in LBL-based LDS films. 39) The in-plane and out-of-plane separations between the centers of 5 nm NPs are estimated to be 5 and 5.5 nm, respectively, which means that the number density of NPs in a 140 nm thick LBL-based LDS film, which we previously reported, 28) is 6.0 × 1018 cm−3. Given that the IOD of this LDS film was 0.07 at 350 nm, the extinction coefficient at 350 nm was 3.30 × 10⁻². The thickness, IOD, extinction coefficient and number density of NPs for each LDS film are summarized in Table III. The relationship between these parameters is useful in designing LDS films. Although the number densities of NPs, hence the extinction coefficient of sol–gel glass-based LDS films, S2 and S3, are ≈1/100–1/1000 of those of the LBL-based LDS film, the sol–gel glass-based films outperform the LBL-based film due to a large (>1000) difference in thicknesses.
Table III. Optical properties at 350 nm of LDS films. The number density of NPs estimated for the respective films are also shown. Number densities of S2 and S3 are based on RBS measurement of S3', while the number density for LBL-based LDS film is based on the nominal separation between the centers of NPs in the film.
| LDS film | d | IOD at 350 nm | kNP at 350 nm | Number density of NPs |
|---|---|---|---|---|
| S2 | 684 μm | 0.88 | 5.76 × 10⁻⁵ | 4.4 × 1015 cm−3 |
| S3 | 655 μm | 1.28 | 1.00 × 10⁻⁴ | 1.1 × 1016 cm−3 |
| LBL-based 28) | 140 nm | 0.07 | 3.30 × 10⁻² | 6.0 × 1018 cm−3 |
The absorption cross-section for λ of 350 nm was estimated to be 0.47, 0.33 and 0.20 nm2 for S2, S3 and the LBL-based LDS film, respectively, by combining the number density of NPs and kNP at this wavelength. The difference in absorption cross-sections between LDS films might be due to more marked shadow effects of overlapping NPs in LDS films with higher NP densities. It is also notable that the estimated cross-section was ∼ 1/100–1/40 of 19.6 nm2, for the cross-section of NPs with a diameter of 5 nm. 29)
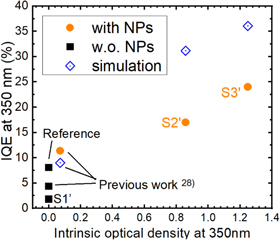
Figure 10 shows the relationship between IQE at 350 nm of S1'–S3' and IOD of S1–S3 at 350 nm. Results for Si cells coated with a 140 nm thick LBL-based LDS film are also shown. Larger IQEs at 350 nm were observed for Si cells coated with LDS films with higher ODs at this wavelength, i.e. LDS effects on solar cell characteristics were more enhanced by increasing the amount of NPs in LDS films. Reflections due to UV photon at wavelengths of 300–350 nm were cut off by the filter, so that the IQE enhancement derived from the emission of the NPs was clearly observed, i.e. the method for experimentally investigating intrinsic effects of high-OD LDS films on solar cells was established.
Fig. 10. (Color online) IOD-IQE relationships of Si cells coated with sol–gel glass LDS films, S1'–S3', a cell coated with a 140 nm thick LBL-based LDS film, 28) and an uncoated cell (as reference). Calculated IQEs for coated cells are also shown.
Download figure:
Standard image High-resolution image
IQE of cells coated with LDS films in the UV wavelength region are be given by the sum of contributions of incident UV photons and downshifted photons emitted from NPs, i.e. IQE of cells coated with LDS films at 350 nm, IQE350,NP, is expressed as, 28)
using the transmittance of incident 350 nm photons across the LDS layer on Si, T350, their reflectance, R350, IQEs of uncoated cells at 350 nm and at λ of downshifted photons, IQE350,ref and  . As previously reported,
28)
T350/(1 − R350) and (1 − T350/(1 − R350)) × PLQY provide the ratio of the flux of 350 nm photons arriving at Si to the flux of 350 nm incident photons penetrating the LDS film, and the ratio of the flux of downshifted photons emitted from NPs to the the flux of 350 nm incident photons penetrating the LDS film, respectively. The coefficient ηc (0 < ηc < 1) represents the fraction of downshifted photons that reaches the Si cell underneath. We set λ of downshifted photons to 600 nm or the peak wavelength of PL spectra of sol–gel glass films. ηc was calculated using the complex refractive index of air (N0 = 1 + 0j), sol–gel glass films (N1) and Si (N2 = 3.93 − 0.0185j
38)) at 600 nm. N1 at 600 nm and the obtained ηc for S2' and S3' are shown in Table IV.
. As previously reported,
28)
T350/(1 − R350) and (1 − T350/(1 − R350)) × PLQY provide the ratio of the flux of 350 nm photons arriving at Si to the flux of 350 nm incident photons penetrating the LDS film, and the ratio of the flux of downshifted photons emitted from NPs to the the flux of 350 nm incident photons penetrating the LDS film, respectively. The coefficient ηc (0 < ηc < 1) represents the fraction of downshifted photons that reaches the Si cell underneath. We set λ of downshifted photons to 600 nm or the peak wavelength of PL spectra of sol–gel glass films. ηc was calculated using the complex refractive index of air (N0 = 1 + 0j), sol–gel glass films (N1) and Si (N2 = 3.93 − 0.0185j
38)) at 600 nm. N1 at 600 nm and the obtained ηc for S2' and S3' are shown in Table IV.
Table IV. Calculation of fraction of downshifted photons that reaches the Si substrate for S2' and S3'.
| Cell type | d | N1 | ηc |
|---|---|---|---|
| S2' | 803 μm | 1.53 − 0.000014j | 0.62 |
| S3' | 510 μm | 1.54 − 0.000009j | 0.62 |
The obtained values are compared with the measured IQEs at 350 nm in Fig. 10. The calculated IQE increased as the OD of the LDS film increased in accordance with the measurement results. However, the calculated IQEs were 13% larger than the experimental results for S2' and S3'. We assume that the discrepancy might be due to downshifted photons escaping across the sides of the LDS films (side escape loss), which was not considered in calculation, since their thickness was several-hundred-microns in S2' and S3'. The contribution of the side escape loss is assumed to be quantitatively estimated by revising the process for calculating ηc. The side escape loss can be reduced by forming reflectors on the sides of the LDS films or employing thinner LDS films with higher densities of NPs.
5. Conclusion
We investigated the intrinsic effects of high-OD LDS films on Si cells. Several-hundred-micron thick LDS films were formed on glass plates and Si cells by depositing sol–gel glass with ZnSe/ZnS:Mn/ZnS NPs dispersed. By separating the contribution of downshifted photons from the reflectance in the UV wavelength region (λ < 400 nm), IQEs of cells coated with LDS films for the UV wavelength were successfully estimated. Their IQEs were ≈20% for 300–400 nm by LDS effects. The obtained IQEs were larger than those for cells coated with a thin (140 nm) LBL-based LDS film due to the higher ODs of sol–gel glass-based films. We discussed the relationship between IQE of cells, the extinction coefficient and the density of NPs in LDS films, which are useful in designing LDS films. IQEs obtained by a numerical analysis revealed a dependence on OD of LDS films similar to that of the measured IQEs. The discrepancy between measured and calculated IQEs (13%) might be due to the side escape loss or photons escaping across the sides of the LDS films. Possible approaches for reducing the side escape loss were also discussed.
Acknowledgments
This work was partly supported by JSPS KAKENHI (Grant No. JP17H03538).