
Abstract
Controlled tablet disintegration is useful for chemical consistency checks. This study monitored the swelling of 54 analgesia tablets from two different batches, during 13-6-MHz brightness-mode sonication and simultaneous video recording. The tablets were placed on an acoustic reflector inside a container and sonicated from the top. Sonication shortened the displacement half-life by 17%–27%. During tablet swelling, their speed of sound increased linearly, confirming the linearity of this process. Diagnostic ultrasound significantly decreased tablet disintegration times, supporting the ultrasound-microbubble interaction hypothesis.
Export citation and abstract BibTeX RIS
Controlled rapid disintegration of pharmaceutical tablets is of relevance for consistency checks during the manufacturing process. 1) Although not yet considered a default tablet disintegration technology, 1) ultrasound has been of known benefit in compaction 2,3) and monitoring 4–7) of tablets. Indeed, high-amplitude ultrasonic disintegration of tablets and other solid small structures is feasible, 8–10) but the acoustic regimes involved may cause inertial cavitation. 11–15) The dynamic behaviour of inertial cavities has been associated with the generation of free radicals 16,17) and the deposition of heat. 18,19) Both these effects are highly unwanted when checking chemical consistency.
The monitoring of tablets during or after the production process is not just done for consistency checks, but also for detection of the occurrence of cracks inside tablets. Such monitoring has been done inline with direct-contact ultrasound transducers. From direct-contact ultrasonic experiments on various tablets, it followed that the speed of sound of solid tablet components is typically 3 × 10³ m s−1. 20)
Having been filed for patenting in 2010 following preliminary experiments with single-element transducers, 21,22) the feasibility of ultrasonic tablet disintegration at low acoustic amplitudes has since been demonstrated using clinical brightness-mode probes. 23,24) Tablet fragments subjected to high-speed photography during sonication showed pockets with oscillating microbubbles. 24) The existence of such pockets has been thought to speed up the tablet disintegration process, 22) owing to friction of the surrounding material during oscillations 25) and to radiation forces exerted by the oscillating pockets onto their surroundings. 26,27)
For a submerged sugar-coated tablet, Schommartz discriminated five disintegration stages and their respective critical points. 22) For an uncoated tablet, these can be reformulated into four disintegration stages, whose starting points are marked by (1) first visible cracking in the surface; (2) first visible swelling; (3) first visible content release; (4) onset of avalanching collapse. 24) The measurement of these starting points is subjective. An objective and more readily quantifiable parameter is the tablet swelling measured as a function of time. It should be noted that tablet dissolution is a much slower process than tablet disintegration. 28,29)
In our preliminary study, we found rather large standard deviations in the disintegration times measured. 24) Such deviations have been attributed to slight physical differences between production batches and sometimes even to falsification. 30) Subtle physical differences between batches might be of influence on the disintegration process, accounting for the deviations observed. Moreover, if such physical differences exist, they must be detectable by the same brightness-mode imaging modality that speeds up the disintegration process.
The purpose of this study was to investigate otherwise identical tablets from different production batches. In addition, we sought to identify acoustic features in brightness-mode images of disintegrating tablets in solution, for correlation with the stages defined.
The experimental setup used for tablet disintegration is shown in Fig. 1. It comprised an HPL850 container (LocknLock Co., Ltd., Seoul, Republic of Korea) of 10 × 10 × 5 cm3 dimensions, positioned on the base of a clamp stand.
24) A P30 lite cellphone (Huawei Technologies Co., Ltd., Shenzhen, P.R. China) was attached in landscape orientation to the vertical rod of the clamp stand using Bostik Prestik (Permoseal (Pty) Ltd, Montague Gardens, South Africa) re-usable putty adhesive. For its known acoustic reflection, a 2006 nickel-brass St Helena  coin was attached heads-up to the bottom of the container using Bostik Prestik. The HFL38x 13–6-MHz linear probe of a SonoSite® M-Turbo® utilitarian portable sonography device (FUJIFILM SonoSite, Inc., Bothell, WA, USA) was clamped such that the probe face was 1.4 cm above the coin surface and the wide side of the probe was perpendicular with respect to the cellphone back. We define the central axial line through the probe as the x-axis.
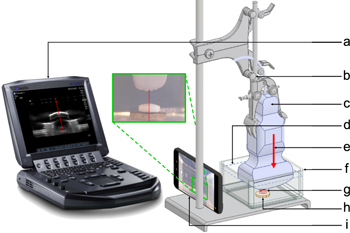
Fig. 1. (Color online) Line drawing of the experimental setup, consisting of a sonography device (a), a burette clamp stand (b), an ultrasound probe (c) dipped in water whose level is indicated by a blue dashed line (d) and whose x-axis is defined in the direction of propagation (e), a container (f), a tablet (g), a nickel-brass £1 coin reflector of 23-mm diameter and 3-mm thickness (h), and a cellphone (i). A red dashed line has been drawn through the centre of the tablet.
Download figure:
Standard image High-resolution imageBefore each experiment, the container was freshly filled with degassed Randburg tap water, whose temperature was measured to be 21 °C in each experiment. The experimental procedure was as follows. Three sealed SpartanTM packages, each containing 24 Panado® (Adcock Ingram Health Care (Pty)Ltd., Midrand, South Africa) tablets of 0.500-cm median thickness, were opened simultaneously. The numbered packages came from two different production batches. A tablet from either packaging was placed manually on the surface of the coin. The moment of manual release after placement was regarded as time t = 0. The experiment was considered finished after 180 s, which was regarded as t = ∞. The cellphone was recording videos nonstop during experiments.
For sonication experiments, the sonography device was operating in two-dimensional musculoskeletal pulsed brightness mode with a mechanical index of 0.8. 31) For this imaging mode, the fixed pulse repetition frequency has been specified as 2.5 kHz. 32) Other fixed parameters that might influence disintegration, such as line density and frame rate, have not been quantified. 32) Brightness-mode clips were recorded and stored during the experiments. For controls, the sonography device was switched off. A total number of 54 sonication and control experiments was performed, so that 54 tablets underwent the procedure stated above. Each experiment delivered an output of 5301 video frames. Each sonication experiment delivered an additional 1350 brightness-mode frames.
For each experiment, the qualitative video data were manually synchronised with the quantitative brightness-mode recordings, using the moment of placement underneath the transducer as a marker.
Brightness-mode clips were processed using MATLAB® (The MathWorks, Inc., Natick, MA, USA). From each clip frame, the axial 8-bit greyscale backscattering profile through the centre of the tablet was extracted. The centre was determined for each tablet individually. Subsequently, the absolute scatter amplitudes from the tablet and coin surfaces were determined in the lines extracted, as well as the perceived distances corresponding to these surfaces. 31) Tissue-mimicking phantoms had been used for the calibration of the ultrasound device. 32) The sonication device was assumed to have converted two-way travel times to one-way perceived radial distances using the speed of sound in such phantom tissue. 31)
The perceived distances to the tablet surface were extracted automatically from the backscattering profiles by identifying first peaks, which correspond to x-axis perceived distances, using a threshold grey value of 77. These perceived distances were represented by scatter plots as a function of time. For selected sonication experiments, a displacement constant was chosen such that a displacement function could be fitted through these perceived distance data, according to
where dx
is the displacement constant,  is the perceived displacement function in x-direction, and
  is the nonzero perceived distance from the probe to the tablet surface at t = 0, noting that the tablet is already in place at this time.
The speed of sound in the degassed tap water was determined from separate experiments without tablets. The instantaneous tablet thickness was computed using
where  is the speed of sound of the degassed tap water,
  is the speed of sound of phantom tissue used by the device to convert two-way time to perceived distance,
31)
h(t) is the instantaneous tablet thickness as a function of time,
is the speed of sound of phantom tissue used by the device to convert two-way time to perceived distance,
31)
h(t) is the instantaneous tablet thickness as a function of time,  is the fixed true distance from the probe face to the coin surface, and
  is the perceived distance from the probe to the tablet surface as a function of time. As an objective parameter to determine disintegration, we measured the surface displacement half-life as the time
  at which
  (∞) and therefore at which
  .
.
Following the method for computation of time-dependant speed of sound of a nucleating medium of known initial size, 33) the speed of sound of the disintegrating tablet was subsequently computed using
where c⊖(t) is the instantaneous speed of sound in the tablet and  is the perceived distance to the coin surface.
Throughout the experiments, gas bubbles were observed to accumulate on the transducer surface. In a separate experiment with the same setup, but without tablet presence, the influence of bubble accumulation on  was measured in 289 brightness-mode images in 41 different lines. It was found that bubble presence may lead to an increase of perceived distance of 0.1 mm, which corresponds to the pixel size. This absolute error is, however, the same for all perceived distances to the different surfaces at a given time t, and therefore of negligible influence on the computation of the speed of sound.
Table I shows perceived tablet surface displacement half-life of tablets from both batches, with and without sonication. The measurements from the brightness-mode images had slightly lower standard deviations than those from the videos. The swelling times of tablets in batch 1 were significantly longer than those of batch 2. We may therefore assume that batch 1 comprised tablets that had been more compacted. The application of ultrasound shortened the swelling times for both batches, by 17%–27%. It is noted that the swollen tablet surfaces were not uniform and that the central lines chosen may not have been representative. Nevertheless, variation between tablets has been less with brightness-mode images than with video frames, indicating that we may ignore lack of uniformity for the purposes of this study.
Table I. Perceived tablet surface displacement half-life  [s] for tablets from batch number n, with and without sonication. Displacement half-life was determined from both cellphone video and brightness-mode (B-mode) images for the sonicated tablets and from cellphone video only for the controls.
| Batch | Sonication | Video 
| B-mode 
|
|---|---|---|---|
| n | [✓ or ✗] | [s] | [s] |
| 1 | ✓ | 49 ± 4 | 51 ± 2 |
| ✗ | 59 ± 3 | ||
| 2 | ✓ | 8 ± 1 | 9 ± 1 |
| ✗ | 11 ± 1 |
Figure 2 shows two representative scatter plots, one for each batch used, of perceived tablet surface displacement over time. Each scatter plot corresponds to one expanding tablet. The data had been extracted from brightness-mode images, and are therefore only showing situations under sonication. For both tablets, the displacement decline was by approximation linear over time until  was reached. The displacement functions shown had been fitted using dx
= 0.006 cm s−1 for the tablet from batch 1 and dx
= 0.023 cm s−1 for the tablet from batch 2. This observation corresponded to a linear swelling of the tablet surface until it had reached a height h(∞). For illustrative purposes, inlay brightness-mode frames and backscattering profiles, each corresponding to a line through the tablet centre, have been matched to selected times. The video frames (not shown) confirm a linear swelling approximation of the tablets until the same maximum is reached. The reflection from the coin is visible at
was reached. The displacement functions shown had been fitted using dx
= 0.006 cm s−1 for the tablet from batch 1 and dx
= 0.023 cm s−1 for the tablet from batch 2. This observation corresponded to a linear swelling of the tablet surface until it had reached a height h(∞). For illustrative purposes, inlay brightness-mode frames and backscattering profiles, each corresponding to a line through the tablet centre, have been matched to selected times. The video frames (not shown) confirm a linear swelling approximation of the tablets until the same maximum is reached. The reflection from the coin is visible at  in frames a and f. A shift to
  cm was observed immediately after placement of the tablet, in frames b and g. The value of
  was observed to decrease with time.
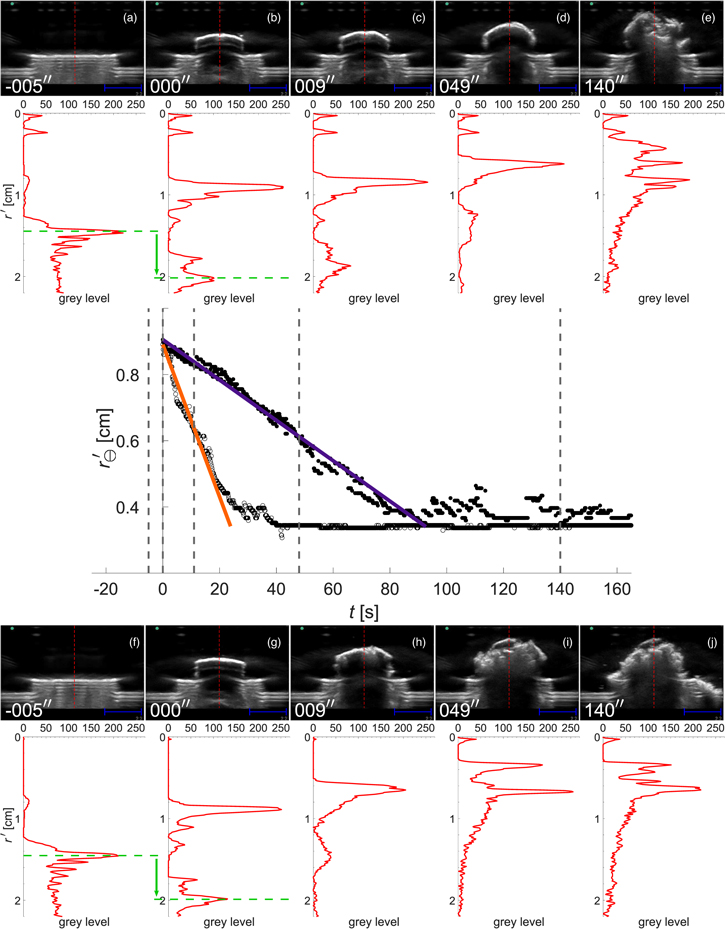
Fig. 2. (Color online) Scatter plots of perceived tablet surface displacement over time, for a tablet from batch 1 (●) and a tablet from batch 2 (◯). Displacement functions shown had been fitted using dx
= 0.006 cm s−1 for the tablet from batch 1 (purple) and dx
= 0.023 cm s−1 for the tablet from batch 2 (orange). Inlay brightness-mode frames and backscattering profiles have been matched to selected scatter-plot points for the tablet from batch 1 (a–e) and from batch 2 (f–j). Time stamps have been added to the lower left corners of the brightness-mode scans. Blue 1cm markers have been added to the lower right corners of the brightness-mode scans. The shifting of  owing to tablet placement is indicated by green arrows.
Download figure:
Standard image High-resolution imageAfter combining the  data for both tablet and coin reflections, Fig. 3 was generated using (3). The speed of sound derived for the tablets directly after placement was
  . If this low speed of sound is attributed to the presence of gas micropockets inside the tablets, their volumetric presence must be the same in both tablets. The speed of sound of both tablets increased over time. These results might be explained by the gas micropockets inside the tablets being released and the corresponding spaces filling up with water. The video observations of microbubble release during disintegration support this explanation. For the tablet from batch 1, the speed of sound was observed to gradually increase over time, reaching the maximum
  after 60 s. This value approximates
  of the typical speed of sound of the solid components of tablets.
20) Therefore, it agrees with an anticipated speed of sound of wetted material, i.e., 1.5 × 10³ m s−1 < c⊖(∞) < 3 × 10³ m s−1. It is noted that dissolution is not taken into account, as it is a much slower process than 180 s. For the tablet from batch 2, the speed of sound was observed to increase more rapidly, reaching the same maximum after 20 s.
of the typical speed of sound of the solid components of tablets.
20) Therefore, it agrees with an anticipated speed of sound of wetted material, i.e., 1.5 × 10³ m s−1 < c⊖(∞) < 3 × 10³ m s−1. It is noted that dissolution is not taken into account, as it is a much slower process than 180 s. For the tablet from batch 2, the speed of sound was observed to increase more rapidly, reaching the same maximum after 20 s.

Fig. 3. (Color online) Speed of sound c⊖ inside a tablet from batch 1 (purple) and batch 2 (orange), as a function of time.
Download figure:
Standard image High-resolution image
Knowing that the dimensions, mass, and speed of sound of the tablets are the same, a potential explanation for the observed discrepancies is a difference in microstructure between the tablets. If, indeed, tablets from batch 1 are slightly more compacted than those from batch 2, that might mean that the micropockets are not connected with each other, hampering the rapid gas release observed with tablets from batch 2. In addition, this might explain why ultrasound has only a minor effect on the disintegration of tablets from batch 2, which are thought to already contain a connected microstructure. The disintegration of tablets from batch 1, on the other hand, is dramatically sped up by sonication, which might be explained by microcracks being formed inside the tablet. It is of great interest to subject tablets from these and other batches to micro-computed tomography to confirm or refute these potential explanations.
In summary, brightness-mode ultrasound has proven successful in disintegrating tablets, especially if they are compacted. The swelling process of a tablet can be described by only one scalar parameter representing the displacement of the tablet surface in one direction.
Acknowledgments
The sonography equipment was kindly supplied by High Tech Medical, Randburg, South Africa. This work was supported by JSPS KAKENHI, Grant Numbers JP17H00864 and JP20H04542, by the National Research Foundation of South Africa, Grant Number 127102, and by the Academy of Finland, Grant Number 340026.