
Abstract
In this study, a simple, rapid, and environmentally friendly green approach for synthesizing Fe3O4 and Fe3O4/chitosan nanoparticles with various concentrations was developed. The nanoparticles had a spherical shape with a cubic inverse spinel structure. The functionalization of the Fe3O4 nanoparticles using chitosan increased the crystallite size of the nanoparticles from 7.2 to 7.8 nm. The Fourier transform infrared spectra of the Fe3O4/chitosan nanoparticles showed the existence of the characteristic peaks of chitosan in addition to a peak at 578 cm−1, which corresponds to the stretching of the Fe−O group. The UV-visible spectra demonstrated a wide absorption band with the appearance of small peaks of chitosan absorption at 205 and 215 nm. The saturation magnetization of the Fe3O4 was 54.1 emu g−1. The surface plasmon resonance (SPR) measurements showed an enhancement in the SPR angle as the ratio of chitosan to Fe3O4 increased, wherein the angle shift from 0.17° to 1.91°. The chitosan covering the Fe3O4 nanoparticle surface caused the refractive index to change, which increased the SPR angle shift. The obtained results indicated that the SPR properties of the Fe3O4 nanoparticles were significantly improved by modification with chitosan. These results also indicated that the use of chitosan in Fe3O4 nanoparticles can enhance SPR properties, which has potential for future SPR-based sensor applications.
Export citation and abstract BibTeX RIS

This is an open access article distributed under the terms of the Creative Commons Attribution 4.0 License (CC BY, http://creativecommons.org/licenses/by/4.0/), which permits unrestricted reuse of the work in any medium, provided the original work is properly cited.
Surface plasmon resonance (SPR) is a powerful technique for investigating biomolecular binding interactions in which the fundamental principle relies on optical phenomena. 1 SPR is detected when plane-polarized light passes through a high refractive index prism under total reflection conditions and strikes the interface of a metal film and dielectric medium. 2 At a specific incident angle, the surface plasmons (SP) generated by free electrons on the thin metal surface result in evanescent wave resonance and absorption of light photon energy by the SP, leading to an intensity dip in total reflected light, known as attenuated total reflection. 3 This SP is extremely sensitive to changes in the refractive index of the biomolecular layers, which in turn leads to an SPR angle shift. 4,5 The angle at which the reflectivity is minimal is known as the SPR angle or resonance angle. 6 Therefore, by detecting a small refractive index change at the sensing surface, information about the biomolecular recognition process can be obtained by monitoring the change in the resonance angle. 7
SPR biosensors offer the advantage of rapid, real-time, and label-free measurements, which makes them one of the most commonly used biosensors. 8,9 However, SPR biosensors have limitations in small-weight molecule measurements or the recognition of analytes in highly diluted samples. One of the most effective strategies to improve the sensitivity of SPR biosensors is the use of nanoparticles. 10 In addition, nanoparticles with conductive properties and sizes smaller than the incident wavelength of the electromagnetic wave can generate localized surface plasmon resonance (LSPR). The strongly localized electromagnetic fields induced by LSPR make nanoparticles extremely sensitive to small refractive index changes, which can enhance the sensitivity of detection. 11
Extensive research has been conducted to improve the performance of SPR biosensors using nanoparticles in various sensing applications. Çimen et al. developed patulin-imprinted nanoparticles for patulin detection, which have low detection limit (0.011 nM), good selectivity when tested against other competing molecules, and high reusability of 87.80%. 12 Çimen et al. also reported a study of thrombin-imprinted SPR biosensors using nanoparticles that showed a very low detection limit (0.017 pM), good selectivity, and reusability for thrombin determination. 13 The use of SPR biosensors for testosterone detection using testosterone-imprinted nanoparticles, which show an accurate, sensitive, and selective sensing performance, has also been reported. 14 The reported results indicate that the use of nanoparticles in SPR biosensors can significantly improve their detection capability.
Different synthesis methods and types of materials have been used to prepare nanoparticles. Magnetic nanoparticles are one of the most investigated SPR biosensors because of their excellent properties, such as high surface area-to-volume ratio and high molecular weight, which play a part in SPR signal enhancement. 15 Moreover, magnetic nanoparticles have a facile separation approach, which is crucial when applied for the separation of target analytes from a sample solution; therefore, the process becomes simple and quick. 16 Among the various types of magnetic nanoparticles, magnetite (Fe3O4) has been proposed for use as an active material in SPR biosensors because of its good biocompatibility, high electron exchange rate, and low toxicity. 17
Despite the excellent properties of Fe3O4 nanoparticles, functionalization or modification of nanoparticle surfaces with other materials is required because they have low chemical stability and easily aggregate and oxidize. 18,19 Among the various possible materials for functionalizing the surface of Fe3O4 nanoparticles, organic polymers have been the subject of research interest to address these problems. The biodegradable and biocompatible polymer chitosan (CS) is one of the most common and useful coating materials for nanoparticles that possess hydroxyl (OH) and amine (NH2) reactive groups that can functionalize the surface of Fe3O4 nanoparticles. 20,21 Moreover, CS-modified Fe3O4 nanoparticles can increase chemical stability, prevent aggregation, protect particle surfaces from oxidation, provide new functions, and enhance the properties of magnetite nanoparticles. 22,23 Therefore, Fe3O4/CS nanoparticles have been widely used in various fields, such as heavy metal adsorption, 24–27 metal determination, 28 enzyme immobilization, 29 targeted drug delivery, 30 magnetic hyperthermia, 31 and surface plasmon resonance (SPR). 32 In the case of SPR, the CS-modified Fe3O4 nanoparticles present several advantages, such as exhibiting good stability that contributes to plasmon-plasmon coupling, amplifying SPR signals to enhance sensitivity, offering active sites of functional groups to facilitate nanoparticle-molecule interactions, and acting as biocompatible and biodegradable active materials in SPR applications. 32
Different approaches have been employed for the efficient synthesis of iron oxide nanoparticles of different shapes and sizes. 33 A study reported that among the methods used to synthesize iron oxide nanoparticles, 90% are chemical processes, followed by physical methods (8%) and biological methods (2%). 34 Chemical methods include hydrothermal, electrochemical, sol-gel, chemical co-precipitation, and combustion processes. These methods involve laborious synthesis processes, high energy consumption, and high costs. 35 They use cytotoxic and carcinogenic chemicals, resulting in unsafe nanoparticle production and environmental contamination. 36 Therefore, the synthesis of nanoparticles using chemical methods limits their biosensor applications because of their toxic nature and environmental pollution. 37 This has led to the development of sustainable, reliable, economically feasible, and environmentally friendly strategies to synthesize nanoparticles. 38
Green synthesis has received considerable attention as it provides a precise solution to prevent any toxicity associated with chemical methods by employing natural and environmentally friendly materials, such as microorganisms and plants. 39 Recently, the plant-mediated green process has been utilized for the reduction reaction in the synthesis of nanoparticles owing to its non-toxicity, energy-efficiency, and simplicity in producing nanoparticles on a large scale. 40 Several plants, such as Garcinia mangostana, 41 Aloe barbadensis, 42 Myrtus communis L., 43 and Salvia hispanica L., 44 have been used as reducing agents to synthesize Fe3O4 nanoparticles, and one of the most widely used plants is Moringa oleifera (MO). 45–47 According to the literature, MO leaf extract contains almost 20% phenolics and flavonoids, which play an important role in reducing iron ions in the synthesis process. 48 In addition, the biochemical constituents contained in MO can act as stabilizing and capping agents in the structure of Fe3O4 nanoparticles. 49
Previously, we successfully synthesized Fe3O4 nanoparticles, Fe3O4/CS, and CS-polyethylene glycol (PEG) nanoparticles using chemical synthesis and used them as active materials in SPR. 32,50,51 In the literature, Fe3O4/CS nanoparticles synthesized using MO for use in SPR studies have never been reported. A recent study revealed that the green synthesis of noble metal nanoparticles (Ag) using MO shows the capability of amplifying the SPR signal; 52 thus, synthesizing Fe3O4/CS using MO for application in SPR-based sensors is advantageous. In this study, we aimed to synthesize Fe3O4 and Fe3O4/CS nanoparticles by green synthesis using MO extract and study their SPR properties. Furthermore, the microstructural, optical, and magnetic properties of the green-synthesized Fe3O4 and Fe3O4/CS nanoparticles were investigated.
Experimental Methods
In the present study, the co-precipitation method was used to synthesize nanoparticles. 36,53,54 All chemicals used in our experiments were of analytical grade and were used without purification. Ferric chloride hexahydrate (FeCl3.6H2O, Merck), ferrous sulfate heptahydrate (FeSO4.7H2O, Merck), ammonium hydroxide (NH4OH, 25%, Merck), chitosan (CS with a medium molecular weight of 190–310 kDa and degree of deacetylation of 75%-85%, Sigma-Aldrich), and Moringa oleifera powder (MO, PT Timur Rasa Indonesia) were used to synthesize Fe3O4/CS nanoparticles. Distilled water (dH2O) and glacial acetic acid (CH3COOH, 100%, Merck) were used to prepare solutions.
To prepare the MO extract solution, the MO powder was dissolved in 60 ml of distilled water and heated at 60 °C for 1 h under continuous stirring. The product was filtered using Whatman filter paper and stored in a refrigerator for further processing. 55,56 To prepare green-synthesized magnetite nanoparticles, 4.054 g of FeCl3.6H2O and 2.086 g of FeSO4.7H2O were dissolved in 15 ml of distilled water to prepare a solution of Fe3+ and Fe2+ with a 2:1 molar ratio. The MO extract solutions were then added while stirring at 60 °C on a hot plate. After 30 min, 30 ml of 10% (v/v) ammonium hydroxide (NH4OH) solution was added dropwise under continuous stirring to prepare the precipitate (black) of Fe3O4 nanoparticles. After synthesis, the precipitate was washed with distilled water and dried for 2 h at 100 °C in a furnace to obtain Fe3O4 nanoparticles. For Fe3O4/CS nanoparticles, 0.8 g of Fe3O4 nanoparticles were dispersed in 20 ml distilled water. Simultaneously, varying amounts of CS were dissolved in 25 ml of 2% (v/v) acetic acid solution. The weight percentages of CS in the Fe3O4/CS nanoparticles were 20%, 33%, 43%, and 50%, and the weight ratios of Fe3O4/CS were 4:1, 4:2, 4:3, and 4:4. The samples were subsequently labeled as FO/CS1, FO/CS2, FO/CS3, and FO/CS4. Then, 10 ml of the MO extract was added to the CS solution and stirred for 30 min. Subsequently, the CS/MO solutions were added to the Fe3O4 nanoparticles. With constant stirring for 1 h, Fe3O4 nanoparticles were homogeneously dispersed in the CS solution. Next, the Fe3O4/CS nanoparticles were precipitated using a magnet and washed seven times with distilled water to remove the excess polymer. Subsequently, the precipitates were dried for 2 h at 80 °C in a furnace to obtain Fe3O4/CS nanoparticles.
X-ray diffraction (XRD) data of the samples were obtained using a Shimadzu XD-3H instrument operating with a CuKα radiation source (λ = 0.154 nm). Scans were performed from 10° to 90° at a rate of 4.000° min−1. The XRD patterns were analyzed by the Rietveld refinement method using the MAUD program to determine the crystal structures and phase compositions of the samples. The average crystallite size of the nanoparticles was calculated using the Debye–Scherrer equation and XRD data. Transmission electron microscopy (TEM, Jeol JEM 1400) was used to study the microstructure and analyze the selected area electron diffraction (SAED) pattern of the nanoparticles using the ImageJ software. Fourier transform infrared (FTIR, IR Spectrometer Shimadzu Prestige-21) spectra were recorded in the range of 400–4000 cm−1 to investigate the functional groups of chitosan and the nanoparticles. A UV–vis spectrometer was employed to examine the optical characteristics of the samples within a wavelength range of 200–800 nm. Finally, a vibrating sample magnetometer (VSM, Riken Denshi Co., Ltd) was used for the magnetic characterization of the samples at room temperature with an external magnetic field varying from +15 to −15 kOe.
The SPR properties of the samples were examined using our laboratory's hand-made SPR spectroscopy system based on previous publications. 50,51,57,58 The Kretschmann configuration was chosen to attain the resonant condition (the reflected light intensity decreases sharply). 4,59 The experimental setup for measuring the SPR properties consists of the following parts: optical and mechanical instruments, the main unit, and a computer, as shown in Fig. 1a. The optical device included a light source (He-Ne laser) of wavelength 632.8 nm, beam splitter, BK7 prism, and pair of detectors (detector 1 and detector 2). A mechanical system was used to rotate the prism. The main unit and computer were used to control detector 2 (0.01° step motor resolution) and the measurements. The SPR spectra output (reflected light versus the angle of the incident light) was displayed by a computer, and then analyzed by observers. 32,57,60,61 SPR spectra result from plasmon excitation by an evanescent wave incident at a particular angle was greater than the critical angle. An evanescent wave is formed when a propagating laser beam in the prism encounters the metal-dielectric interface. This process raises the attenuated total reflection (ATR), where the SPR angle is observed (the incident angle at which the reflectivity is minimum). Before the experiment, we prepared the prism and dispersed the nanoparticles. First, a gold (Au) film with a thickness of approximately 48 nm was deposited on the prism surface using the thermal evaporation method. Then, 25 mg of each sample was dispersed in 5 ml of 70% ethanol by sonication to prepare Fe3O4 and Fe3O4/CS dispersions. The spray method was used to deposit Fe3O4 and Fe3O4/CS nanoparticles on the surface of the Au thin film 50,62 with a nanoparticle thickness of approximately 23 nm. The deposition of the nanoparticles formed a multilayer system in the Kretschmann configuration, as shown in Fig. 1b.
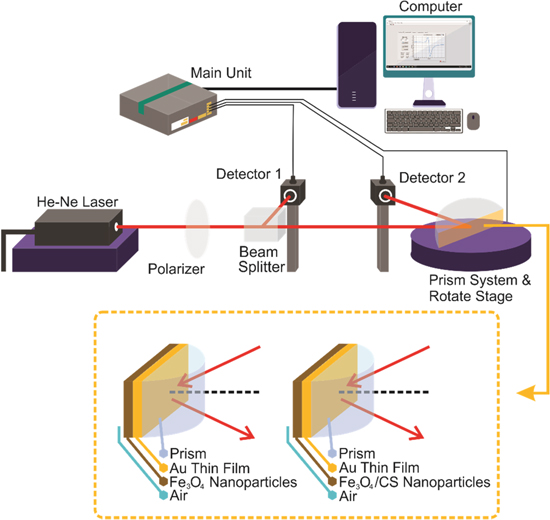
Figure 1. (a) Experimental setup for SPR spectroscopy and (b) Kretschmann configuration.
Download figure:
Standard image High-resolution imageResults and Discussion
Figure 2 shows the mechanism of Fe3O4 nanoparticle formation. The flavonoids and phenolic compounds contained in MO extracts may be responsible for reducing Fe(III) and Fe(II) ions and stabilizing the resulting Fe3O4 nanoparticles. Generally, the mechanism of green synthesis of nanoparticles is classified into three stages: the activation phase (reduction and nucleation), growth phase, and termination phase. 63 In the activation phase, Fe(III) and Fe(II) ions are suitably reduced by the large number of hydroxyl groups in flavonoids, which are rich in electrons. 64 When the hydroxyl groups interact with Fe ions, the flavonoids transform from the enol form to the keto form. Then, the reactive hydrogen atoms are released to reduce Fe ions, and nanoparticles are formed. After reducing the Fe ions, nucleation occurs, creating small nanoparticles. In the growth phase, the nanoparticles coalesce to form specific morphologies. In the termination phase, the nanoparticles attain their maximum activity until, finally, they have a stable shape and size. This phase is strongly affected by the stabilizing agents of the plant extracts.
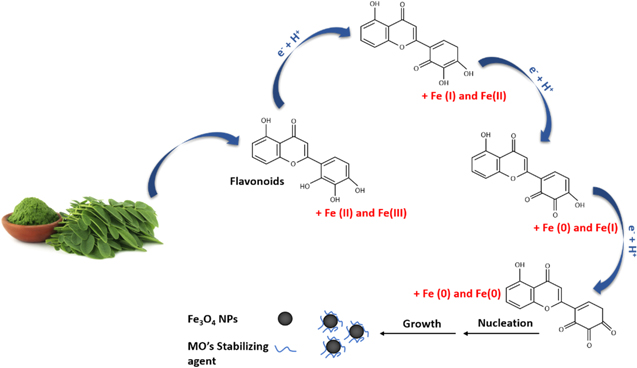
Figure 2. Mechanism of magnetite nanoparticles formation using Moringa Oleifera extract.
Download figure:
Standard image High-resolution imageFigure 3 presents the XRD patterns of the Fe3O4, FO/CS2, and FO/CS4 nanoparticles. The MAUD program was used to analyze the XRD patterns using the Rietveld refinement method. All nanoparticles showed the XRD pattern for Fe3O4. The Fe3O4/CS nanoparticles showed an extra phase of γ-Fe2O3 (maghemite). The brown-indexed peaks represent Fe3O4 (magnetite), whereas the peaks marked in orange represent maghemite. As shown in Fig. 3a, six characteristic peaks are observed corresponding to magnetite diffraction planes (220), (311), (400), (422), (511), and (440), and angles 2θ = 30.2°, 35.5°, 43.2°, 53.6°, 57.2°, and 62.7°, respectively. The analyzed XRD data were compared to the JCPDS database (PDF No. 01–075–0033), and revealed cubic inverse spinel structures. 65 In the diffraction patterns corresponding to FO/CS2 and FO/CS4, the typical diffraction peaks resemble magnetite, but with 9.8% and 12.4% maghemite, 32 respectively. The peaks at 23.8° (210) and 26.1° (211) depict the cubic structure of maghemite (JCPDS file No. 00–024–0081), and indicate that oxidation of Fe3O4 occurred due to the addition of CS and subsequent drying in the synthesis processes. 66 The reduction in the diffraction peaks after the addition of CS indicates that the magnetite surface was successfully modified by amorphous chitosan. 67 Nevertheless, the FO/CS2 and FO/CS4 nanoparticles maintained the crystal structure of Fe3O4 with the Fd3m space group. The average crystallite size of the nanoparticles was calculated using the Debye–Scherrer equation. 31 The crystallite size of the nanoparticles was estimated to be 7.2 nm, and it was 7.4 and 7.8 nm for FO/CS2 and FO/CS4 nanoparticles, respectively. The increase in crystallite size indicated the successful surface modification of Fe3O4 nanoparticles by CS.
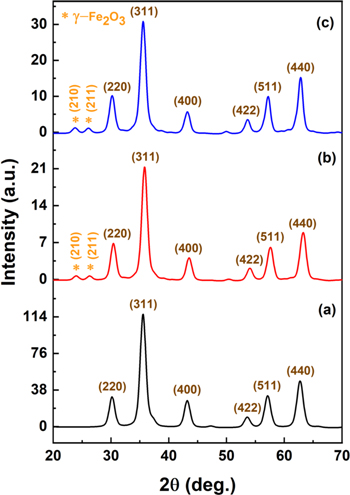
Figure 3. XRD pattern of (a) Fe3O4, (b) FO/CS2, and (c) FO/CS4 nanoparticles.
Download figure:
Standard image High-resolution imageThe TEM image and SAED pattern of the Fe3O4 nanoparticles are shown in Figs. 4a and 4b. The TEM image revealed that the size of the prepared sample was in the nanometer order, and the shapes of the nanoparticles were nearly spherical. This result indicated that the MO extract used for synthesis does not change the magnetite structure as reported in the literature. 68 However, magnetite nanoparticles were mostly agglomerated, which may be due to the van der Waals forces acting between nanoparticles with highly reactive surfaces because of their nano-size. Based on the SAED pattern in Fig. 4b, the diffraction rings of magnetite are consistent with the XRD results, which were indexed as (220), (311), (400), (422), (511), and (440). Hence, TEM analysis revealed the nearly spherical shape and cubic crystal structure of the green-synthesized Fe3O4 nanoparticles.
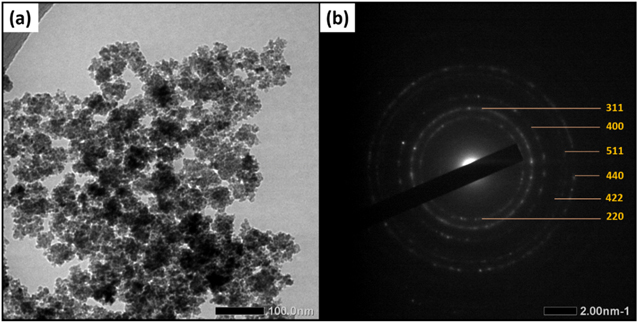
Figure 4. (a) TEM and (b) SAED images of Fe3O4 nanoparticles.
Download figure:
Standard image High-resolution imageFigure 5 shows the FTIR spectra of CS, Fe3O4, and FO/CS2 nanoparticles to confirm the formation of Fe3O4 nanoparticles and binding between Fe3O4 and CS. In the FTIR spectra of Fe3O4, two absorption bands at 578 and 1628 cm−1 were observed, indicating Fe−O and O−H stretching, respectively. 26 The spectra at 1080, 1391, 2924, and 3445 cm−1 in Fig. 5a revealed the characteristic peaks of CS, which demonstrated the vibrational stretching modes of the C−O−C, −C−O−, C−H, and O−H bonds, respectively. 69,70 The two peaks of the NH2 functional groups at 1561 and 1650 cm−1 corresponded to amine variation forms because of the degree of deacetylation. 71,72 In the FTIR spectra of Fe3O4/CS nanoparticles, the presence of the peak at 578 cm−1, which corresponds to the stretching of the Fe−O group, 73–76 indicated that CS successfully coated the surface of the Fe3O4 nanoparticles. In addition, shifts in the transmittance peaks of O−H, C−H, NH2, and C−O groups were observed at wavenumbers of 3425, 2923, 1627, and 1389 cm−1, respectively, indicating the interlinking between chitosan molecules and Fe3O4 nanoparticles. 77,78

Figure 5. FTIR spectra of (a) CS, (b) Fe3O4, and (c) FO/CS2 nanoparticles.
Download figure:
Standard image High-resolution imageFigure 6 shows the UV–vis spectra of the Fe3O4, FO/CS2, and FO/CS4 nanoparticles. The absorption spectrum of Fe3O4 nanoparticles showed a broad spectrum that covered the range of UV to visible light. 33,53,79 It can be seen from the graph that no SPR peak was observed in the absorption spectrum of the Fe3O4 nanoparticles. However, an insignificant absorption at 300–400 nm was observed, which may be attributed to a spin-flip Fe–Fe pair transition. 80 When the Fe3O4 nanoparticles were coated with CS, the UV–vis spectra showed a small absorbance peak at 215 nm for FO/CS2, and two small absorbance peaks at 205 and 215 nm for the FO/CS4 nanoparticles. The small peaks corresponded to the characteristic absorption bands of CS, indicating the presence of CS in the Fe3O4/CS nanoparticles. 81 Moreover, a shoulder band at a wavelength of approximately 377 nm was observed for the FO/CS2 nanoparticles, which shifted to 390 nm for FO/CS4 nanoparticles. The shift of the shoulder band toward a higher wavelength (red-shifted) was due to the quantum confinement effect, which was caused by an increase in Fe3O4 nanoparticle size. 82 This is confirmed by the XRD results, which showed that a larger crystallite size was observed for Fe3O4 nanoparticles coated with higher CS concentrations. Larger crystalline sizes can represent an increase in particle size.

Figure 6. UV–vis absorption of (a) Fe3O4, (b) FO/CS2, and (c) FO/CS4 nanoparticles.
Download figure:
Standard image High-resolution imageThe magnetization (M−H) curves of Fe3O4, FO/CS2, and FO/CS4 nanoparticles are shown in Fig. 7. The experimental (M−H) spectra were recorded at room temperature by varying the external magnetic field between ±15 kOe. It can be seen from the curves that the remnant magnetization and coercivity fields of the nanoparticles are almost zero. These results indicated that the nanoparticles exhibit superparamagnetic behavior. 74,83,84 The saturation magnetization of the Fe3O4 nanoparticles was found to be 54.1 emu g−1 and decreased to 42.3 and 28.3 emu g−1 for the FO/CS2 and FO/CS4 nanoparticles, respectively. These results indicated that the saturation value decreases proportionally with increasing CS concentration owing to the diamagnetic nature of CS, causing a decrease in the magnetic moment per unit mass. 85 The saturation magnetization obtained using Moringa oleifera is quite promising compared with the recently proposed green synthesis method for Fe3O4 nanoparticles employing different plant extracts (as listed in Table I).
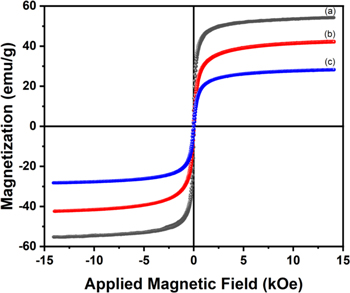
Figure 7. Magnetization curve of (a) Fe3O4, (b) FO/CS2, and (c) FO/CS4 nanoparticles.
Download figure:
Standard image High-resolution imageTable I. Magnetization comparison of the recently developed green synthesis method for the Fe3O4 nanoparticles.
| Synthesized by | Saturation magnetization (emu g−1) | References |
|---|---|---|
| Moringa oleifera | 55.5 | 47 |
| Garcinia mangostana | 49.8−73.2 | 41 |
| Aloe barbadensis | 52 | 42 |
| Myrtus communis L. | 58−72 | 43 |
| Salvia hispanica L. | 77.4 | 44 |
The SPR phenomenon was observed using systems in the Kretschmann configuration with the ATR method. Figure 8 shows the curve of reflected light versus the angle of incident light for six different systems: prism/Au/air, prism/Au/Fe3O4/air, prism/Au/FO-CS1/air, prism/Au/FO-CS2/air, prism/Au/FO-CS3/air, and prism/Au/FO-CS4/air. The SPR angle was indicated by the intensity dip in total reflected light, at which the reflectivity was at a minimum. 86 The SPR angle of the prism/Au/air system was 45.45°; after the Fe3O4 layer was added to the system, the SPR angle shifted to 45.62°. The SPR angle shift is caused by the change in the refractive index that surrounds the metal when nanoparticles are deposited on it. 87

Figure 8. SPR curves of bare Fe3O4 and Fe3O4/CS with different CS weight ratios.
Download figure:
Standard image High-resolution imageFurthermore, we investigated the SPR behavior of the system using Fe3O4/CS nanoparticles with varying CS concentrations. All systems using Fe3O4/CS nanoparticles showed higher SPR angle shifts than the system using uncoated Fe3O4. The SPR angles of the prism/Au/FO-CS/air system with varying CS concentrations on the Fe3O4 nanoparticles (FO-CS1, FO/CS2, FO/CS3, and FO/CCS4) were 45.66°, 46.16°, 46.50°, and 47.36°, with SPR angle shifts of 0.21°, 0.71°, 1.05°, and 1.91°, respectively, as shown in Table II. These results indicated that a higher CS concentration causes a proportional increase in the SPR shifting value. The SPR angle is affected by several factors, including the refractive index of the detected material. 88 Surface modification of the Fe3O4 nanoparticles using varying concentrations of CS affects the size of the nanoparticles, leading to a change in the refractive index of the nanoparticles, which in turn shifts the SPR angles. 32 As reported in the previous section, the modification of Fe3O4 nanoparticles with higher CS concentrations results in a larger crystallite size, representing a larger particle size of the nanoparticles. When the nanoparticles are deposited on the metal layer, it leads to a shift in the dispersion relation that changes the meeting point between the light and waves of SP, which in turn changes the SPR angle, 52,89 and the dielectric constant of the Fe3O4/CS nanoparticles affects the dispersion relation. Thus, SPR signal properties depend on the size of nanoparticles. 90
Table II. Angle and angle shift of SPR for different systems.
| System | SPR angle, θ (±0.01) (deg.) | SPR angle shift, Δθ (±0.01) (deg.) |
|---|---|---|
| Prism/Au/Air | 45.45 | 0 |
| Prism/Au/Fe3O4/Air | 45.62 | 0.17 |
| Prism/Au/(FO-CS1)/Air | 45.66 | 0.21 |
| Prism/Au/(FO-CS2)/Air | 46.16 | 0.71 |
| Prism/Au/(FO-CS3)/Air | 46.50 | 1.05 |
| Prism/Au/(FO-CS4)/Air | 47.36 | 1.91 |
In addition to the effect of particle size, the different surface densities of CS on the Fe3O4 nanoparticles, as illustrated in Fig. 9, also contribute to the change in the refractive index of the nanoparticles, causing a larger shift in the SPR angles. A previous study reported that the wavelength of the SP can be affected by the surroundings of the nanoparticles. When a medium with a refractive index larger than 1 surrounds nanoparticles, it causes the resonance wavelength to shift toward a longer wavelength, which affects the SPR angle. 91 Therefore, the SPR measurements showed that the SPR angle shift value of the Fe3O4/CS nanoparticles increased with increasing CS concentration. Furthermore, the modification of Fe3O4 nanoparticles with CS offers another excellent feature. CS is widely known as a biocompatible polymer that provides amino (NH2) and hydroxyl (OH) reactive groups (Fig. 9) that possess lone pairs of electrons. Electrons can interact with particular analytes via electrostatic interaction and chelation. 92 These distinctive characteristics are useful for detecting specific analytes. Hence, Fe3O4/CS nanoparticles offer an extra attraction that not only generates higher SPR signals but also has the potential to be applied as a material for sensor-based SPR.

Figure 9. Fe3O4-CS interaction and CS surface density impact on SPR angle.
Download figure:
Standard image High-resolution image
Conclusions
In this study, Fe3O4 and Fe3O4/CS nanoparticles with different weight percentages of CS were successfully synthesized using a green approach utilizing Moringa Oleifera extracts. The SPR properties of the nanoparticles, as well as their structure, morphology, and optical and magnetic characteristics, were investigated. The results showed that the surface of the Fe3O4 nanoparticles was successfully coated by CS. The nanoparticles had a crystallite size of 7 nm and a cubic inverse spinel crystal structure. The saturation magnetization of the Fe3O4 nanoparticles was 54.1 emu g−1, and the saturation decreased with increasing CS concentration. SPR measurements showed that the Fe3O4/CS nanoparticles exhibited larger SPR angles than the bare Fe3O4 nanoparticles. The chitosan polymer matrix layered on the surface of the nanoparticles caused a change in refractive index that resulted in an increase in the SPR angle shift. The maximum SPR angle was observed at 47.36° for FO/CS4, whereas it was a minimum for uncoated Fe3O4 at 45.62°, showing SPR angle shifts of 1.91° and 0.17°, respectively. The SPR angle enhancement using the green-synthesized Fe3O4/CS nanoparticles was comparable to that obtained in our previous study (chemically synthesized Fe3O4/CS nanoparticles, SPR angle shift of 4.08°). However, the synthesis method adopted in this study is environmentally friendly and reduces the use of hazardous chemicals in the synthesis process. All the results of this study indicated that using green-synthesized Fe3O4/CS as the active material in SPR offers an effective strategy for developing an environmentally friendly nanoparticle synthesis process and enhancing the SPR signal.
Acknowledgments
The authors would like to thank Prof. Takeshi Kato (Institute of Materials and Systems for Sustainability, Nagoya University, Nagoya, Japan) and Dr. Daiki Oshima (Department of Electronics, Nagoya University, Nagoya, Japan) for their advice, facility access in their laboratory for using vibrating sample magnetometer (VSM, Riken Denshi Co., Ltd.), and Nanang Adrianto (Department of Physics, Universitas Gadjah Mada) for discussing about surface plasmon resonance (SPR). This research was supported by the grant of Indonesia Collaboration Research (RKI) 2022 the Ministry of Education, Culture, Research & Technology, Republic of Indonesia and the Nanofabrication Platform Consortium Project of Nagoya University, Ministry of Culture, Sports, Science, and Technology (MEXT) Nano-Project Platform (Japan). The authors declare no conflict of interest.