
Abstract
The ever-increasing energy consumption has been projected to burden renewable energy sources. It is imperative to look for high-performance clean energy storage systems to sustain future energy demands. Among all the environmentally friendly and efficient energy storage options, supercapacitors are one of the most researched devices. Supercapacitors possess excellent electrochemical properties such as high-power density, superior cyclic stability, fast charging-discharging rates, and high specific capacitance that makes them a fascinating candidate. To improve the energy storage capacity, the two-dimensional counterpart of the supercapacitors is being investigated extensively and manifested unique electrochemical properties. This article thoroughly summarizes the synthesis and characterization techniques adopted for the most recent two-dimensional supercapacitor electrode materials. We focus on the family of carbon-based materials, transition metal oxides and hydroxides, MXenes, and transition metal dichalcogenides that can be employed for clean energy storage applications. The performance of these materials is discussed and compared based on their synthesis technique.
Export citation and abstract BibTeX RIS

This is an open access article distributed under the terms of the Creative Commons Attribution 4.0 License (CC BY, http://creativecommons.org/licenses/by/4.0/), which permits unrestricted reuse of the work in any medium, provided the original work is properly cited.
With the increasing global population and its dependence on depleting natural energy resources, the scientific community is focusing its attention on managing future energy demands. According to the International Energy Agency (IEA), a typical U.S. home has doubled its energy consumption since 1980, with projections that energy consumption will double by 2022 and triple by 2030. 1 The situation is critical as energy sources such as wind, solar power, and other renewable sources cannot sustain the ever-increasing future demands. Energy generation and storage are some of the most critical challenges of the 21st century. The continuous development of technological advances and global economic growth can be sustained only through the evolution of energy generation as well as energy storage systems.
Additionally, with environmental concerns, exploring clean energy sources is imperative for the development of human society. Pertinent to this, high-performance energy conversion and storage devices are essential to enable efficient, versatile, and environmentally friendly uses of energy. Among all the available options, lithium-ion batteries and supercapacitors are the two most critical devices being researched extensively for energy storage applications.
The fundamental differences between batteries and electrochemical capacitors regarding materials, structure, and mechanism drive their functions. While the battery stores energy chemically with higher energy density than a capacitor, it undergoes physical changes during the transitions between charged and discharged states. Contrary to that, a capacitor stores charge physically and do not undergo any significant physical change during transitions. This fundamentally results in different charge/discharge times for batteries and capacitors. The other key difference between these two technologies is based on the energy storage mechanism. Lithium-ion batteries are an established choice due to their superior performance, such as high energy density, high power density, long cycling time, low memory effect, and low self-discharge. 2–5 However, the development of lithium-ion batteries has attained a bottleneck due to multiple hurdles such as safety concerns, poor utilization of Li metal, high cost, convoluted chemical reactions, poor cyclic performance, and low rate capability. 6–11 Supercapacitors have gathered more attention than lithium-ion batteries due to their faster charge/discharge rates, higher power density, and longer lifetimes. 12,13 The advantages and disadvantages of supercapacitors and lithium ion batteries has been listed in Table I. 14 Although most of the cutting-edge research has been performed recently, Hermann von Helmholtz was the first to introduce the phenomenon of supercapacitors in 1879. 15 This phenomenon did not gain popularity until the General Electric Corporation patented the carbon-based electrolytic capacitors in 1957. 16 The technology developed furthermore with Standard Oil Company of Ohio patenting the first electric double layer capacitor for commercial purposes in 1966. 17 Finally, in 1978, it was marketed as a "supercapacitor" for applications in memory for computers. 18 Since then, many efforts have been made to develop this technology for multi-fold applications. Supercapacitors are highly reliable, as manifested by their use in state-of-the-art aerospace applications in Airbus 380, back-up power systems, digital communications, pacemakers, airbags, and hybrid electric vehicles. 11,19,20
Table I. Advantages and disadvantages of supercapacitors and lithium ion batteries.
| Category | Advantages | Disadvantages |
|---|---|---|
| Supercapacitors | High power density | Low energy density |
| Long cycle life | ||
| Fast charging speed | ||
| Good low temperature performance | ||
| High current discharge ability | ||
| Super low temperature characteristics | ||
| Simple charging and discharging circuit | ||
| Convenient detection | ||
| Lithium ion battery | High working platform | High cost |
| High energy density | Cannot discharge large current | |
| Long cycle life | Need over-charge and over-discharge protection | |
| Fast charge and discharge | ||
| Good safety performance, no pollution, and no memory effect | Line control | |
| Small self-discharge | ||
| Large temperature range |
Over the past few years, extensive studies have been performed reflecting on the importance of supercapacitor devices for future energy storage systems. Figure 1 shows the number of published articles on the topic of supercapacitors in the past decade.

Figure 1. The number of published articles on supercapacitors in the last decade. The data was collected from google scholar by searching the keyword "supercapacitor."
Download figure:
Standard image High-resolution imageElectrochemical capacitors (ECs), also known as ultracapacitors or supercapacitors, can be classified as pseudocapacitors and electrochemical double-layer capacitors based on the energy storage mechanism. Capacitance generation in a supercapacitor results from two occurrences, the formation of an electrical double layer at the electrode/electrolyte interface or the near-surface Faradaic charge transfer between electrolyte ions and electrode materials. 1 As a result, charge storage is fast in supercapacitor. However, the major drawback of supercapacitors is their inherent low energy density due to the use of electrode surface or near-surface only.
These limitations are the foundation for driving research interests to develop novel electrode materials with high energy density. Besides high energy density, it is also essential to consider rate capability and cycle stability in designing high-performance supercapacitor electrodes. Besides, the toxicity and cost of the electrode material are also crucial factors to consider. Overall, to realize a high-performance supercapacitor electrode, factors of paramount importance are as follows:
- (1)Surface area—Since supercapacitors store charge on the surface of the electrode, superior specific capacitance can be achieved using an electrode with a higher surface area. The surface area of the electrode material can be engineered using nanostructures.
- (2)Conductivity—Electronic and ionic conductivities influence the specific capacitance and rate capability. A high electronic and ionic conductivity will also ensure the rectangular nature of cyclic voltammetry curves and symmetric galvanostatic charging-discharging curves. Electronic and ionic conductivities can be enhanced by precise electrode design and pore size control.
- (3)Stability—The electrode material's mechanical and chemical stability significantly affects the cycle stability. Along with the investigation of new electrode materials, the electrode designs with nanostructures pave a robust foundation for accomplishing high-performance supercapacitors.
While a plethora of materials has been investigated, recently, two-dimensional (2D) materials have gained significant attention as supercapacitor electrode materials due to their extraordinary physicochemical properties. The intrinsic high surface area and unique electrical properties of atomically thin sheets of 2D materials are attractive for capacitive energy conversion and storage. 21–23 2D materials hold high potential for applications in electronic devices, sensors, catalysts, energy conversion, and energy storage due to their excellent electrical, optical, chemical, and thermal properties. 24–27 Extensive efforts are being made to develop 2D materials, focusing on the design and fabrication of effective electrode materials for energy conversion and storage. Additionally, the capability of engineering 2D materials with unique morphologies and properties makes them attractive candidates to tune the supercapacitor performance.
Carbon-based materials such as graphene, carbon nanotubes, carbon nanosheets, activated carbon, and non-porous carbon have continued to fascinate scientists for energy storage over the past decade. 28–32 Graphene analogous boron carbon nitride (BCN) nanomaterials with high surface activity and tunable electrochemical properties have emerged as next-generation energy storage materials with high specific capacitance, excellent rate capability, and outstanding durability. 33–36 Two-dimensional transition metal oxides and hydroxides (TMOs and TMHs) are revolutionizing the field of energy storage owing to their high theoretical specific capacitance, abundant in nature, a plethora of active electrochemical sites as well as the feasibility of forming hierarchical structures by integrating with other materials such as graphitic carbon. 37 Even though TMOs/TMHs have intrinsically low conductivity, their atomic thickness shortens the ion diffusion path and reduces the ion diffusion resistance, making them inept for high-rate performance. However, designing TMOs and TMHs in the form of 2D nanostructures allow a significant transformation to their inherent properties. These nanostructures have resulted in high conductivity, effortless ion diffusion, and enhanced mechanical integrity. 38–40 Additionally, hierarchical structuring of TMOs/TMHs with other low dimensional materials can overcome the agglomeration of nanosheets and improve the performance of different electrode materials to boost the overall performance of the supercapacitor device.
MXenes, which belongs to the family of 2D metal carbides, nitrides, or carbonitrides, has evolved as a promising candidate for transparent supercapacitor electrode material. This has been primarily associated with its remarkable electrical conductivity due to its electrochemically active surfaces, fast ion diffusivity due to its stacked morphology, good hydrophilicity due to the presence of surface hydroxyl groups, and large interlayer spacing. 41–43 MXene proves to be a unique member of the 2D family of materials since the interlayer spacing can be effectively controlled and the possibility of insertion of spacers to avoid restacking of the MXene sheets. 44 Furthermore, MXenes are environmentally friendly and exhibit outstanding biocompatibility for electrochemical biosensors. The synthesis technique and the method incorporated to fabricate the MXene sheets considerably impact its properties. 45
Beyond graphene, there is a broad spectrum of 2D materials with a primary focus on 2D transition metal dichalcogenides, as evidenced by the literature's publication record. 46 Unlike graphene, many 2D TMDs are semiconducting and can be designed into ultra-small and low power transistors in the state-of-the-art ever-shrinking silicon technology. 47 2D TMDs display unique electrical and optical properties that emerge due to the quantum confinement and surface effects during the transition from indirect to direct bandgap when bulk materials are scaled down to monolayers. 48 What makes TMDs distinctive is the van der Waals gap between each neighboring layer, the large surface area, and variable oxidation states make them highly attractive for both EDL and Faradaic charge storage mechanisms. 49,50 The properties of TMDs are determined by their phases, which are different bonding and configurations. Phase engineering has resulted in extraordinary electrochemical performance and high operational voltage windows. 51
Many reviews have been published on supercapacitor electrode materials in the past decade. These articles mainly reviewed the electrode material properties and applications, with a majority of articles focusing on carbon electrodes such as carbon nanotubes, graphene and C/metal oxides. However, these reports lack a comprehensive analysis of the influence of synthesis techniques on the performance of supercapacitor electrodes. With the increasing demand for supercapacitor devices, it is crucial to understand the influence of synthesis techniques to identify the uniqueness of electrode materials, which will expose novel properties leading to additional innovations. As a result, this article mainly focuses on the synthesis and characterization techniques of recent 2D materials, which show exceptional potential for supercapacitor applications. Contemporary 2D materials belonging to the families of carbon, TMOs/TMHs, MXenes, and TMD are summarized with strategies in design and synthesis for optimizing the electrochemical performance of these electrodes for energy storage applications. The performance of supercapacitor electrode materials and their stability are reported and compared based on the synthesis technique adopted.
Carbon Based Electrodes
Activated carbon
Carbon is one of the most frequently used materials for energy storage applications. The flexibility of manufacturing carbon electrodes in several morphologies ranging from 0D to 3D nanostructures as spheres, rods, sheets, and foams, respectively, makes them widely popular for tuning their properties based on the structure. Even though the general trend is that the specific capacitance is directly proportional to electrode surface area, the case with carbon electrodes is notably different. Carbon morphologies with a lower surface area are reported to exhibit higher specific capacitance than morphologies with a larger surface area. 52,53 Numerous efforts have been dedicated to producing tailored porous carbon electrodes, including activated carbons, 54,55 carbon aerogels, 56,57 graphene, 58,59 carbon nanotubes, 60–63 carbon nanofibers 64–67 and nano carbons for enhancing the energy storage mechanism. 68,69 Activated carbon is one of the critical materials explored for supercapacitor applications owing to its high specific surface area between 1000–2000 m2g−1 and relatively low cost. 13,31 In recent years, many researchers have successfully synthesized activated carbon for electrochemical energy storage systems from bio-waste for sustainable development. 70–72
For high-performance supercapacitors, it is not only essential to design activated carbon with a large number of pores to accumulate the electrolyte ions, but it is equally essential to make the porous structure compatible with the electrolyte ion. In recent years, there has been rapid development of activated carbon electrodes from bio-waste materials towards environmentally friendly synthesis. Fu et al. attempted to synthesize high-performance activated carbon electrodes from economic and green abandoned seafood waste. 73 They reported a multi-hierarchical porous activated carbon electrode using the crab shell as a precursor, which exhibited specific capacitances of 322.5 F g−1 and 223.4 F g−1 at current densities of 1 and 10 A g−1, respectively. These supercapacitors showed remarkable cyclic stability with less than 1% capacitance fading over 10000 cycles at 1 A g−1. Figure 2 shows the synthesis process of activated carbonized carbon shells synthesized in this study. The crab shell was subjected to cleaning to remove impurities, followed by drying, crushing, grinding, and carbonization. The ground crab shell was heated at 500 °C for 1 h in a tube furnace in the presence of high purity nitrogen gas. The dark solid product obtained, shown in Fig. 2, was denoted as carbonized crab shell (C-CS). To remove traces of MCO3, the product was mixed with 10% HCl solution, stirred for 2 h, and finally washed with ultra-pure water till neutralization. This process was followed by drying the product at 80 °C. Subsequently, the sample was subjected to KOH treatment for 24 h and dried at 100 °C overnight. Finally, the mixture was heated to 600 °C, 700 °C, 800 °C for 1 h in the presence of nitrogen gas to achieve the activated C-CS (A-C-CS).
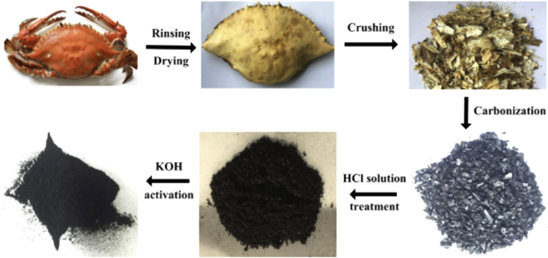
Figure 2. Illustration of the synthesis process of activated carbonized crab shell.
Download figure:
Standard image High-resolution imageSEM, TEM, and XRD were performed to identify A-CS samples' morphology and crystalline structure obtained at different heating temperatures. The morphology of the samples displayed a strong correlation with the activation temperature, indicating evidence of increased porous structure. Figure 3h shows that the samples displayed macropores and micropores, and mesopores. Figure 3i shows that all samples demonstrated a single diffraction peak at 25° and no trend in crystallinity with an increase in activation temperature. The superior electrochemical performance of these activated carbon electrodes was attributed to the formation of macropores, micropores, and mesopores, resulting in a larger surface area and shorter ion diffusion paths.
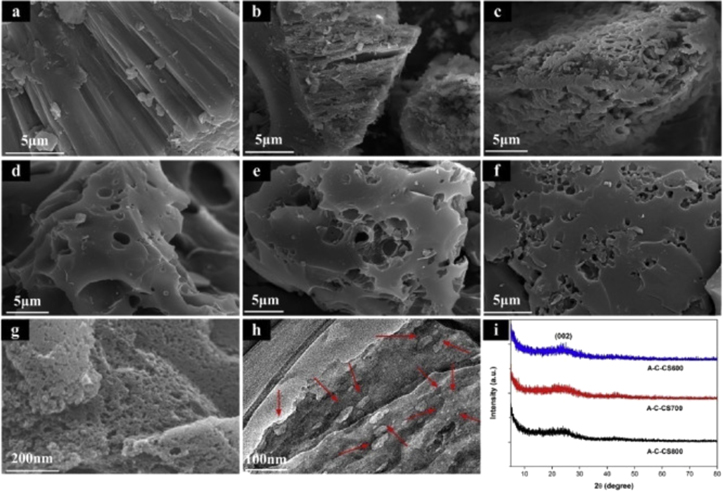
Figure 3. SEM images of (a) CS, (b) C-CS, (c) HCl treated C-CS, (d) A-C-CS obtained at 600 °C, (e) A-C-CS obtained at 700 °C, (f) A-C-CS obtained at 800 °C, (g) high magnification SEM image of A-C-CS obtained at 700 °C, (h) high magnification TEM image of A-C-CS obtained at 700 °C, (i) XRD patterns of A-C-CS.
Download figure:
Standard image High-resolution imageMultiple reports have emphasized sweet corn husk as a promising precursor for high operating voltage supercapacitors. 74,75 Activated carbon electrodes devised from a corn husk precursor in a two-step carbonization process and activation exhibited higher energy density than conventional supercapacitors. 76 The carbonization was performed by heating the dried corn husk at 1000 °C for 1 h in an inert atmosphere. This was followed by activation using varying amounts of KOH (1:1 and 1:4 wt ratio) solutions. The resultant mixture was sonicated for 2 h, dried in a hot air oven at 105 °C, and exposed to heat treatment at 800 °C for 2 h in an argon atmosphere. The activated carbon materials were washed with DI water and dried overnight in the oven at 60 °C. The electrochemical studies were performed using an organic electrolyte (1 M tetraethylammonium tetrafluoroborate (TEABF4) in acetonitrile (AN)) in an operating voltage window of 0V–2.7V. The resulting activated carbon electrodes displayed a specific capacitance of 80 F g−1 at 1 A g−1 current density, good cyclic stability of 90% capacitance retention after 5000 cycles, high energy density of 20 Wh kg−1, and power density 681 W kg−1. This superior performance of activated carbon electrode was associated with a high specific surface area of 1378 m2 g−1, increase in the mesoporous volume due to the two-step synthesis process, and formation of layered morphology due to the exfoliating nature of KOH.
Surya et al. also successfully attempted to synthesize novel hierarchical porous activated carbon electrodes from corn husk, which exhibited using chemical activation of KOH, which revealed and measured the electrochemical performance in acid electrolytes. 77 The preparation steps are shown in Fig. 4 adopted carbonization of dried corn husk in a furnace at 400 °C for 3 h in argon ambiance. The carbon powder obtained from the carbonization process was then chemically activated using KOH in a 1:3 weight ratio by mixing the additives at 600 °C for 1 h in the presence of argon. The activation temperature for the carbonized sample was set to 500 °C, 600 °C and 700 °C to understand the disparity in electrochemical performance. The activated corn husk processed at 600 °C exhibited a specific capacitance of 314.83 F g−1 at 1 mV s−1 in 0.5 M H2SO4, with high stability over 2000 cycles. The high specific capacitance values of activated corn husk up to 600 °C was accredited to fast ion transfer in well-developed micro and mesoporous electrode structure. These symmetric capacitors also displayed high energy and power density of 9.85 Wh kg−1 and 7185 W kg−1, respectively, thus verifying its potential as a cheap, abundant, and green electrode material for supercapacitors.
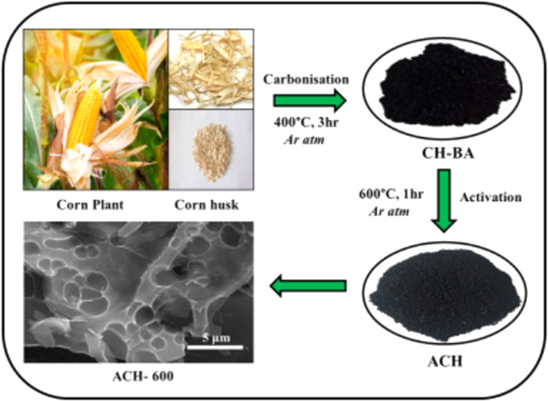
Figure 4. The synthesis process of activated carbon electrodes for supercapacitor from corn husk precursor.
Download figure:
Standard image High-resolution imageRoy et al. demonstrated a facile method to fabricate activated carbon nanosheets (ACNSs) comprised of hierarchical porous carbon materials by using banana leaves as a precursor. 78 Activated carbon was extracted from banana leaves using the pyrolysis technique, as shown in the figure. The naturally dried banana leaves were cleaned with DI water and dried at 80 °C for 24 h in an electric oven followed by pulverization in a blender. The dried mass was mixed with an activating agent (K2CO3) in a ratio of 1:2. This mixture was subjected to various steps of pyrolization. The mixture was first heated to 750 °C at a rate of 10 °C min−1, maintained at this temperature for 5 h, and then cooled at the rate of 5 °C min−1 in a tube furnace in the presence of nitrogen gas. The carbonized samples were then cleaned with 0.5 M HCl and DI water, followed by further drying in an electric oven at 80 °C for 12 h to obtain activated carbon nanosheets. Figure 5 shows the steps adopted during the pyrolysis technique to obtain activated carbon from banana leaves. These ACNSs exhibited a maximum specific capacitance of 190 F g−1 in ionic liquid 1-butyl-3-methylimidazolium hexafluorophosphate electrolyte. The specific capacitance values of ACNSs from banana leaves were higher than the specific capacitance values of ACNSs obtained from other natural sources such as rice husk, 79 cauliflower, 80 and orange peel. 81 This high specific capacitance value was attributed to the well-organized porous structure of the electrode saturated by the electrolyte ions for facilitating the electric double layer formation.

Figure 5. Preparation of activated carbon nanosheets from banana leaves using pyrolysis technique.
Download figure:
Standard image High-resolution imageFurthermore, these ACNSs demonstrated high specific energy and specific power of 59 (Wh kg−1) and 750 (W kg−1), respectively. It is sporadic to see such outstanding results from activated carbon-based electrodes synthesized from biomass precursors. As a result, ACNSs developed from banana leaves offer attractive prospects for industrial energy storage applications.
Boron carbon nitride (BCN)
2D sheet of carbon popularly known as graphene, discovered by Andre Geim and Konstantin Novoselov in 2004, has been a major fascination of the scientific community for energy storage applications. 82,83 Graphene attains extraordinary properties due to its sp2 carbon hybridization, such as astounding strength, unprecedented thermal conductivity, and high electrical conductivity. Graphene has been widely explored for energy storage applications with a theoretical maximum specific surface area of 2600 m2g−1 and maximum specific capacitance of 550 F g−1. 84 Analogous to graphene, 2D layered nanostructures of boron carbon nitride (BCN) materials have gained considerable attention over the past decade owing to their unique electrical and physical properties. 85 With graphene exhibiting excellent properties for energy storage, the curiosity led to research and development on graphene analogous BCN nanomaterials. Typically, graphene is doped with N and B heteroatoms to form BCN structures with tunable electronic and electrochemical properties. 86,87 BCN nanomaterials have proven to be multifunctional with applications in supercapacitors, 88–91 lithium-ion batteries, 92,93 electrolytic and photocatalytic catalysts, 94–96 nano-biotechnology, and nanomedicine field. 97–99 Recently, several efforts have been made to synthesize clean 2D BCN structures for energy storage applications.
2D BCN structures are synthesized using many techniques such as solid-state reaction, 100 microwave plasma CVD, 101 thermal catalytic reactions. 102 Sreedhara et al. reported the synthesis of BxCyNz nanosheets by reacting a few layers of exfoliated graphene with boric acid and urea at 900 °C in the presence of nitrogen. 86 The proportion of boric acid and urea was varied to obtain different compositions of BxCyNz. The molar ratio of boric acid and urea was varied from 1:100 to 1:25, while the exfoliated graphene was maintained constant. Using this technique, the composition of the resulting BCN was recorded to be B0.06 C0.73 N 0.21 (BCN-1), B0.13 C0.49 N0.38 (BCN-2), B0.26 C0.22 N0.52 (BCN-3) using XPS characterization. BCN-1, BCN-2, and BCN-3 samples' electrochemical performance was performed using cyclic voltammetry, galvanostatic charge-discharge curves, and electrochemical impedance spectroscopy. Figure 6 shows the cyclic voltammetry curves of BCN samples measured at 40 m V s−1. BCN-3 exhibited the largest curve area due to high contents of N and B. It is important to note that BCN-3 also displayed excellent electrochemical stability over a wide scan range of 5–100 mV s−1. The discharge time of BCN-3 was significantly longer than the other samples, thus showing remarkable energy storage capability. The specific capacitance of exfoliated graphene, BCN-1, BCN-2 and BCN-3 was measured to be 162, 251, 261 and 306 F g−1 at 0.2 A g−1. Figure 6d shows that BCN-3 exhibited good stability and higher specific capacitance of 225 F g−1 at a current density of 5 A g−1 which was the highest observed in this study, thus demonstrating potential applications in energy devices.
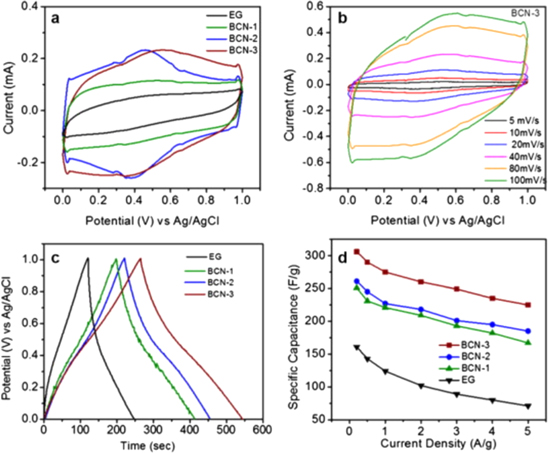
Figure 6. (a) Cyclic voltammetry of BCN samples (b) CV curves of BCN-3 sample at scan rates between 5–100 mV s−1 (c) galvanostatic charge-discharge curves at a current density of 1 A g−1 (d) specific capacitance of BCN-1, BCN-2, and BCN-3 samples in comparison with exfoliated grapheme.
Download figure:
Standard image High-resolution image2D BCN synthesized by facile one-step pyrolysis method from orange peel extract exhibited immense potential as a supercapacitor electrode for energy storage and as an electrochemical sensor material to detect L-3,4-Dihydroxyphenylalanine (Levodopa, L-DOPA), which is used in Parkinson's disease treatment. 103 Orange peel wastes were dried at 60 °C in an oven for 24 h, followed by heat treatment in argon at 600 °C in a tube furnace, and pyrolyzed at 800 °C in the presence of carbon dioxide to achieve activated carbon. Synthesis of BCN was performed using a stoichiometric ratio of activated carbon, urea, and boric acid in DI water. The mixture was heated, dried, and then carbonized for 3 h from 700 °C to 900 °C in an argon atmosphere. Finally, BCN was obtained after treatment with HCl and overnight drying at 60 °C in the oven. Figure 7 shows the detailed mechanism of the synthesis process of BCN used in this study. The BCN electrodes displayed a specific capacitance of 391 F g−1 at a scan rate of 5 mV s−1. The BCN electrode retained its specific capacitance of 45 F g−1 even at a high scan rate of 200 mV s−1, thus exhibiting good stability. This stability was attributed to the complete release of electrochemical capacitance upon activation. The modified BCN electrode exhibited linear response over 0.2–160 μM of L-DOPA concentrations up to a detection limit of 0.14 μM in pharmaceutical formulations and spiked human urine. Thus, BCN electrodes developed from orange peel precursor attract multipurpose applications in supercapacitors and detect Levodopa in commercial formulations and human urine.

Figure 7. Mechanism of synthesis of BCN from the orange peel as a precursor.
Download figure:
Standard image High-resolution imageThe growing demand for miniaturized and wearable electronic devices has led to the rapid development of flexible microelectronics. Hybrid electrodes are more popular for micro-supercapacitors (MSCs) applications as they offer mechanical stability and high energy density. Traditional techniques of fabricating planar MSCs such as photolithography and wet etching are not compatible with flexible substrates. Karbhal et al. reported laser scribed BCN microelectrode on flexible ITO/PET (Indium Tin Oxide/Polyethylene Terephthalate) sheet to overcome this limitation PVS-H2SO4 electrolyte. 104 BCN was synthesized from a solution of boric acid, glucose, and cyanamide (1:1:1) dissolved in distilled water. The solution was heated to 70 °C to form a thick paste and then further exposed to heat treatment at 900 °C for 3 h in an argon atmosphere in a tube furnace. To compare the electrochemical performance of varying doping levels, multiple BCN samples were prepared by varying the molar ratio of boric acid, glucose, and cyanamide. The ITO/PET substrate was coated with a slurry consisting of 80 wt% BCN electrode, 15 wt% of conducting carbon, 5 wt% of polyvinylidene fluoride as a binder and N-methyl-2-pyrrolidone. The slurry was dried at 100 °C in a vacuum oven overnight. The as-prepared film was scribed on the substrate using a CO2 laser to form interdigitated electrodes. Figure 8 shows the schematic of the synthesis of BCN electrodes and fabrication of a flexible MSC device. The BCN MSC device thus fabricated exhibited a specific capacitance of 72 mF cm−2, which is higher than that reported for graphene or CNT-based MSCs. The BCN-MSCs also displayed excellent stability up to 80000 cycles with intermittent bending performed ∼1500 times at an angle of 150°. BCN-MSCs show extraordinary potential towards next-generation flexible energy storage devices with their unique chemical and physical properties.
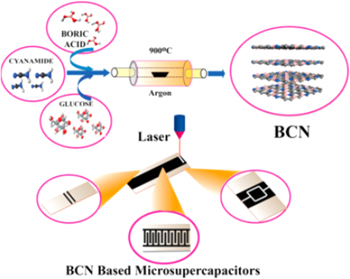
Figure 8. Schematic representation of BCN synthesis from boric acid, glucose, and cyanamide, and fabrication of flexible BCN MSC.
Download figure:
Standard image High-resolution imageTowards developing high-performance MSCs for future energy storage devices, Zhang et al. synthesized a novel 2D BCN nanomesh (BCNN) from a gel precursor of milk powder and boron oxide. They achieved an increase in aerial capacitance by tailoring defects and atomic contents of BCNN. 105 30g of boric acid was stirred with 200 ml hot DI water for 1 h before adding milk powder. The solution was heated at 90 °C to form a milk-boric acid sol-gel. The sol-gel was heated to remove residual water. The dried sol-gel was sintered at 700 °C to 900 °C for 1 h in the presence of nitrogen to obtain activated carbon. It was further refluxed thrice with DI water to remove excess of boric acid from the carbonized material. The achieved samples were designated at BCNN700, BCNN800, and BCNN900 based on the carbonization temperatures. The MSC fabrication was performed by first obtaining BCNN film by vacuum filtering 50 ml BCNN solution on cellulose paper and drying it in an oven at 60 °C. The BCNN film was coated with a 20 nm gold layer. The microelectrodes were formed using laser cutting and assembled on thin PET films to form BCN-MSCs. By tailoring defects and atomic contents of BCNN through the synthesis process, the BCNN900 exhibited remarkable capacitance and energy density of 80.1 mF cm−2 and 67.5 mWh cm−3, respectively. These values are considerably higher than the commercially used on-chip lithium thin-film batteries and most other carbon-based MSCs. This performance boost was attributed to the synergistic effect of pores, boron, and nitrogen doping and defects of BCNN.
The final mixture annealing time and temperature have been indicated in the Table II.
2D Transition Metal Oxides (TMOs) and Transition Metal Hydroxides (TMHs)
Although supercapacitor electrodes were designed initially using carbon-based materials due to their excellent electric conductivity, large surface area, and easy accessibility, they suffer from the low specific capacitance in the range of 62.2–347 F g−1. 106–115 The performance of supercapacitors is governed by ion diffusivity occurring at the separator and electrode interface, which is clarified using equation 116

Where τ denotes the diffusion time, λ signifies the ion/electron diffusion length, and Di represents the ion diffusion coefficient. Diffusion time can be significantly reduced by slicing the bulk material into its 2D counterpart, promoting a faster and shorter diffusion path for ions enabling higher specific capacitance. 117 It is imperative to shift towards new generation 2D active pseudo capacitor materials like TMOs and TMHs, 118–120 which show promising advantages like large specific surface area, reduced ion diffusion time, high specific capacitance, excellent mechanical flexibility, and better electrochemical performance as compared to the bulk form. 37,121 In the following section, the most commonly used supercapacitor electrode materials like noble (Ruthenium Oxide), low cost and widely available TMOs and TMHs (Manganese Oxide, Nickel Oxide, and Hydroxide, and Cobalt Hydroxide) have been discussed.
2D Ruthenium Oxide (RuO2)
RuO2 has been one of the first TMOs used as supercapacitor electrodes due to its high theoretical specific capacitance (1450 F g−1) with an exceptional life cycle, high electron conductivity, and superior electrochemical reversibility. 122,123 However, the use of RuO2 in its pristine form as the electrode material has deteriorated in recent years due to the following reasons. Firstly, due to continuous charging and discharging cycles, oxides accumulate at the grain boundaries, which easily peel off from the electrode surface. 124 This significantly reduces its gravimetric capacity over time. Secondly, since ruthenium is scarce and costly, the use of RuO2 in its pure form as the electrode material finds few practical applications in supercapacitors. 125 To mitigate the problems mentioned earlier, RuO2 based metal oxide nanocomposites, RuO2 based Carbon nanotube (CNT) nanocomposites, RuO2 based graphene binary composites, RuO2 based conducting polymer nanocomposite have been discovered. 124,126
RuO2 based metal oxide nanocomposites
Amongst all the metal oxides, Titanium Oxide (TiO2) is preferred due to its abundance, low-cost nature, and high chemical stability. To improve the cost and utilization efficiency of RuO2, Xie et al. have made use of a porous, highly-ordered, and high surface area TiO2 nanotube array as the electrode substrate material, as shown in Fig. 9a. 127 FESEM images shown in Figs. 9b, 9c depict the TiO2 nanotube array grown on the Ti foil that supplies a large surface area to promote electrochemical activity. RuO2 nanoparticles are grown on the walls of the nanotube array. Electrochemical anodization of Ti metal was first carried out in a mixture containing ammonium fluoride, ethylene glycol, and phosphoric acid, which was further calcinated to prepare TiO2 nanotubes. RuO2 nanoparticles were filled into the TiO2 nanotube array by differential pulse and cyclic voltammetry. This was followed by electro-reduction, electro-oxidation, and heating to promote electro-activity of RuO2 and ultimately prepare the RuO2-TiO2 nanotube array. The galvanostatic charge-discharge curves of the RuO2-TiO2 nanotube array, shown in Fig. 9d, conducted at 0.2 mA cm−2 in 1.0 M H2SO4 electrolyte, showed a high specific capacitance of 39.6 mF cm−2 denoting exceptional electroactivity. The supercapacitor arrangement shown in Fig. 9e consists of RuO2-TiO2 nanotube array used as the cathode, porous carbon used as the anode, and an electrolyte consisting of a mixture of H2SO4 and polyvinyl alcohol polymer gel used as an electrolyte was able to achieve a high specific capacitance of 16.06 mF cm−2, a high energy density of 0.029 mW h cm−2, and capacitance retention of 78.9 % of the initial value after 1000 cycles.
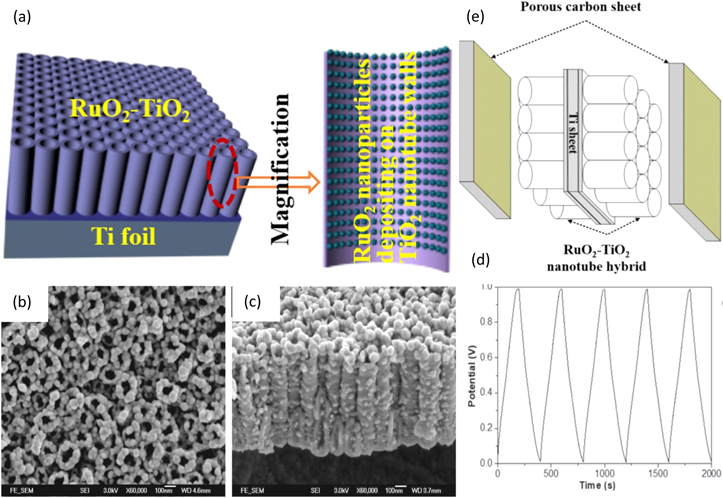
Figure 9. (a) Schematic diagram of the microstructure of RuO2-TiO2 nanotube hybrid on Titanium foil, (b) Schematic diagram of RuO2-TiO2 supercapacitor assembly, (c), (d) FESEM images of RuO2-TiO2 nanotube hybrid, and (e) GCD curve of RuO2-TiO2 nanotube hybrid.
Download figure:
Standard image High-resolution imageLeng al. have combined the advantages of a conductive matrix of flexible and porous graphene, excellent conductivity, chemical and thermal stability of RuO2, and high surface area of TiO2 to synthesize graphene–RuO2–TiO2 nanocomposites using a hydrothermal process. 128 RuCl3 and TiCl3 with Ru/Ti = 3/1 as the mole ratio were dissolved in water. The resultant solution was then mixed with graphene oxide dispersion, named GRT1. Samples prepared using the same procedure but different molar ratios of Ru/Ti (1:1 and 1:6) were named GRT2 and GRT3, respectively. The synthesis process has been illustrated in Fig. 10a. Reduced graphene oxide (RGO), graphene-TiO2 (GT), and graphene-RuO2 were also prepared using the same procedure for comparison purposes. The XRD patterns of GRTs are shown in Figs. 10b, 10c. The peaks labeled 1 belong to rutile RuO2, and those labeled 2 belong to anatase TiO2. It is quite evident that GRT1 has low-intensity TiO2 peaks suggesting slow TiO2 crystal growth due to adsorption of Ru on the Titanium Hydroxide (TiH4O4) surface. As the molar ratio was increased, the Ti content in the GRT increased, thereby noticeably increasing the anatase peak intensities. C=C (sp2 hybrid C) peak from graphene can be seen across the FTIR spectra of the GRTs at 1621 cm−1. The O–H bond at 3425 cm−1 was more prominent for GRT2 and GRT3, suggesting stronger hydroxyl vibration. This suggested the increased presence of hydroxyl groups on the TiO2 surface and comparatively less existence on the RuO2 surface. Minor peaks pertaining to the C–O peak at ∼1000–1260 cm−1 and C=O peak at 1715 cm−1 were also present. The SEM images are shown in Figs. 10d, 10e suggested the presence of RuO2-TiO2 nanodots on the graphene surface. The prominence of these nanodots increases with the Ti content in the molar samples. The curved veil-like morphology of graphene is consistent with all the GRTs.

Figure 10. (a) Schematic representation of the formation of GRT, (b) XRD pattern of GRT, (c) FTIR pattern of GRT, SEM image of (d) GRT1 and (e) GRT2, (f) CV curve of GRT, (g) GCD curve of GRT, and (h) cycle performance of GRT.
Download figure:
Standard image High-resolution imageGRT1 and GRT2 showcased better reversibility, superior mass transport, and smooth electron conduction, which can be inferred from Fig. 10f based on their close to ideal CV curves encompassing a larger area. Since GRT3 had a comparatively higher TiO2 content, the CV curve of GRT3 deviates from the ideal behavior. This resulted in larger equivalent series resistance. From the GCD curves shown in Fig. 10g, it was noticed that GRT1 exhibited the highest specific capacitance of 396.5 F g−1, followed by GRT2 at 282.4 F g−1, and finally, GRT 3 manifested a specific capacitance of 216.7 F g−1. GRT1 and GRT2 take advantage of their extremely low internal resistance by demonstrating ∼95% capacitance retention after 1000 cycles at 0.1 A g−1, as shown in Fig. 10h.
RuO2 based conducting polymer nanocomposite
The incorporation of polymers into RuO2 has recently attracted a lot of attraction owing to enhanced supercapacitor performance. 126 Conducting polymers are known to be a good candidate for supercapacitor electrode material. However, their application is restricted by short cycling life. Conducting polymer composites demonstrates unique physiochemical properties, which can be used as an electroactive material that exhibits exceptionally high specific capacitance. The chemical bath deposition (CBD) method was carried out by Deshmukh et al. to deposit polyaniline-RuO2 (PANI-RuO2) composite thin films on stainless steel substrate. 129 The polymerization process obtained PANI solution by mixing H2SO4 solution, aniline monomer, and ammonium persulphate (APS). Stainless steel substrate was immersed in PANI, aqueous RuCl3, and APS solutions. Thin layers of RuO2 with a thickness of 0.12 mg cm−2 covering PANI clusters were deposited on the substrate. This growth mechanism has been schematically illustrated in Figs. 11a, 11b.
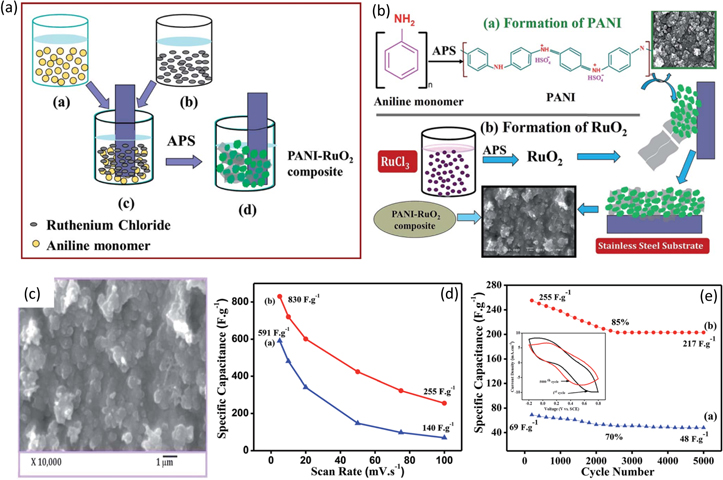
Figure 11. (a) Schematic illustration of CBD method for synthesis of PANI-RuO2 thin films, (b) schematic illustration of the growth mechanism of PANI-RuO2 thin films, (c) SEM image of PANI-RuO2 thin films, (d) variation of specific capacitance with a scan rate of PANI (blue curve) and PANI-RuO2 (red curve), and (e)specific capacitance retention over 5000 cycles for PANI (blue curve) and PANI-RuO2 (red curve).
Download figure:
Standard image High-resolution imageAgglomerated and globular morphology of PANI was seen over the entire surface of the stainless-steel substrate, evident in the SEM images shown in Fig. 11c. A thin layer of RuO2 covered the dense cluster of PANI. To analyze the performance of PANI-RuO2 as a supercapacitor electrode material, the cyclic voltammetry study was conducted in 1.0 M H2SO4 solution at a scan rate of 5mV s−1 within the potential window of −0.2 to +0.8V. The CV curves revealed an enhanced specific capacitance of 830 F g−1 obtained for the PANI-RuO2 composite electrode for a scan rate of 5mV s−1 superior to 591 F g−1 at the same scan rate obtained for the PANI electrode material. The CV response of PANI-RuO2 thin-film electrodes at various scan rates shows that as the scan rate was increased, the current under the curve slowly increased, asserting the pseudocapacitive behavior of the composite. The redox peaks do not show at higher scan rates due to limited proton diffusion migration. The scan rates for both the electrode materials exhibited an inverse relationship with specific capacitance. The galvanostatic charging-discharging study conducted for both the electrodes revealed asymmetric curves due to the redox reaction or electrochemical adsorption/absorption occurring at the electrode and electrolyte interface, demonstrating typical pseudocapacitive behavior. The galvanostatic plot further asserts that due to the low internal resistance of the composite electrode, the potential drop for the PANI-RuO2 composite electrode is less than that of the PANI electrode material. The specific power, specific energy, and coulombic efficiency for the PANI-RuO2 composite electrode were obtained as 4.16 kW kg−1, 260 W h kg−1, and 95%, respectively. The difference in the specific capacitance and the capacitance retention between PANI and PANI-RuO2 composite electrodes has been shown in Figs. 11d, 11e.
Ternary nanocomposite comprising reduced graphene oxide/RuO2/polyvinylcarbazole (rGO/RuO2/PVK) prepared by polymerization technique was used as supercapacitor electrode material by Ates et al. 130 Initially, 9-vinylcarbazole monomer and acetonitrile (ACN) solution were mixed, then added to rGO/Ru hydrosol. This solution was then added to a mixture of ammonium cerium nitrate (NH4)[Ce(NO3)6] and ACN solution. The resultant solution was mixed for 12 h to complete the polymerization process. The mixture was then filtered, and the residue of Ru/rGO was heated for 2 h at 150 °C. The heating process converts Ru to RuO2, and finally, ultrafine rGO/RuO2/PVK nanocomposite is obtained. The synthesis procedure of the nanocomposite has been illustrated in Fig. 12a. The authors have performed electrochemical measurements and analysis of different feed ratios of rGO/RuO2/PVK nanocomposite, out of which ([rGO]o/[RuO2]o/[9-VK]o = 1:1:5) showed the best results.
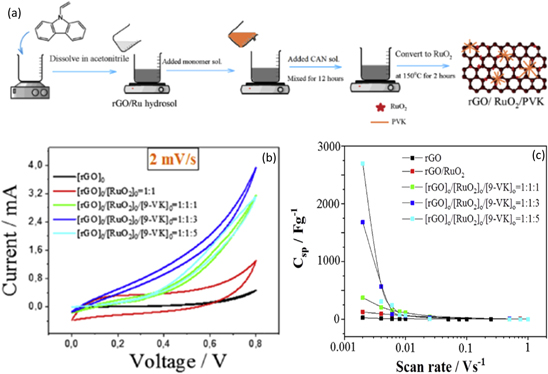
Figure 12. (a) The synthesis procedure of rGO/RuO2/PVK nanocomposite, (b) CV plots for different molar concentrations of PVK in the nanocomposite, and (c) variation of specific capacitance with scan rate for different molar concentrations of PVK in the nanocomposite.
Download figure:
Standard image High-resolution imageThe SEM image of [rGO]o/[RuO2]o/[9-VK]o = 1:1:5 showed the granular structure of PVK and RuO2 covering the rGO nanosheets indicating well-distributed rGO in the polymer matrix. This crystalline structure resulted in better charge carrying capacity and good conducting channels in the ternary nanocomposite. All the components of the ternary nanocomposite coexist well together due to good physical adsorption between them. The electrolyte used for the CV study is a 1 M H2SO4 solution which shows that the highest specific capacitance of 2698 F g−1 was obtained for [rGO]o/[RuO2]o/[9-VK]o = 1:1:5 at a scan rate of 2 mV mV s−1 as depicted in Fig. 12b. The variation in specific capacitance with the scan rate has been shown in Fig. 12c. The galvanostatic charge/discharge (GCD) study showed symmetric charging and discharging patterns across all the initial feed ratios for the nanocomposites. A high energy density of 11.31 Wh kg−1 and a high power density of 22625 W kg−1 were obtained at 50 mA for the nanocomposite electrode. A 100% Coulombic efficiency was obtained for all the nanocomposite films. The stability test for the nanocomposites to be used as supercapacitor electrodes, carried out using CV methods for 1000 cycles, confirmed 45.62% stability/charge retention capability for [rGO]o/[RuO2]o/[9-VK]o = 1:1:5.
RuO2/Carbon-based nanocomposite
Carbon-based materials such as graphene, 131–133 carbon nanotube (CNT), 134–137 and carbon nano-onions (CNOs) 138 have been found to elevate the supercapacitor properties of ruthenium oxide. In recent years, RuO2/Carbon-based nanocomposites are becoming increasingly popular due to the low cost and abundance of carbon materials. RuO2/graphene (RuO2/G) nanocomposite was prepared by Thangappan et al. for supercapacitor applications using the hydrothermal method. 139 Graphene oxide (GO) suspension was added to the ruthenium chloride hydrate, citric acid, and DI water mixture. The mixture was ultrasonicated, transferred to a Teflon-lined stainless-steel autoclave, and was heated for 24 h at 180 °C. The black powder collected by centrifugation was dried in a vacuum for 24 h at 60 °C. The authors have compared the experimental results of RuO2/G with pure RuO2 synthesized using the same procedure. The structure of the nanocomposite is shown in Fig. 13a.
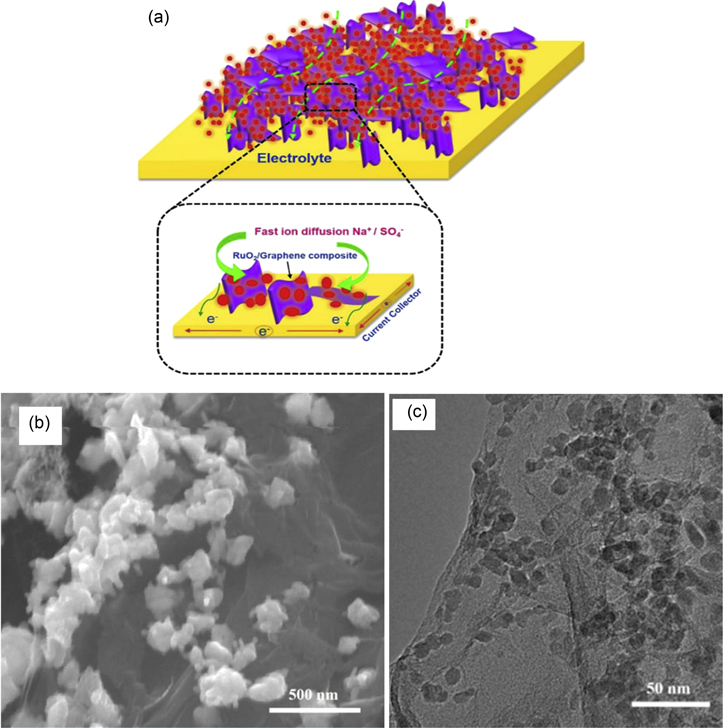
Figure 13. (a) schematic structure of RuO2/G nanocomposite, (b) SEM image, and (c) TEM image of RuO2/G nanocomposite.
Download figure:
Standard image High-resolution imageThe SEM image of RuO2/G nanocomposite shown in Fig. 13b manifested the RuO2 nanoparticles homogeneously distributed on the surface of the graphene sheets, which confirmed the formation of RuO2/G nanocomposite. The same phenomenon was also observed through the TEM image shown in Fig. 13c. The cyclic voltammetry (CV) conducted in 1 M of Na2SO4 electrolyte indicated high-rate capability due to the nanoporous structure of the nanocomposite with large void spaces. The specific capacitance measured from the Galvanostatic charging/discharging (GCD) curves indicated a high specific capacitance of 441.17 F g−1 due to the easy and abundant availability of highly conducting RuO2 nanoparticles on the surface of graphene nanosheets. The nanocomposite showed a high energy density of 61.2 Wh kg−1 and a higher power density of 1838.2 W kg−1. RuO2/graphene, when used as supercapacitor electrode material, was capable of ∼100% retention of its original capacitance at a high specific capacitance even after 1000 cycles.
Fullerene and MWCNT are preferred in energy storage applications due to their rich electron carbon source and exceptional thermal, electrical, and mechanical properties. Two different RuO2 based hybrid supercapacitor electrode materials, RuO2/Multi-walled CNT (MWCNT) and RuO2/Fullerene, were synthesized by Ates et al. using the electrobath deposition technique. 140 To prepare RuO2/MWCNT, aqueous sodium borohydride (NaBH4) acting as an initiator was added to RuCl3 solution with a constant check on pH value to be less than 4.9. This was followed by the addition of MWCNT. RuO2 hydrosol/MWCNT was obtained through a centrifuge process. Finally, RuO2/MWCNT nanocomposites were obtained by heating RuO2 hydrosol/MWCNT at 150 °C for 2 h. To prepare RuO2/Fullerene, fullerene nano-material was added to the previously prepared Ru hydrosol solution. The mixture was then left in an ultrasonic bath and was stirred magnetically. To convert the obtained RuO2 hydrosol/Fullerene to RuO2/Fullerene, the mixture was heated at 150 °C for 2 h. The preparation of the two supercapacitor electrode materials have been shown in Figs. 14a, 14b
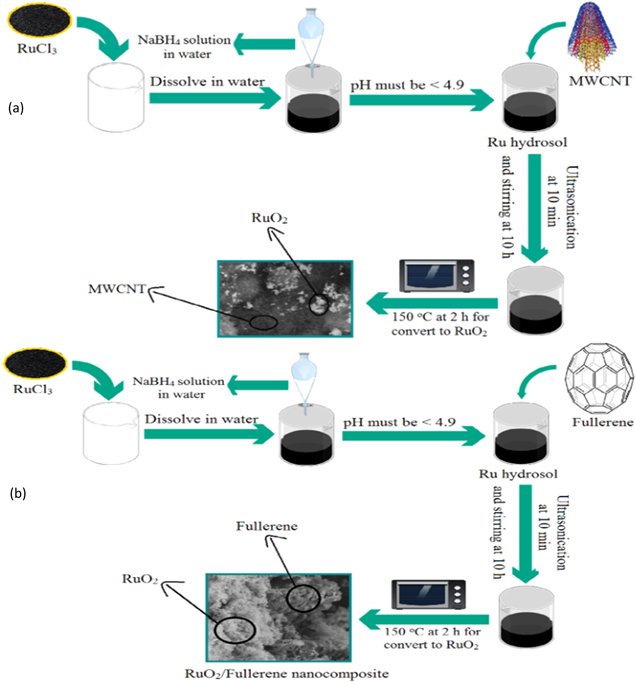
Figure 14. The synthesis procedure of (a) RuO2/MWCNT nanocomposite and (b) RuO2/Fullerene nanocomposite.
Download figure:
Standard image High-resolution imageRuO2/MWCNT and RuO2/Fullerene with varying initial feed ratios were prepared. Amongst them, [RuO2]o/[MWCNT]o = 3:1 and [RuO2]o/[Fullerene]o = 2:1 showed the best electrochemical behavior. The SEM images of the obtained RuO2/MWCNT and RuO2/Fullerene showed that RuO2 had a crystalline polymorphic structure, whereas fullerene had a porous spherical form. It also showed the existence of RuO2 on the surface of MWCNT and fullerene. Cyclic voltammetric (CV) measurements carried out demonstrated an exceptionally high specific capacitance of 3952.21 F g−1 and 1662.19 F g−1 for [RuO2]o/[Fullerene]o = 2:1 and [RuO2]o/[MWCNT]o = 3:1 respectively at 1 mV s−1. In comparison, the highest specific capacitance obtained by the authors for the pure RuO2 was 331.18 F g−1 at 1 mV s−1. Such high specific capacitance for RuO2 nanocomposites was obtained due to ions' adsorption on the inside and outside surfaces of electrode material for a lower scan rate. Comparatively lower specific capacitance was obtained for the nanocomposites at a higher scan rate due to the ions getting adsorbed only on the outside surface of the electrode.
A high energy density of 44.09 Wh kg−1 at 0.004 V s−1 and 74.41 Wh kg−1 at 0.002 V s−1 was obtained for [RuO2]o/[Fullerene]o = 3:1 and [RuO2]o/[MWCNT]o = 3:1 respectively. A high power density of 5964.18 W kg−1 at 1 V s−1 and 28695.27 W kg−1 at 0.5 V s−1 was obtained for [RuO2]o/[Fullerene]o = 3:1 and [RuO2]o/[MWCNT]o = 3:1 respectively. In comparison, the highest energy density and highest power density obtained for pure RuO2 was 2.07 Wh kg−1 at 0.001 V s−1 and 717.65 W kg−1 at 1 V s−1, respectively. The coulombic efficiency has been calculated to be ∼100% for both the nanocomposites.
The stability tests performed on the nanocomposites indicated 79.34% of initial capacitance being preserved for [RuO2]o/[MWCNT]o = 1:1 and 2:1. However, it dropped to 79.34% for [RuO2]o/[MWCNT]o = 3:1. On the other hand, ∼85%, ∼100%, and ∼59.54% of initial capacitance was retained for [RuO2]o/[Fullerene]o = 1:1, 2:1, and 3:1 respectively.
Since carbon nano-onions demonstrate lower resistance and better electrochemical performance than other carbon nanostructures, RuO2/carbon nano-onion (CNO) nanocomposite was synthesized by Muniraj et al. using a sol-gel method. 138 RuCl3.3H2O was added to a solution containing CNOs dispersed in DI water. NaOH was used to control the pH level of the mixture and was maintained neutral. RuO2 nanoparticles are formed on the CNO surface due to the reaction between NaOH and RuCl3.3H2O. The solution was stirred continuously for 6 h, dried at room temperature, and underwent calcination at 150 °C for 6 h. Conducting carbon paper was used as the substrate, which was hot-pressed by a rolling machine to make it less brittle and flexible. To hold its flexibility, one side of the carbon paper was coated with a paste of polydimethylsiloxane (PDMS), curing agent, and acetylene black in 10:1:2 proportion. The single-sided coated carbon paper was then dried at 95 °C for 10 min. The synthesis procedure is depicted in Fig. 15a. HRTEM image shown in Fig. 15b of the RuO2/CNO nanocomposite showed that the functional groups of oxygen present in CNOs promote the formation of RuO2 on the surface of CNOs in a highly dispersed manner. The RuO2/CNO nanocomposite was analyzed further using a CV study in a 0.5 M H2SO4 solution and PVA/H2SO4 gel. The corresponding cyclic voltammetry plot shown in Fig. 15c suggestsed that the area under the curve is directly proportional to the scan rate indicating good pseudocapacitive behavior, which is essential to be used as a supercapacitor electrode material. The highest specific capacitance of 1110 F g−1 was obtained for the RuO2/CNO hybrid electrode in 0.5 M H2SO4 solution as the electrolyte, tested at 1 A g−1 current density.
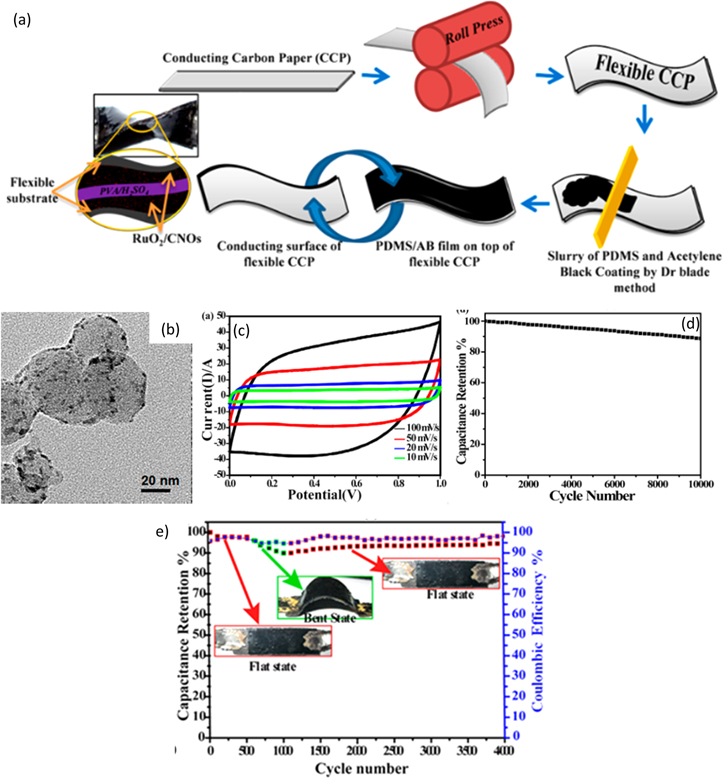
Figure 15. (a) Schematic illustration of the preparation of RuO2/CNO electrode separated by H2SO4 gel electrolyte, (b) HRTEM image of RuO2/CNO nanocomposite, (c) CV curve, (d) capacitance retention, and (e) capacitance retention after bending stress.
Download figure:
Standard image High-resolution imageFigure 15d shows an excellent life cycle of 88.7% of initial capacitance even after 10,000 cycles for the RuO2/CNO tested in 0.5 M H2SO4, confirmed by the cyclability test conducted at 15 A g−1 current density. The coulombic efficiency achieved was 100%. The RuO2/CNO tested in PVA/H2SO4 gel exhibited 88.9% retention of original capacitance tested with bending of the flexible electrode, as shown in Fig. 15e. The coulombic efficiency achieved was 96%. The energy and the power density obtained for the nanocomposite in PVA/H2SO4 gel were 10.59 Wh kg−1 and 4.475 kW kg−1, respectively. In the case of 0.5 M H2SO4 solution as the electrolyte, the energy density and the power density obtained were 19.75 Wh kg−1 and 4.782 kW kg−1, respectively.
2D Manganese Oxide (MnO2)
Since MnO2 is a cheap and familiar material, it serves as a suitable replacement for RuO2. However, similar to pure RuO2, pure MnO2 as the supercapacitor electrode material is not used due to the following problems. Firstly, MnO2 suffers from capacitance degradation during charging cycles due to the dissolution of MnO2 in the electrolyte over time. Secondly, MnO-based materials suffer from poor electrical conductivity and low surface area. 126,141 The aforementioned problems can be solved by synthesizing MnO2 based carbon, oxides, and polymer nanocomposites.
As compared to the other well-known crystalline forms of MnO2, α-MnO2 revealed better transmission of cations and superior electrochemical behavior. α-MnO2, in conjunction with activated carbon, facilitates higher electric conductivity that promotes the use of the composite as a supercapacitor electrode material. α-MnO2/activated carbon (MAC) composite was synthesized by Shen et al. by hydrothermal method. 142 The AC was prepared by mixing solid KOH and carbonized rice husk and heating the mixture at 800 °C for 2 h. The MAC nanocomposite was prepared by mixing MnSO4.H2O, KClO3, and DI water. HNO3 solution was added into ultrasonically treated MAC solutions which were eventually transferred to a Teflon-lined autoclave and heated and dried to obtain the final nanocomposite. Out of the different compositions of MnO2/AC nanocomposite, the nanocomposite obtained with equal proportions of MnO2 and AC (MAC55) exhibits the highest electrochemical activity. For comparison, the authors have also prepared single α-MnO2 without AC.
Irregular rod structures of varying sizes of MnO2 were formed during the initial 1 h of heating due to incomplete hydrothermal reaction. However, more uniformly shaped aggregated three-dimensional actiniaria structures were observed for 3 h and above heating times. With heating, the diameter of the rod structure varied from ∼100 nm (6 h), ∼200 nm (9 h), and ∼400 nm (12 h). The FE-SEM images of MAC55 nanocomposite showed that the porous morphology of AC gets eventually converted into MnO2 actiniaria structure dominance as the proportion of MnO2 content in the nanocomposite increases. This is shown in Figs. 16a, 16b.
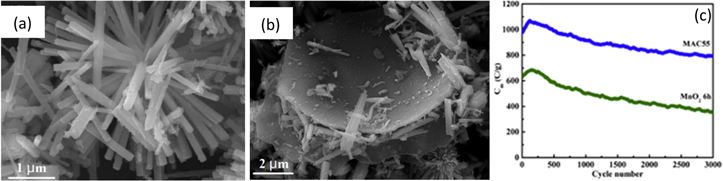
Figure 16. FE-SEM image of (a) α-MnO2, (b) MAC55, and (c) comparison of capacitance retention of α-MnO2 and MAC55 supercapacitor electrodes.
Download figure:
Standard image High-resolution imageThe supercapacitance behavior of α-MnO2 was confirmed from the GCD study. The specific capacitance values of 629.2 C g−1 for α-MnO2 were synthesized at 6 h, and a large specific capacitance of 1062.7 C g−1 for MAC55 was obtained. It was noted that the presence of AC improved the surface area and the conductivity of the nanocomposite. The CV study indicated that as MnO2 is added to AC, redox peaks were observed in the rectangular CV curves of AC which confirms the supercapacitive behavior of the nanocomposite. Figure 16c observed that after 3000 cycles, capacity retention of 56.2% for α-MnO2 and 81.3% for MAC electrode tested in 0.5 M K2SO4 electrolyte was confirmed.
Singhal et al. have found that the introduction of GO to MnO2 nanorods resulted in an improved electrochemical performance. 143 To carry out a comparative analysis, the performance of the MnO2-GO electrode was compared to the MnO2 electrode prepared by the centrifuge process. The precipitate was obtained by centrifuge process by adding KMnO4 to an ultrasonicated mixture of GO, ethanol, and DI water was dried for 24 h at 80 °C in an oven to obtain MnO2-GO nanocomposite. The TEM study showed the nanorod morphology of MnO2 with an average diameter of 15 nm. This nanorod morphology significantly changed to nono-powder-like morphology upon GO inclusion in the nanocomposite. CV analysis of the MnO2-GO electrode was conducted at scan rates from 1 to 300 mV s−1. The nanocomposite electrode exhibited good charge storage behavior, which was evident from the increase in the CV curve area as the scan rate increased. The highest specific capacitance exhibited by the MnO2 electrode was 650 F g−1, and the MnO2-GO electrode was 850 F g−1 at a scan rate of 10 mV s−1. The charge storage capacities of the MnO2 electrode improved by the addition of GO in the nanocomposite. A high energy density of 4.58 Wh kg−1 and a high power density of 5.0 kW kg−1 were calculated for the nanocomposite electrode.
Since γ-MnO2 has superior supercapacitor behavior than its other forms due to high electrochemical performance and higher catalytic oxidation activity, γ-MnO2/PANI composite was synthesized by Zhu et al. by in situ polymerization for supercapacitor applications. 144 An aqueous solution of γ-MnO2, H2SO4, and aniline was prepared to which ammonium peroxodisulfate (APS) dissolved in distilled water was added gradually. To complete the polymerization process, the resultant mixture was refrigerated overnight at ∼0 °C–5 °C to complete the polymerization process. The synthesis procedure adopted is shown in Fig. 17a.
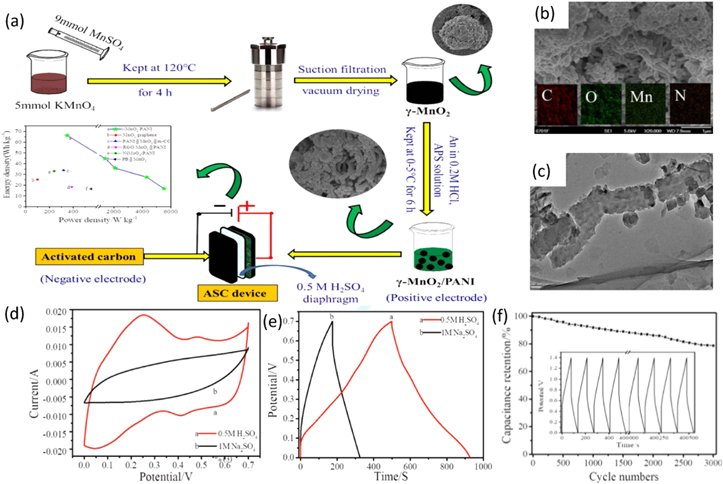
Figure 17. (a) Illustration of synthesis of γ-MnO2/PANI electrode and assembly of asymmetric supercapacitor device, (b) SEM image (c) TEM image, (d) CV curve, (e) GCD curves in different electrolytes, and (f) cyclic stability over 3000 cycles of γ-MnO2/PANI electrode.
Download figure:
Standard image High-resolution imageThe SEM and TEM images of the nanocomposite shown in Figs. 17b, 17c indicates evenly distributed clusters of γ-MnO2 around the rod-like morphology of PANI, indicating the successful compound formation of γ-MnO2/PANI composite. This resulted in an increased surface area and improved electrochemical performance of the nanocomposite. The electrochemical performance of the γ-MnO2/PANI electrode in both 0.5 M H2SO4 and 1.0 M Na2SO4 electrolytes was tested. The results are shown in Fig. 17d, indicating rectangular CV curves with redox peaks integrating more area when testing in 0.5 M H2SO4 electrolyte. This demonstrated better electrochemical performance in acid electrolytes. Improved pseudocapacitance and better stability of γ-MnO2 in the acid electrolyte confirmed from the GCD analysis shown in Fig. 17e led to a higher specific capacitance of 580.2 F g−1 was almost double than what was observed when tested in the neutral electrolyte (216 F g−1). Due to the molar conductivity of H+-SO4 2− being lower than Na+-SO4 2−, the charge transfer resistance of γ-MnO2/PANI nanocomposite in 0.5 M H2SO4 was 1/5 of what was obtained in 1.0 M Na2SO4. The nanocomposite showed an excellent rate capability of 70.5% at a current density of 5 A g−1, as shown in Fig. 17f.
To improve the electrical conductivity of MnO2 and enhance its electrochemical activity in the electrolyte, Tan et al. prepared the MnO2/CNT nanocomposites using the solid-state microwave method. 145 In this method, CNT mixed with manganese nitrate tetrahydrate [Mn(NO3)2.4H2O] in the proportion of 20:50 was grounded using mortar. The hybrid was placed in a crucible and subjected to 600 W of microwave power for 60 s. The SEM micrograph of the resultant product shown in Fig. 18a revealed uniform dispersion of MnO2 on the CNT surface. This morphology helped in electrolyte ion transport. Figure 18b shows that the highest specific capacitance obtained was 1250 F g−1 for the nanocomposite. It was observed that the right amount of microwave power was necessary to complete the nanocomposite formation reaction. If the power was too low, the CNTs could not absorb enough energy and complete the reaction. If the power was too high, partial products formed flock and were distributed unevenly, resulting in reduced specific capacitance. A good capacitance behavior and electrochemical reversibility were confirmed from the higher integral area of the CV curve exhibited by the MnO2/CNT nanocomposite. The coulombic efficiency was maintained at ∼100 % for the nanocomposite all through 700 cycles at 5 A g−1 current density, as shown in Fig. 18c. After 7000 cycles of continuous charging and discharging, high capacitance retention of ∼80 % was observed for the nanocomposite, as seen in Fig. 18d.
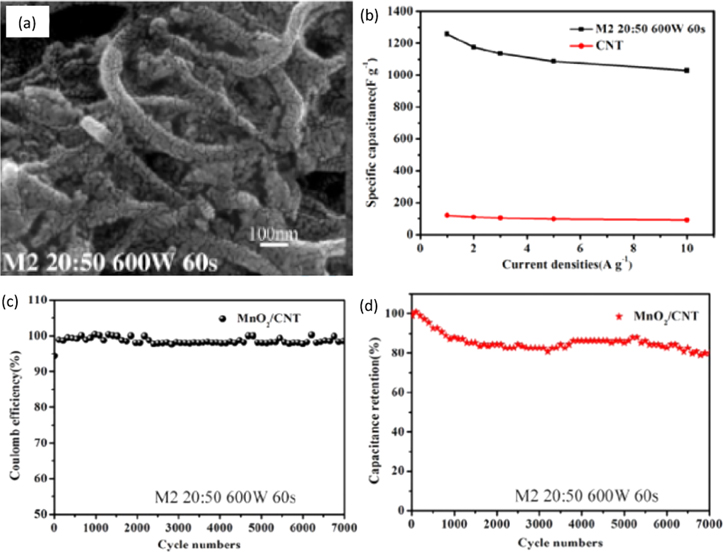
Figure 18. (a) SEM image of MnO2/CNT nanocomposite, (b) comparison of specific capacitance of CNT and MnO2/CNT nanocomposites, (c) charge and discharge cycle of the nanocomposite, (d) variation of capacitance retention of the nanocomposite electrode over 7000 cycles.
Download figure:
Standard image High-resolution image2D Nickel Oxide (NiO)
Due to the low cost, environmental friendliness, high theoretical specific capacitance (3750 F g−1), and high chemical and thermal stability, NiO often finds its use as an electrode material for supercapacitor electrode applications. 122 However, poor ionic conductivity and low electrically active sites restrict its use as a supercapacitor electrode material. 146,147 To mitigate these problems, different morphology of NiO nanostructures such as nanobelts, nanowires, nanorods, and nanoflowers have been synthesized. The electrochemical performance of NiO nanobelts decorated with gold (Au) nanoparticles were synthesized by Tan et al. 148 Ni(OH)2 powder, DI water, and HAuCl4 were mixed and treated ultrasonically for 30 min. After evaporation of H2O molecules by heating at 100 °C, the residual powder was calcinated at 500 °C for 2h in a muffle furnace.
Characterization by SEM confirmed the nanobelt structure of NiO–Au nanoparticles (NiO–AuNP), as seen in Fig. 19a. Redox peaks in the CV curves shown in Fig. 19b confirmed the capacitive behavior of the nanostructure. The high specific capacitance of 597 F g−1 at a current density of 0.5 A g−1 was calculated through the GCD curves exhibited in Fig. 19c. An assembly of NiO–Au as the positive electrode, AC as the negative electrode, and 2 M KOH as the electrolyte was used to study the supercapacitor behavior. As seen from Fig. 19d, NiO–Au nanoparticles demonstrated a maximum energy density of 18 Wh kg−1 and capacitance retention of 100% and 84% at 2 A g−1 and 5 A g−1 scan rates, respectively, after 22,000 cycles of charging and discharging.
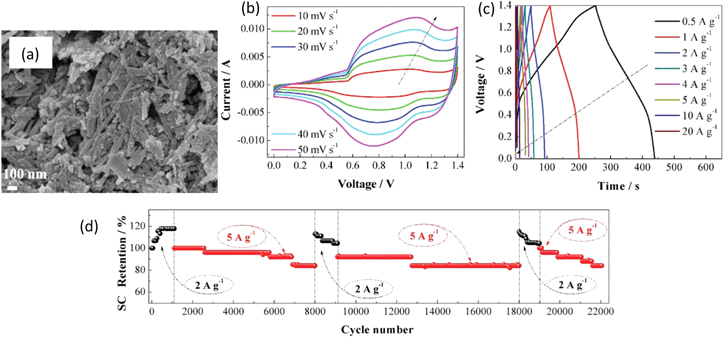
Figure 19. (a) SEM image of NiO–Au nanoparticles, (b) CV curves, (c) GCD curves, and (d) cycle life of NiO–Au∣∣AC supercapacitor.
Download figure:
Standard image High-resolution imageTaking advantage of the increased ion diffusion path provided by the NiO nanowires and fast electron transportation rendered by Ag, Ag-doped NiO nanowires on Ni foam were prepared by Hussain et al. using the hydrothermal method. 149 Ni(NO3)2.6H2O, AgNO3, CO(NH22222)2, ethanol, and DI water were mixed and stirred for 30 min. Ni foam immersed in the mixture was heated in the autoclave at 110 °C for 15 h and then brought down to room temperature. The rinsed and dried sample was again annealed at 350 °C for 2 h to obtain Ag-doped NiO nanowires on Ni foam. High magnification SEM and TEM images revealed porous nanowire formation that provided a short ion diffusion path speeding up the charge transfer process. The average diameter of the nanowires was ∼20 nm. Pseudocapacitive property and fast electron conduction can be attributed to the composite electrode tested through the CV curves evaluated in a 2 M KOH electrolyte. A high specific capacitance of 570.7 F g−1 at a discharge current density of 1 A g−1 was obtained. Direct contact of the NiO nanowires with the Ni foam and Ag doping facilitated achieving a high specific capacitance of 570.7 F g−1 at a current density of 1 A g−1, and good capacitance retention of ∼92.5 % tested for 3000 cycles. These results indicate Ag-doped NiO nanowires on Ni foam, a promising supercapacitor electrode material.
The use of Cr-doped NiO nanorods prepared using the hydrothermal method for use as supercapacitor electrode material was investigated by Ahmed et al. 150 A mixture of chromium chloride (CrCl2) and nickel chloride (NiCl2) in DI water was mixed gradually. The pH level was maintained at 8.0 using NaOH solution. After adding PVP and urea, the mixture was heated at 180 °C for 18h, dried at 80 °C for 4h, and eventually, Cr-doped NiO nanorods were obtained after calcination at 550 °C for 3h. SEM technique employed to study the nanostructure morphology confirmed that the initial spherical superfine morphology gets slowly converted to nanorod structure upon Cr doping which is evident in Figs. 20a, 20b. The nanorods possessed an average diameter of 20 nm and hundreds of nm in length. The CV studies were conducted in 3 M KOH electrolyte in a potential window of −0.2V to 0.55V at a scan rate of 5 mV s−1. Due to the reversible redox reactions of Ni and Cr occurring on their surface, redox peaks signifying good pseudocapacitive behavior were observed. It was also seen that Cr doping plays an essential role in the electrochemical behavior of the nanostructure. The high specific capacitance of 1132.64 F g−1 was obtained for Cr doping of 6 % owing to decreased crystallite size, increase in the active sites for charge storage due to oxygen vacancies developed during the calcination process, and change from nanoparticles to nanorods morphology. The variation of specific capacitance with the current density for Cr–NiO nanorods is shown in Fig. 20c. Highly symmetric GCD curves for the nanorods displayed superior reversible redox reaction between the potential range of −0.2 to 0.55 V. The GCD test over 2000 cycles conducted at 1 A g−1 showed that the Cr-doped NiO nanorods could retain 90.44 % of its initial capacitance, signifying an excellent candidate for supercapacitor electrode material.
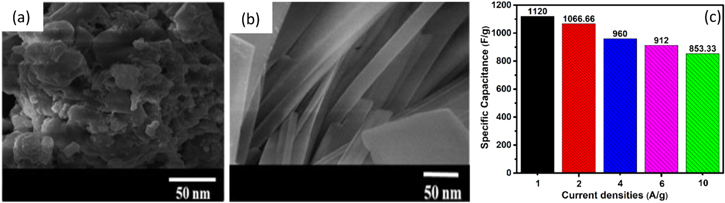
Figure 20. SEM image of (a) pure NiO sample, (b) Cr-NiO sample, and (c) variation of specific capacitance with current densities of Cr-NiO sample.
Download figure:
Standard image High-resolution imageTo overcome the shortcoming of the low energy density of supercapacitor materials, Xu et al. developed NiMoO4/NiO nanoflowers to be used as asymmetric pseudocapacitive electrode material for supercapacitor applications using the hydrothermal method. 151 NiCl2.6H2O, urea, and DI water were mixed and hydrothermally processed with as-prepared Ni foam at 130 °C for 20 h. (NH4)2MoO4 solution with the as-prepared precursor solution were placed in the autoclave at 160 °C for 10 h. The nanoflowers synthesized on the surface of Ni foam were then ultrasonically rinsed, dried, and annealed at 300 °C for 2 h. The schematic illustration of the synthesis procedure is shown in Fig. 21a. Figure 21b shows the FESEM image of the NiMoO4/NiO nanoflowers indicating agglomerated rod clusters that led to the formation of nanoflower morphology with an average diameter of ∼100 nm. This type of morphology assisted in electron transfer and ion diffusion at the interface due to the nanoflowers' large surface area and high pore volume. The CV curves enclosed a large area signifying high specific capacitance due to the nanoflower morphology and reversible Faradaic redox reactions of Ni(II)/Ni(III). An excellent specific capacitance of 1982.3 F g−1 at a current density of 11 mA cm−2 was obtained from the GCD curves for the nanoflowers. The highly conductive Ni-foam used as the substrate along with a large number of active sites and fast electron transport in the nanoflower morphology led to such high specific capacitance. The cyclic stability tests confirmed outstanding electrochemical stability, evident from 98.6% retention of the initial capacitance after 3000 cycles. When used as the supercapacitive electrode material, the nanoflowers exhibited an energy density of 38 Wh kg−1 and a power density of 96.2 W kg−1.
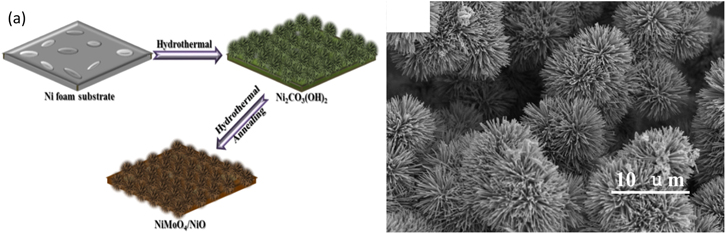
Figure 21. (a) Scheme for synthesizing NiMoO4/NiO nanoflowers on Ni foam and (b) FESEM image of NiMoO4/NiO nanoflowers.
Download figure:
Standard image High-resolution image2D Nickel Hydroxide [Ni(OH)2]
Thanks to the high redox behavior and superior theoretical specific capacity, Ni(OH)2 finds its implementation in energy storage applications. 152 When Ni(OH)2 is used as the positive electrode material for supercapacitor applications, the reversible Faradaic reaction takes place according to, 122

However, p-type semiconductor electrode material of Ni(OH)2 suffers from poor electrical conductivity, short cycle life under high current density charging and discharging, and poor rate performance. 153 Hence, nanostructured Ni(OH)2 are gaining popularity as the pseudocapacitive electrode material for supercapacitor applications.
The nanostructured α-Ni(OH)2 phase was grown using the electrodeposition method on Ti plate by Aguilera et al. 154 The galvanostatic deposition process was carried out for 30 min at a current of −2.0 mA in a three-electrode glass cell arrangement comprising of Ag/AgCl as the reference electrode, Ti substrate as the working electrode, and platinum plate as the counter electrode present in 0.1 mol l−1 Ni(SO4)2.6H2O electrolyte. The SEM image shown in Fig. 22a revealed agglomerated nanorods with space between the adjacent clusters that gave cabbage-like morphology. A closer look at one of these clusters indicated smaller nanoparticles forming nanorods which increased the access of active sites to the electrolyte ions improving the capacitive performance. The CV curves for α-Ni(OH)2 showed symmetric anodic and cathodic peaks resulting from reversible transfer between Ni2+ and Ni3+ ions. As the scan rate increased, the CV curves maintained their shape. They integrated more area, suggesting faster redox reactions at the surface of the α-Ni(OH)2 electrode material. The discharge curves indicated two sloping potential regions resulting from the pseudocapacitive behavior of the α-Ni(OH)2 nanosize cabbage structure. Since most of the active material is available for the ions in the electrolyte for the diffusion and migration process at a low current density, a high specific capacitance of 1907 F g−1 for α-Ni(OH)2 at a current density of 3 mA cm−2 was obtained from the GCD curves. The variation of specific capacitance with the current density is shown in Fig. 22b. The cyclic stability of the nanostructure was tested after 1000 cycles and 3000 cycles. A 99.3 % and 90.15 % capacitance retention after 1000 cycles and 3000 cycles, respectively, was observed from Fig. 22c, indicating long-term cycle stability of α-Ni(OH)2 electrode. A high energy and power density of 42.31 Wh kg−1 and 430 W kg−1 were calculated.

Figure 22. (a) SEM image, (b) specific capacitance as a function of current density, and (c) specific capacitance as a function of cycle number of α-Ni(OH)2 films.
Download figure:
Standard image High-resolution imageBenefitting from the high compatibility of Ni(OH)2 and carbon cloth (CC), carbon cloth/Ni(OH)2 (CC/Ni(OH)2) was synthesized by the electrochemical deposition technique by Ovhal et al. 155 Ag/AgCl was used as the reference electrode, Pt wires were used as the counter electrode, and 3 M NiCL.6H2O.Ni(OH)2 was used as the electrolyte. The low magnification FESEM images showed that the diameter of CC fibers was 15–17 μm. Grooves with sizes of 200–400 nm and crests with dimensions of 1.5–2.0 μm started to show on higher magnification on the surface of each carbon fiber. These grooves and ridges promoted the growth of Ni(OH)2 by providing greater surface area. Porous Ni(OH)2 nanoparticles with 10–12 nm particle size covered most of the grooves of the carbon fibers upon the synthesis of CC/Ni(OH)2. The schematic diagram illustrating the ion adsorption and self-discharge mechanism of CC/CNT and CC/Ni(OH)2 electrodes has been shown in Fig. 23. Ni(OH)2 on the grooves and crests of carbon fibers facilitated efficient charge transport and high charge storage, which led to obtaining a high specific capacitance of 3987 F g−1 at a current density of 0.5 mA cm−2. Due to the reversible Faradaic reactions at the electrode and electrolyte interface, non-linear GCD curves are obtained for the CC/Ni(OH)2 electrode. The CV curves showed symmetric anodic and cathodic peaks indicating the reversible nature of Ni(OH)2 electrochemical deposition.
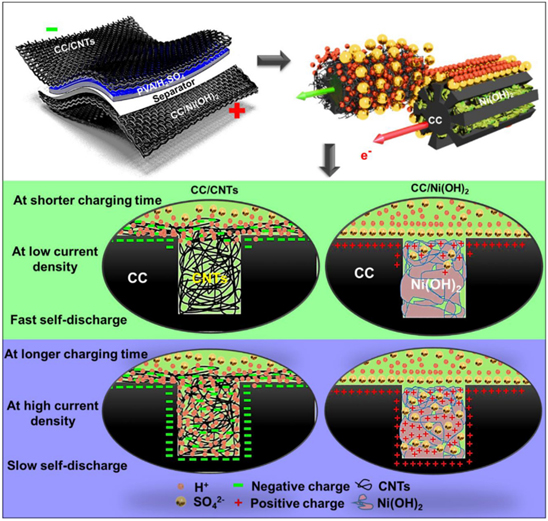
Figure 23. Schematic diagram illustrating the ion adsorption and self-discharge mechanism of CC/CNT and CC/Ni(OH)2 electrodes.
Download figure:
Standard image High-resolution imageTo further increase the energy storage capacity of Ni(OH)2, the hydrothermal method was employed by Ji et al. to synthesize nitrogen-doped carbon dots (NCDs) on Ni(OH)2 nanosheets. 156 Ni(Ac)2.4H2O, NCDs, and DI water were mixed, and a 3 M NaOH solution was used to maintain the pH level of the mixture at 11. After heating at 180 °C for 24h, the solid residue obtained through centrifugation was dried in a vacuum oven at 60 °C for 24h. The Ni(OH)2/NCDs obtained through 20 mg of NCDs show the highest electrochemical performance among all the initial feed ratios. Figure 24a shows the FESEM image, which reveals the platelet-like morphology of Ni(OH)2/NCDs. The width of these nanosheets is ∼35.1 nm which was confirmed from the TEM analysis. However, the width and thickness of Ni(OH)2 nanosheets were restricted as NCDs were added. The width and thickness of the composites were at 87.0 nm and 9.8 nm, respectively. The CV study indicated a direct relationship between the loop area and the specific capacitance of the electrode material.
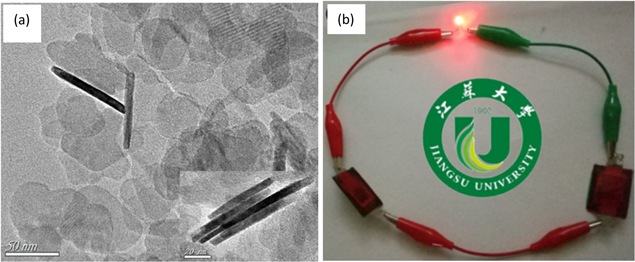
Figure 24. (a) TEM image of Ni(OH)2/NCD nanosheets and (b) LED-lighted by the assembled device.
Download figure:
Standard image High-resolution imageIn comparison, it was found that there is a significant increase in the specific capacitance when NCDs are added to Ni(OH)2. The exact specific capacitance for the Ni(OH)2/NCDs nanosheets was calculated from GCD curves and was found to be ∼1711.2 F g−1 for a current density of 1 A g−1. A supercapacitor device based on Ni(OH)2/NCDs nanosheets as the positive electrode and graphene as the negative electrode exhibited high energy and power density of 34.6 Wh kg−1 and 700 W kg−1, respectively. Two of these supercapacitor devices can be combined to deliver a voltage of 2.2 V to efficiently power a LED, as seen in Fig. 24b.
2D Cobalt Hydroxide [Co(OH)2]
Among other hydroxide-based supercapacitor electrodes, Co(OH)2 has attracted much attention due to its layered structure offering a large surface area, large interlayer spacing, high conductivity, and long-term stability. 122,126 β-Co(OH)2/CNT composite was prepared by Aghazadeh et al. using the electrodeposition method. 157 The stainless-steel grid was used as the cathode, and graphite plates were used as the anode. A mixture of CNTs, DI water, and an aqueous cobalt chloride solution was used as the electrodeposition bath. The electrodeposition was carried out for 30 min at 25 °C. The CNTs were electrophoretically moved towards the cathode surface as soon as the electrodeposition process started. At the same time, cobalt cations were also transferred onto the cathode surface. After the deposition of CNTs, the electrochemical growth of Co(OH)2 started immediately. The final Co(OH)2 composite morphology comprised the platelet-like Co(OH)2 around CNTs. The CV and GD tests were performed with Ag/AgCl as the reference electrode, Pt wire as the counter electrode, and the deposited nanocomposite on the steel grid as the working electrode in the presence of 1 M KOH electrolyte solution. The CV curves showed a pair of redox peaks both in the anodic and cathodic directions, which increased as the scan rate increased. The CV curves calculated the maximum specific capacitance of 1354 F g−1 at a scan rate of 2 mV s−1. The GCD profiles exhibited an excellent charge storage capability and pseudocapacitive behavior of the β-Co(OH)2/CNT composite. High capacitance retention of 89.4 % and 80.5 % after 5000 cycles of charging/discharging measured at a current rate of 0.5 A g−1 and 2 A g−1 respectively was demonstrated by the β-Co(OH)2/CNT composite.
Co(OH)2-rGO nanocomposite was prepared by Rahimi et al. using the environmentally friendly preparation route of the electrodeposition method. 158 A mixture of GO powder, an aqueous solution of CoCl2, and DI water was used as the electrolyte for the electrodeposition. The electrode system comprised a stainless steel plate used as the cathode, sandwiched between two graphite plates acting as the anode. The synthesis procedure adopted for the electrodeposition process of Co(OH)2-rGO nanocomposite is shown in Fig. 25. Among the different composites prepared, Go: CoCl2.6H2O with a w/w ratio of 1:4 gave the best electrochemical results. From the SEM study, the porous intertwined structure with nanosheet morphology of Co(OH)2-rGO nanocomposite was confirmed to have more potential to preserve charge. The porous intertwined structure and the synergistic interaction between Co(OH)2 and rGO gave rise to a specific capacitance of 734 F g−1 at a current density of 1 A g−1 and capacitance retention of 95% after 1000 cycles. The nanocomposite's average energy and power densities were 60.6 Wh kg−1 and 3208 W kg−1, respectively.

Figure 25. Electrodeposition process of Co(OH)2-rGO nanocomposite in a two-electrode system.
Download figure:
Standard image High-resolution imageMXene
2D transition metal carbides, nitrides, and carbonitrides exist as a crystal structure of the MAX phase composed of layers of transition metal carbides/nitrides interleaved with layers of "A" element. They have a chemical stoichiometry of Mn+1AXn (n = 1, 2, 3), where "M" is the early transition metal, "A" is the main group element, and "X" denotes carbon and/or nitrogen. The selective etching of "A" layers is possible due to chemically active "M–A" bonds, which gave rise to new 2D materials called MXene. This transforms the stoichiometry of MXene to Mn+1XnTx, where "Tx" represents the surface terminations (OH, O, or F). MXenes have recently received a lot of attention due to their high electrical and thermal conductivity, hydrophilic nature, high surface area, and excellent oxidation resistance. 159–161 Here, we have reported the most recent advances in the synthesis and characterization of MXenes.
Supercapacitors are known to be notoriously self-discharging with the use of non-biodegradable components. Zn-Ti3C2 MXene supercapacitors designed by Yang et al. could be totally degraded within 7.25 d and retained 82.5% of its original capacitance after 1000 cycles of charging and discharging under bending stress. 162 A constant-voltage deposition technology comprising Ti3C2 as the working electrode and Zn plate as the counter and reference electrode in the presence of a mixture of gelatin and ZnSO4 gel electrolyte was used to prepare the Zn-Ti3C2 MXene electrodes. During the electrochemical performance study, redox reaction occurred at the anode, and adsorption/desorption of So4 2− appeared at the cathode. As a result of asymmetrical electrochemical behavior, there was a deviation in the traditional rectangular CV curves. This held true for all the scan rates from 5–100 mV s−1. The triangular-shaped GCD curves confirmed a highly reversible charging/discharging process. A specific capacitance of 132 F g−1 along with 91.6% retention was exhibited. The capacitance was maintained at near 100% even during different bending states, asserting the possible use of degradable, rechargeable, anti-self-discharging Zn-Ti3C2 MXene as a flexible electrode material.
Due to the insufficient interlaminar interaction between MXene sheets and lack of well-developed assembling techniques, MXene into macroscopic fibers with regular spacing is a big challenge. Yang et al. have prepared MXene/reduced-graphene oxide (MXene/rGO) hybrid fibers using wet-spinning assembly strategy as shown in Fig. 26a, using the synergistic interaction between graphene oxide liquid crystalline additive and 2D layered sheets of Ti3C2 sheets. 163 Figure 26b shows the Mxene/rGO hybrid fibers obtained through the wet-spinning process. Figure 26c shows the SEM image of the fibers that reveals a crumpled surface and a dense structure that facilitates the electrochemical behavior of the fibers. The electrochemical performance of the MXene/rGO electrode was tested in 1M H2SO4 aqueous electrolyte solution, which revealed a specific capacitance of 890.7 F cm−3 at 10 mV s−1. The redox reactions of Ti atoms in conjunction with the double electric layer surface adsorption resulted in pseudocapacitive behavior that governed the excellent electrochemical performance. A high energy density of 13.03 mW h cm−3 and a power density of 0.59 W cm−3 were reported.

Figure 26. (a) Wet-spinning synthesis process, (b) photograph, and (c) SEM image of MXene/rGO hybrid fibers.
Download figure:
Standard image High-resolution imageThe doping of graphene layers with nitrogen heteroatoms was conducted by Wen et al. to prepare nitrogen-doped MXene electrodes (N-Ti3C2Tx) to improve the electrochemical performance of the traditional Ti3C2Tx. 164 Ti3C2Tx powder was annealed in a tube furnace at different temperatures in the presence of 100 ml min−1 ammonia gas flow. Out of all the prepared samples, the Ti3C2Tx powder annealed at 200 °C showed the best electrochemical performance. Figure 27a shows the SEM image of the morphology of N-Ti3C2Tx that confirmed the presence of nitrogen doping in the well-stacked nanosheet morphology of Ti3C2Tx. The electrochemical performance of the N-Ti3C2Tx electrode was evaluated in 1M H2SO4 solution and 1 M MgSO4 electrolyte solution. The CV curves of the electrode obtained in 1M MgSO4 solution had a perfectly rectangular profile denoting excellent pseudocapacitive behavior. However, some peaks were obtained in the CV curve when tested in 1M H2SO4 solution, which resulted from hydronium bonding/debonding with the terminal oxygen in the electrode. An illustration of the change in the charge storage mechanism upon nitrogen doping is illustrated in Fig. 27b. A higher specific capacitance of 192 F g−1 was obtained for the N-Ti3C2Tx electrode tested at 1 mV s−1 in 1M H2SO4 compared to the 82 F g−1 in 1M MgSO4. The difference in the specific capacitance was due to the lower electrical conductivity of MgSO4 compared to H2SO4. This was higher than the 34 F g−1 specific capacitance obtained for the pristine Ti3C2Tx electrode. The cyclic stability test confirmed 92% retention of the initial capacitance value for the N-Ti3C2Tx electrode after 10,000 cycles of charging and discharging tested at a scan rate of 50 mV s−1. Such enhancement in the capacitance of the Ti3C2Tx electrode can be attributed to the increase in the interlayer spacing due to nitrogen doping.
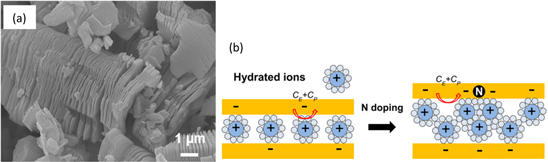
Figure 27. (a) SEM image of N-Ti3C2Tx and (b) illustration of the change in charge storage mechanism upon N-doping.
Download figure:
Standard image High-resolution imageThe final mixture annealing time and temperature have been indicated in the Table III.
Table II. Comparison of synthesis and performance of various activated carbon and BCN based supercapacitor electrode materials.
| Materials | Synthesis Method | Precursors | Electrolyte Used | Specific Capacitance (F g−1) | Energy Density (Wh kg−1) | Power Density (kW kg−1) | Capacitance Rentention | Temperature | Time | References |
|---|---|---|---|---|---|---|---|---|---|---|
| Porous carbon | Hydrothermal method | Crab shell | KOH solution (6 mol l−1) | 322.5 at 1 A g−1 | 15.5 | 5166.7 | 99% upto 10000 cycles | 600 °C, | 1 h | 73 |
| 700 °C, | ||||||||||
| 800 °C | ||||||||||
| Activated carbon | Hydrothermal method | Corn Husk | Seawater | 132 at 0.5 A g−1 | 7.74 | 6.33 | 98% upto 10000 cycles | 600 °C | 1 h | 74 |
| Activated carbon | Refluxing | Corn silk | 1M TEABF4/PC | 160 at 1 A g−1 | 32.28 | 0.870 | 84% upto 2500 cycles | 750 °C | 1 h | 190 |
| Activated carbon | Pre-carbonization activation | Corn husk | 1M TEABF4/AN | 80 at 1 A g−1 | 20 | 0.681 | 90% after 5000 cycles | 700 °C, | 3 h | 76 |
| 800 °C, | ||||||||||
| 900 °C | ||||||||||
| Nanoporous graphene sheets | Pre-carbonization activation | Jute stick | 1M TEABF4/AN | 131 at 1 A g−1 | 33 | 0.676 | NR | 800 °C, | NR | 191 |
| 900 °C, | ||||||||||
| 1000 °C | ||||||||||
| BCN nanosheets | CVD | Graphene | 1M H2SO4 | 306 at 0.2 A g−1 | NR | NR | NR | 900 °C | NR | 86 |
| BCN nanotube arrays | Low-temperature solvothermal method | Methyl cyanide | 6.0M aqueous KOH | 547 at 0.2 A g−1 | NR | NR | 97% upto 3500 cycles | 65 °C | 8 h | 192 |
| BCN nanosheets | Thermal pyrolysis | Glucose, boric acid, urea | 1M H2SO4 | 244 at 1 A g−1 | NR | NR | 96% up to 3000 cycles | 900 °C | 5h | 193 |
NR—not reported
Table III. Comparison of synthesis and performance of various TMOs, TMHs, and MXenes used as supercapacitor electrodes.
| Materials | Synthesis Method | Precursors | Electrolyte Used | Specific Capacitance | Energy Density | Power Density | Capacitance Rentention | Temperature | Time | References |
|---|---|---|---|---|---|---|---|---|---|---|
| RuO2-TiO2 | Electrochemical anodization and Electrodeposition | Ammonium fluoride, ethylene glycol, and phosphoric acid | 1.0 M H2SO4 | 39.6 mF cm−2 | 0.029 mWh cm−2 | NR | 78.9% after 1000 cycles | NR | NR | 127 |
| Graphene-RuO2-TiO2 | Hydrothermal | Ruthenium chloride, titanium chloride, and graphene oxide | 1.0 M H2SO4 | 396.5 F g−1 | NR | NR | 95% after 1000 cycles | NR | NR | 128 |
| PANI-RuO2 | Chemical Bath Deposition | H2SO4, aniline monomer, ammonium persulphate and Ruthenium chloride | 1.0 M H2SO4 | 830 F g−1 | 260 Wh kg−1 | 4.16 kW kg−1 | 85% over 5000 cycles | NR | NR | 129 |
| Graphene oxide/RuO2/polyvinylcarbazole | Polymerization | 9-vinylcarbazole monomer, acetonitrile, rGO/Ru hydrosol, ammonium cerium nitrate, and acetonitrile | 1.0 M H2SO4 | 2698 F g−1 | 11.31 Wh kg−1 | 22.63 kW kg−1 | 45.62% after 1000 cycles | 150 °C | 2 h | 130 |
| RuO2/Graphene | Hydrothermal | Graphene oxide, ruthenium chloride hydrate, and citric acid | 1.0 M Na2SO4 | 441.17 F g−1 | 61.2 Wh kg−1 | 1838.2 W kg−1 | ∼100% after 1000 cycles | 180 °C | 24 h | 139 |
| RuO2/MWCNT | Chemical Bath Deposition | Sodium borohydride, ruthenium chloride, and MWCNT | 1.0 M H2SO4 | 1622.19 F g−1 | 74.41 Wh kg−1 | 28.695 kW kg−1 | 79.34% after 1000 cycles | 150 °C | 2 h | 140 |
| RuO2/Fullerene | Chemical Bath Deposition | Sodium borohydride, ruthenium chloride, and Fullerene | 1.0 M H2SO4 | 3952.21 F g−1 | 44.09 Wh kg−1 | 5964.18 W kg−1 | ∼100% after 1000 cycles | 150 °C | 2 h | 140 |
| RuO2/Carbon Nano-onion | Sol-gel | Ruthenium chloride, carbon nano-onion, and NaOH | 0.5 M H2SO4 | 1110 F g−1 | 19.75 Wh kg−1 | 4.782 kW kg−1 | 88.7% after 10000 cycles | 150 °C | 6 h | 138 |
| α-MnO2/activated carbon | Hydrothermal | KOH, rice husk, MnSO4, KClO3, HNO3 | 0.5 M K2SO4 | 1062.7 C g−1 | NR | NR | 81.3% after 3000 cycles | 120 °C | 6 h | 142 |
| MnO2-Graphene Oxide | Centrifuge | KMNO4, ethanol, and graphene oxide | 3.0 M KOH | 850 F g−1 | 4.58 Wh kg−1 | 5.0 kW kg−1 | NR | 80 °C | 24 h | 143 |
| γ-MnO2/polyaniline | Hydrothermal and in situ polymerization | Ammonium peroxodisulfate, potoassium permanganate, manganese sulfate, potassium permanganate, and sulfuric acid | 0.5 M H2SO4 | 232.1 F g−1 | 66.4 Wh kg−1 | 350.1 W kg−1 | 78.65% after 3000 cycles | 500 °C | NR | 144 |
| MnO2/CNT | Solid-state microwave | CNT and manganese nitrate tetrahydrate | KOH | 1250 F g−1 | 33.5 Wh kg−1 | 400 W kg−1 | 80% after 7000 cycles | NR | NR | 145 |
| NiO nanobelts with gold nanoparticles | Hydrothermal | NiSO4.7H2O, HAuCl4.3H2O, ethanol, NaOH, and KOH | 2.0 M KOH | 597 F g−1 | 18.0 Wh kg−1 | 350 W kg−1 | 84% after 22000 cycles | 500 °C | 2 h | 148 |
| Ag-doped NiO nanowires | Hydrothermal | Ni(NO3)2.6H2O, AgNO3, and CO(NH2)2 | 2.0 M KOH | 570.4 F g−1 | NR | NR | 92.5% after 3000 cycles | 350 °C | 2 h | 149 |
| Cr-doped NiO nanorods | Hydrothermal | Chromium chloride and nickel chloride | 3.0 M KOH | 1132.64 F g−1 | NR | NR | 90.44% over 2000 cycles | 550 °C | 3 h | 150 |
| NiMoO4/NiO nanoflowers | Hydrothermal | NiCl2.6H2O, urea, and (NH4)2MoO4 | 3.0 M KOH | 1982.3 F g−1 | 38.0 Wh kg−1 | 96.2 W kg−1 | 98.6% after 3000 cycles | 300 °C | 2 h | 151 |
| Cabbage-like α-Ni(OH)2 | Electrodeposition | Oxalic acid and nickel hydroxide | 1.0 M KOH | 1903 F g−1 | 42.31 Wh kg−1 | 430 W kg−1 | 90.15% after 3000 cycles | NR | NR | 154 |
| Carbon cloth/Nickel hydroxide | Electrodeposition | Nickel chloride hexahydrate | 1.0 M H2SO4 | 3987 F g−1 | 132.7 Wh kg−1 | 27.7 kW kg−1 | 92% after 2000 cycles | NR | NR | 155 |
| Nitrogen doped carbon dots on Ni(OH)2 nanosheets | Hydrothermal | Ni(Ac)2.4H2O and nitrogen doped carbon nanodots | 3.0 M KOH | 1711.2 F g−1 | 34.6 Wh kg−1 | 700 W kg−1 | 74.9% after 5000 cycles | 180 °C | 24 h | 156 |
| β-Co(OH)2/CNT | Electrodeposition | Cobalt chloride | 1.0 M KOH | 1287 F g−1 | NR | NR | 89.4% after 5000 cycles | 25 °C | 30 m | 157 |
| Co(OH)2-reduced graphene oxide | Electrodeposition | Graphene oxide and CoCl2 | 2.0 M KOH | 734 F g−1 | 60.6 Wh kg−1 | 3208 W kg−1 | 95% after 1000 cycles | NR | NR | 158 |
| Zn-Ti3C2 MXene | Electrodeposition | Hydrofluoric acid | 2.0 M ZnSO4 | 132 F g−1 | NR | NR | 82.5% after 1000 cycles | NR | NR | 162 |
| MXene/graphene | Wet-spinning | Lithium fluoride, hydroiodic acid, polyvinyl alcohol, and phosphoric acid | 1.0 M H2SO4 | 890.7 F cm−3 | 13.03 mWh cm−3 | 0.59 W cm−3 | 90% after 3000 cycles | 90 °C | 12 h | 163 |
| Nitrogen-doped Ti2C2Tx Mxene | Post-etch annealing | Titanium carbide, titanium, and aluminum powder | 1.0 M H2SO4 and 1.0 M MgSO4 | 192 F g−1 and 82 F g−1 | NR | NR | 92% after 10000 cycles | 200 °C, 300 °C, 500 °C, 700 °C | 2 h | 164 |
NR—not reported.The final mixture annealing time and temperature have been indicated in the Table II.
Transition Metal Dichalcogenides
TMDCs are a group of materials that have transition metal (M) atoms from group 4–10 that react with chalcogen (X) atoms (Se, S, or Te) to form the structure of X-M-X, with the stoichiometry MX2. 165,166 TMDCs have a layered hexagonal structure analogous to graphene with weak Van der Waals forces separating strong interlayer covalent bonds resulting in viable intercalation and deintercalation of cations. TMDCs are one of the most promising materials for supercapacitor applications due to their excellent electrochemical property, variable oxidation states, sheet-like morphology, large surface area, and great redox charge storage mechanism. 167–170 TMDCs, due to the feasibility of intercalation and reversible redox reactions, can be used as combined EDLC and pseudo-capacitor. 165,171
Many types of TMDCs like MoS2, WS2, TiS2, etc. are currently being studied for supercapacitor applications. The most commonly investigated TMDC for supercapacitor applications is MoS2 owing to its abundance, low cost, and environmentally friendly. 172–174 Many different morphologies of MoS2, such as nanosheets, nanoflowers, and nanospheres, have been reported for supercapacitor applications. Although MoS2 has tremendous research interest in the field of supercapacitor electrodes, it has not reached its potential due to its disadvantageous intrinsic resistivity, which limits the electron transfer, thereby reducing the increase in specific capacitance. 168,171,175–177 Many researches have been conducted over the years to overcome this disadvantage of MoS2. One of the ways to overcome this limitation is to produce hybrid composites of MoS2 with other conductive materials to improve its conductivity. This is discussed further in the upcoming sections.
MoS2 direct-growth on current collectors
Wang et al., using the hydrothermal method, deposited MoS2 nanosheets directly onto titanium plates that acted as the conducting current collector. 173 Sodium molybdate (Na2MoO4.2H2O) and thiourea ((NH2)2CS) were used as the chemicals in the hydrothermal method along with titanium plate pieces at a treatment temperature of 180 °C for 12 h. It was proposed that during the hydrothermal process, the titanium initially underwent a surface reaction with (NH2)2CS to form thin titanium sulfide films. This thin layer of titanium sulfide acted as a strong adhesive to bond the Ti plate with the MoS2 nanosheets. For the electrode evaluation, 1M KCl aqueous electrolyte was used in this study. The electrodes fabricated in this research exhibited the specific capacitance of 133 F g−1 at a discharge current density of 1 A g−1. The electrode displayed high capacitance retention of 93% up to 1000 cycles. The specific capacitance value reported by Wang et al. was in the typical range of specific capacitance value reported by other reports of MoS2 nanosheet electrodes (129.2 F g−1) or sphere-like MoS2 electrodes (92.85 F g−1 and 122 F g−1) that were synthesized in the absence of additives. 178–180
Zhou et al., similar to Wang et al., synthesized MoS2 nanosheets directly onto the current collector (carbon cloth in this research) in the absence of a binder using the hydrothermal method. 181 The author proposed that the addition of binders hindered ion transportation and incremented the loading amount of active material per unit area. The MoS2 was synthesized using sodium molybdate and thiourea as precursors at temperatures varying from 180 °C–220 °C. The carbon cloth was immersed in the precursor solution during the hydrothermal process. The electrode produced at a temperature of 220 °C had the highest loading of active materials of 26.9 mg cm−2 compared to 6.1 mg cm−2 in the electrode produced at 180 °C. Figure 28 shows the SEM morphology comparison of the electrodes produced at different temperatures. The electrode evaluation was done in 1 M sodium sulfate (Na2SO4) electrolyte. The specific capacitance values at 10 mA cm−1 were identified to be 119.7 F g−1, 151.1 F g−1, and 15.7 F g−1 for electrodes produced at temperatures of 180 °C, 200 °C, and 220 °C, respectively. The electrodes synthesized at 180 °C, 200 °C, and 220 °C displayed capacitance retention of 71.0%, 86.3%, and 52.0%, respectively, after 2000 cycles. The highest specific capacitance and highest capacitance retention value identified in the electrode synthesized at 200 °C could be attributed to the maximum number of uniform vertical MoS2 nanosheets grown onto the carbon cloth at that temperature. This resulted in the exposure of more electrochemical active sites. At 220 °C, the MoS2 nanosheets agglomerated, preventing the exposure of some active material to the electrolyte to participate in the electrochemical process.

Figure 28. SEM morphological images of (a) Carbon cloth, MoS2 nanosheets synthesized on carbon cloth at (b) 180 °C, (c) 200 °C, and (d) 220 °C.
Download figure:
Standard image High-resolution imageThe effect of growth time on the morphology of the MoS2 and its energy storage capability was reported by Manuraj et al. 182 Using a hydrothermal process at a constant temperature of 180 °C, MoS2 nanostructures were grown directly on Ni foam. Sodium molybdate, thioacetamide (CH3CSNH2), sodium metasilicate (Na2SiO3·9H2O), and HCl synthesized MoS2 at different growth times of 12,24, 36, and 48 h. After 12 h of growth, MoS2 nanospheres are formed on the surface of the Ni foam. However, on the increase in growth time to 24 h, the nanospheres get flattened to form short nanowires. At 36 h of growth, the nanowires form a brush-like appearance on the nickel foam. On the subsequent increase in growth time to 48 h, a collapse in the brush-like morphology was observed with interlinking of the brush-like nanorods. The electrochemical assessment of the electrode was done in 1M KOH as an electrolyte. The galvanometric charge-discharge (GCD) measurement revealed specific capacitance values of 128, 308, 410, and 252 F g−1 at 1 A g−1 for MoS2 electrodes grown at 12, 24, 36, and 48 h, respectively. The maximum specific capacitance was identified in electrodes synthesized with a growth time of 36 h. Figure 29 shows the charge-discharge curves at 1 A g−1 as a function of MoS2 growth time. The growth time of 36 h resulted in the best morphology suitable for easy accessibility of the electrolyte throughout the MoS2 nanostructure thereby, resulting in the highest amount of electrochemical activity compared to other electrodes with different growth times. It is worth mentioning that this study also showed that even with higher mass loading (20–30 mg cm−2), the supercapacitor could still achieve relatively higher specific capacitance and stability.
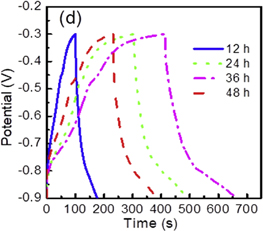
Figure 29. Comparison of charging-discharging curves of MoS2 electrodes with different growth times.
Download figure:
Standard image High-resolution imageMoS2 and carbon composites
One of the ways to overcome the disadvantage of intrinsic resistance present in MoS2 is to form composites with carbon. Carbon in nanotubes, graphene, etc possesses high conductivity and high surface area, making it an ideal candidate to form composites with MoS2. The overall electrochemical performance is improved in carbon-based composites of MoS2 thanks to the synergistic effect of both materials. MoS2 provides a short ion diffusion path, and carbon offers conductive channels and enhanced interfacial contact. 167
Sangeetha et al. were the first to report the use of activated carbon to form composites with MoS2 for supercapacitor application. 177 The activated carbon used in this study was produced from Tendu leaves. The Tendu leaves were cleaned, dried, and carbonized at 400 °C for 2 h. The carbonized leaves were then activated using KOH. The MoS2 was synthesized using ammonium molybdate ((NH4)6Mo7 O24.4H2O) and thiourea using the hydrothermal method at 180 °C. The electrodes were fabricated using different weight ratios (1:1, 1:2, 1:3, 2:1, and 3:1) of MoS2 and activated carbon to identify the best weight ratio suitable for supercapacitor application. 2–5 mg cm−2 of mass loading was maintained for all electrodes. 1:1 weight ratio of MoS2 and activated carbon exhibited the lowest resistivity thereby, was selected for testing as a supercapacitor electrode. 1 M Na2SO4 was used as the electrolyte in this study. The GCD-specific capacitance of 179 F g−1 was identified from the fabricated symmetric supercapacitor. It was also reported that the capacitance retention was calculated to be 89% after 5000 cycles.
Sangeetha et al. subsequently reported MoS2 composite with activated carbon synthesized from Polyethylene terephthalate (PET) bottles. 183 MoS2 composite with carbon was produced using ammonium molybdate, thiourea, and ethylene glycol using the hydrothermal method at 200 °C for 24 h. The MoS2 composite produced using ethylene glycol before activating carbon displayed a flaky flower-like morphology. The author attributes this formation of flower-like morphology to the usage of ethylene glycol as a solvent instead of water which resulted in bulk nanostructures of MoS2 in their previous research. 177 Activated carbon obtained from carbonizing PET bottles was then added in the weight ratio of 2:1 (activated carbon: MoS2) along with NMP as the binder. A higher specific capacitance of 288 F g−1 was measured in this study compared to 179 F g−1 reported in their previous work. The energy density of 36 Wh K−1g−1 was disclosed in this research. The author attributes the increased specific capacitance to the combination of both flake like morphology of the synthesized MoS2 and the porous stacked morphology of the activated carbon used. These two factors potentially led to increased electrolyte ion diffusion in the composite.
MoS2 composites with reduced graphene oxide (rGO) were produced by Ji et al. using a facile methodology. 184 MoS2 and rGO were dry ball milled and mixed in the ratio of 1:1. The mixture of MoS2 and rGO was then reduced using hydrazine. The electrode was fabricated by transferring the binder-free MoS2/r-GO composite onto the graphite sheet. Figure 30 shows the schematic diagram of the preparation of the MoS2/rGO nanocomposite films. 1M H2SO4 was used as the electrolyte in this study. The high specific capacitance of 365 F g−1 was achieved at current rates of 0.5 A g−1 with charge-discharge reversibility of 83%. The energy density was identified to be 89 Wh K−1g−1, which is notably higher than the energy density observed in MoS2/activated carbon nanocomposites. The author accredited this improved performance to the increased electrical conductivity facilitating better electron migration and boosted active electrochemical sites.
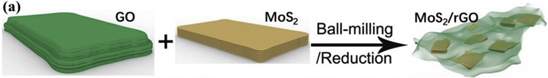
Figure 30. Schematic illustration of the preparation of the MoS2/rGO nanocomposite films.
Download figure:
Standard image High-resolution imageFurther improvement of specific capacitance and capacitance retention was exhibited by MoS2/rGO electrodes fabricated by Saraf et al. 168 MoS2/rGO nanoflowers were synthesized using hydrothermal process by dissolving sodium molybdate and thiourea in GO solution and subsequently heating at 180 °C for 24 h. Glassy carbon (GCE) was used as the working electrode substrate. In this investigation, three different electrodes were compared: glassy carbon electrode, bare MoS2 on glassy carbon electrode, and MoS2/rGO on glassy carbon electrode. Figure 31 shows the comparison of the cyclic voltammetry (at 100 mV s−1) between the three types of electrodes investigated. It can be seen from Fig. 31 that the MoS2/rGO on the glassy carbon electrode showed the best charge propagation and most CV-integrated area under the curve. This could potentially be due to the presence of rGO providing an increased conductivity to the electrode and supplying additional channels for charge transportation. The specific capacitance at a current density of 1.2 A g−1 was noted to be 387.6 F g−1 for MoS2/rGO on glassy carbon electrode, which is almost double the measured specific capacitance 196.2 F g−1 for MoS2 on glassy carbon electrode. It is worth mentioning that the MoS2/rGO on glassy carbon electrode showed nearly 100% capacitance retention up to 1000 cycles.
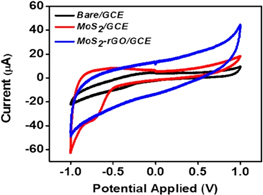
Figure 31. Comparison of cyclic voltammetry curves of the glassy carbon electrode, bare MoS2 on glassy carbon electrode, and MoS2/rGO on the glassy carbon electrode.
Download figure:
Standard image High-resolution imageDoped MoS2
Doping the MoS2 with a metal atom such as Pt, Mn, Ni, Co, etc, is a method currently investigated to improve the capability of MoS2 for supercapacitor application. 185–187 Doping the MoS2 lattice with another atom changes its physical properties, thereby resulting in increased electrochemical performance due to improved catalytic activity. 187 One of the earliest investigations on doping of MoS2 to improve electrochemical performance for superconductor applications was done by Bamidele et al. 185 Cu doped MoS2 was deposited onto glassy carbon electrodes using the electrodeposition method in an aqueous electrolyte containing 10.0 mM of (NH4)2MoS4, 5.0 mM of CuSO4, 0.10 M KCl, and 0.50 M KSCN at pH 6.95. The glassy carbon electrodes were hand polished using alumina powder followed by electrochemical pretreatment to increase the adhesion of electrodeposited Cu doped MoS2. Both Cu-doped MoS2 films and undoped MoS2 films of the same thickness were compared using 1M of Na2SO4 electrolyte. The effect of annealing at 500 °C of the electrodeposited MoS2 was also reported. Results from cyclic voltammetry revealed 2.5–3.5 times higher specific capacitance for Cu doped MoS2 than undoped MoS2. The capacitance retention was also greater than 90% in Cu doped MoS2 compared to 73% in undoped MoS2 for 1000 cycles. The high specific capacitance of 502 F g−1 at 1 A g−1 was identified for annealed Cu doped MoS2 electrode. The author attributes this enhanced performance to the increased conductivity of MoS2 by Cu doping. Figure 32 shows the specific capacitance comparison of different types of electrodes fabricated in this study.
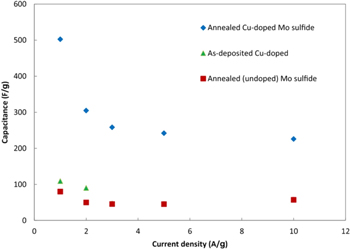
Figure 32. Variation of specific capacitance with current density for different types of fabricated electrodes.
Download figure:
Standard image High-resolution imagePt doped MoS2 for supercapacitance application was investigated by Shao et al. 186 MoS2 nanobelts were synthesized using the facile hydrothermal method of sodium molybdate. Pt doping of the MoS2 was done by adding H2PtCl6 into the precursor mixture during the hydrothermal process. The electrode was fabricated by heating carbon cloth and mixing Pt doped MoS2, thioacetamide, urea, DI water, and ethanol at 220 °C for 24 h. The mass loading of MoS2 was noted to be approximately 3.5 mg cm−2. Elemental mapping of SEM images confirmed the presence of Pt in addition to C, Mo, and S. However, no change in morphology was identified with the incorporation of Pt. The electrochemical performance of both undoped MoS2 and Pt doped MoS2 was evaluated in 1M Na2SO4 aqueous solution. Figure 33 shows CV curves, GCD curves, and specific capacitance comparison of undoped and Pt doped MoS2. It can be seen from Fig. 33 that the Pt doped MoS2 showed a higher capacitance when compared to undoped MoS2. The specific capacitance of Pt doped MoS2 was identified to be 200.875 F g−1 at 1 A g−1 compared to ∼152.74 F g−1 for undoped MoS2. The capacitance retention was determined to be 87.96% after 3000 cycles.
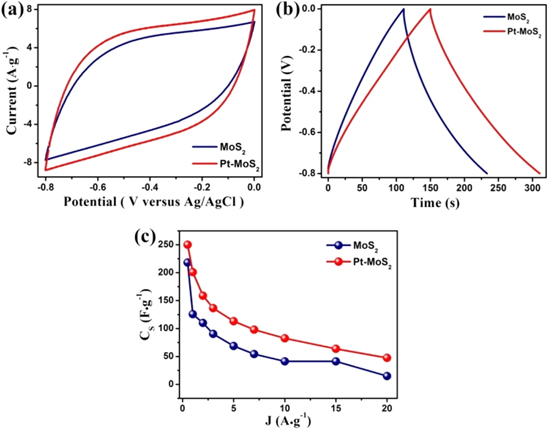
Figure 33. Comparison of (a) CV curves, (b) GCD curves, and (c) specific capacitance obtained for MoS2 and Pt doped MoS2 electrodes.
Download figure:
Standard image High-resolution imageSingha et al. reported improved electrochemical performance of MoS2 nanoflowers by doping with Mn. 187 MoS2 nanoflowers were synthesized using the hydrothermal process of Molybdic oxide (MoO3), Potassium thiocyanate (KSCN), and Sodium Dodecyl Sulfate (SDS) at 180 °C for 24 h. Three different Mn doping content was performed using MnCl2 as the source material. The working electrode for electrochemical evaluation was prepared by coating the active material on graphite sheets using NMP and polyvinylidene difluoride (PVDF) as solvent and binder, respectively. HRTEM analysis revealed an increase in the interlayer spacing with Mn content. The three different doping concentration of Mn into the MoS2 was identified to be 2.5%, 6%, and 7%, respectively. 0.5 M Na2SO4 was used as the electrolyte in this study. The highest specific capacitance value of 351 F g−1 was identified at a current density of 1 A g−1 in the electrode material with the lowest Mn content. The author credits this finding to two possible reasons. The first one is the increase in Mn content resulting in increased formation of MnOx, resulting in a reduction of conductivity. The second reason is the presence of only Mn3 + oxidation states in lowest Mn doped MoS2 compared to the decreased Mn3 + and increased Mn4+ and Mn7+ oxidation states in higher Mn concentration MoS2. Mn3+ oxidation state being an intermediate oxidation state, it is expected to favor Faradic redox reactions thereby, exhibiting higher capacitance.
Hybrid MoS2
We classify hybrid MoS2 as MoS2 that utilizes the different techniques elaborated above to increase its electrochemical performance. These hybrid MoS2 composites exhibit some of the highest specific capacitance values reported in the literature. Chang et al. reported the combination of both carbon composite in the form of hollow reduced graphene oxide spheres (HRGO) along with the doping of MoS2 with Ni to improve the electrochemical performance 187 substantially. SiO2 nanospheres were used as templates to produce graphene oxide (GO) nanospheres. SiO2 nanospheres were added to aqueous poly(diallyl dimethylammonium chloride) (PDDA) along with continuous stirring for 24 h to obtain positively charged SiO2 nanospheres. Due to electrostatic interactions, these positively charged SiO2 nanospheres were then added to an aqueous solution of GO to grow GO nanosheets on the positively charged SiO2 spheres. Nickel nitrate (Ni(NO3)2.6H2O) dissolved in DI water was then added to the SiO2/GO nanospheres, followed by the addition of sodium molybdate dihydrate and thiourea. The mixture was sonicated for 30 min to form a homogenous mixture. This homogenous mixture was then heated to 200 °C for 24 h. The GO was converted into rGO during this hydrothermal process. The SiO2 was removed by adding the precipitates obtained by centrifugation to 40% HF solution. Based on the quantity (0.03 mmol, 0.075 mmol, 0.15 mmol, 0.21 mmol, and 0.30 mmol) of nickel nitrate added, 5 different Ni doping concentrations were formed and compared. Figure 34 shows the schematic explanation of the steps involved in the synthesis process of the HRGO/Ni doped MoS2 composite. The working electrode was fabricated by mixing the active material obtained with polytetrafluoroethylene and acetylene black in a mass ratio of 8:1:1 and then coated on nickel foam substrates. CV and GCD measurements using 1 M Na2SO4 solution revealed increased specific capacitance in composites containing nickel doping compared to the composite with no Ni doping. The highest specific capacitance of 544 F g−1 at a current density of 1 A g−1 was identified for the HRGO/Ni-doped MoS2 composite prepared using 0.15 mmol of nickel nitrate. This high specific capacitance value was credited to the low charge transfer resistance, and low internal resistance was identified in the composite prepared using 0.15 mmol of nickel nitrate compared to composites synthesized using other concentrations of nickel nitrate. The highest capacitance retention value of 91.2% after 2500 cycles was observed in composites prepared using 0.15 mmol of nickel nitrate.
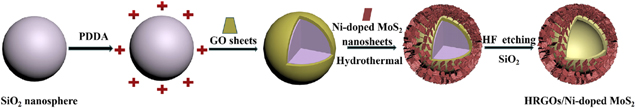
Figure 34. Schematic illustration of the steps involved in the HRGO/Ni-doped MoS2 composite's synthesis process.
Download figure:
Standard image High-resolution imageSilambarasan et al. reported enhanced electrochemical performance using composites of Co-doped MoS2/N and S-doped rGO(SrGO). 188 Composites containing Co-doped MoS2, S-rGO, and N were prepared by hydrothermal method using Co(NO3)2.6H2O and sodium molybdate in the atomic ratio of Co: Mo = 0.5: 1, along with (C2H5NS), 10% N and S-rGO. The mixture was then heated at 200 °C for 24 h. The specific capacitance obtained using CV was compared between Co-doped MoS2/N-SrGO, MoS2, and Co-doped MoS2 electrodes. The Co-doped MoS2/N-SrGO electrode recorded the highest specific capacitance value of 626 F g−1 at 1 A g−1 current density. At a current density of 5A g−1 after 4000 cycles, the highest capacitance retention of 95% was observed in Co-doped MoS2/N-SrGO electrodes compared to 82% and 91% followed for MoS2 and Co-doped MoS2 electrodes, respectively.
One of the highest specific capacitance values of 1493 F g−1 at 0.2 A g−1 using hybrid MoS2/NiS yolk-shell microsphere-based electrodes. 189 The synthesis process used 1-n-butyl-3-methylimidazolium thiocyanate, DI water, NiCl2·6H2O, and ammonium molybdate as precursor materials. This mixture was heated at 180 °C for 24 h. DI water and anhydrous ethanol were alternatively used to wash the black products obtained after heating. The black product was then vacuum dried at 80 °C for 6 h and subsequently annealed at 500 °C for 2 h. This annealing process resulted in the MoS2/NiS yolk shell microsphere formation. The working electrode was fabricated by mixing MoS2/NiS active material, acetylene black (conductive additive), and polyvinylidene fluoride (binder) with a mass ratio of 8:1:1 and then was coated onto Ni foam. The capacitance retention at a current density of 1 A g−1 and after 7000 cycles was estimated to be 93.8 %. The author attributes the enhanced performance to the well-defined yolk-shell structure of MoS2/NiS, which provided increased electroactive sites for redox reaction and higher specific surface area.
Figure 35 shows the SEM images and the graphical schematic explaining the synthesis mechanism involved in this research to form MoS2/NiS yolk-shell microsphere. A time-dependent study was performed at different reaction times of 2, 4, 6, 8, 10, and 18 h with the help of SEM and XRD. After 2 h of initial heating at 180 °C, rod-like structures (as seen in Fig. 35a) were obtained that were confirmed to be Ni2.5Mo6S6.7 using XRD analysis. The rod-like structures decomposed and started to form irregular blocks (Fig. 35b) after 4 h. At this stage, the pure Ni2.5Mo6S6.7 was identified. At 6 h, small nanoparticles covered sphere-like structures at 6 h were noted (Fig. 35c). Additional XRD peaks belonging to NiS were identified at this stage. After 8 h, the small nanoparticles began to grow gradually to form nanoplates on the surface of the nanospheres (Fig. 35d). XRD analysis at this stage revealed the addition of MoS2 peaks, increased NiS peak intensity, and reduced Ni2.5Mo6S6.7 peak intensity. On further increase in process time to 10 h, the nanoplate structures formed on the surface of the nanospheres started coalescing to form nanosheets on top of the nanospheres (Fig. 35e). The Ni2.5Mo6S6.7 peak intensity continued to decrease even at this stage. Beyond 18 h of reaction time, the complete decomposition of the metastable phase Ni2.5Mo6S6.7 occurred with the core structure transforming into MoS2 and/or NiS. Figure 35g clearly shows the schematic representation of the synthesis process.

Figure 35. SEM morphological images obtained during the synthesis of MoS2/NiS yolk-shell microsphere after (a) 2 h, (b) 4 h, (c) 6 h, (d) 8 h, (e) 10 h, (f) 18 h, and (g) schematic illustration explaining the synthesis mechanism involved to form MoS2/NiS yolk-shell microsphere.
Download figure:
Standard image High-resolution image
The final mixture annealing time and temperature have been indicated in the Table IV.
Table IV. Comparison of synthesis and performance of different TMDCs used as supercapacitor electrodes.
| Materials | Synthesis method | Precursors | Electrolyte used | Specific Capacitance (F g−1) | Energy Density (Wh kg−1) | Power Density (kW kg−1) | Capacitance Retention | Temperature | Time | References |
|---|---|---|---|---|---|---|---|---|---|---|
| MoS2 nanosheets on Titanium plates | Hydrothermal Method | Sodium molybdate and thiourea | 1M KCl | 133 at 1 A g−1 | 11.11 | 0.53 | 93% up to 1000 cycles | 180 °C | 12 h | 173 |
| MoS2 nanosheets on carbon cloth | Hydrothermal Method | Sodium molybdate and thiourea | 1M KOH | 151.1 at 10 mA cm−1 | 11.13 | 250 | 86.3% up to 2000 cycles | 180 °C–220 °C | NR | 181 |
| MoS2 nanostructures on Ni foam | Hydrothermal Method | Sodium molybdate, thioacetamide, sodium metasilicate and HCl | 1M KOH | 410 at 1 A g−1 | 12.2 | 0.6 | 92% after 9000 cycles | 180 °C | 12 h, 24 h, 36 h, 48 h | 182 |
| MoS2 composite with activated carbon | Hydrothermal Method | Ammonium molybdate and thiourea | 1 M Na2SO4 | 179 | 21 | 0.225 | 89% after 5000 cycles | 180 °C | 177 | |
| MoS2 composite with activated carbon | Hydrothermal Method | Ammonium molybdate, thiourea and ethylene glycol | 1 M Na2SO4 | 288 | 36 | 469 | 79% after 5000 cycles | 200 °C | 24 h | 183 |
| MoS2 composite with rGO on graphite sheet | Ball milling and reduction | MoS2, rGO reduced using hydrazine | 1M H2SO4 | 365 at 0.5 A g−1 | 89 | 16.7 | NR | NR | NR | 184 |
| MoS2/rGO nanoflowers on glassy carbon | Hydrothermal Method | Sodium molybdate and thiourea in GO solution | 1 M Na2SO4 | 387.6 at 1.2 A g−1 | NR | NR | 100% up to 1000 cycles | 180 °C | 24 h | 168 |
| Cu doped MoS2 on glassy carbon | Electrodeposition method | (NH4)2MoS4, CuSO4, KCl and KSCN | 1M of Na2SO4 | 502 at 1 A g−1 | NR | NR | 90% up to 1000 cycles | NR | NR | 185 |
| Pt doped MoS2 nanobelts on carbon cloth | Hydrothermal method | sodium molybdate, H2PtCl6, thioacetamide, urea, DI water, and ethanol | 1M of Na2SO4 | 250 at 0.5 A g−1 | NR | NR | 87.96% up to 3000 cycles | 220 °C | 24 h | 186 |
| Mn-doped MoS2 nanoflowers on graphite sheets | Hydrothermal method | Molybdic oxide, Potassium thiocyanate, and Sodium Dodecyl Sulfate | 0.5M of Na2SO4 | 351 at 1 A g−1 | 48.9 | 5 | 77% after 5000 cycles | 180 °C | 24 h | 187 |
| Hollow flowerlike rGO spheres/Ni-doped MoS2 on Ni foam | Electrostatic self-assembly and one-step hydrothermal method | An aqueous solution of GO, nickel nitrate, sodium molybdate dihydrate, and thiourea | 1M of Na2SO4 | 544 at 1 A g−1 | NR | NR | 91.2% after 2500 cycles | 200 °C | 24 h | 194 |
| Composites of Co-doped MoS2/N and S-doped rGO(SrGO) | Hydrothermal method | Co(NO3)2.6H2O, sodium molybdate, (C2H5NS), 10% N and S-rGO | 1M of Na2SO4 | 626 at 1 A g−1 | NR | NR | 95% after 4000 cycles | 200 °C | 24 h | 188 |
| MoS2/NiS yolk-shell microspheres on nickel foam | Facile ionic liquid-assisted one-step hydrothermal method | 1-n-butyl-3-methylimidazolium thiocyanate, DI water, NiCl2·6H2O, and ammonium molybdate | 6M KOH | 1493 at 0.2 A g−1 | 31 | 0.1557 | 93.8% after 7000 cycles | 180 °C | 24 h | 189 |
NR—not reported.
Summary And Future Prospects
A comprehensive review of the synthesis and characteristics of recent advances of two-dimensional supercapacitor electrode materials is presented. Recently, supercapacitor electrode materials have been of high research interest due to their high power density, superior cyclic stability, fast charging-discharging rates, and high specific capacitance. While 2D carbon-based materials solve the issues such as lower electrical conductivity and poor stability of their 1D counterpart owing to their larger surface area, good electric conductivity, and better physiochemical properties, they suffer from agglomeration due to Van der Waals forces. These forces reduce the active surface area, restrict ion diffusion, and limit electrochemical performance. Compared to 2D structures, 3D structures can be tuned for large surface areas that provide suitable ion pathways and should be further explored. Moreover, hybrid nanomaterials with carbon network and pseudocapacitive material enhance the energy density and cyclic performance and must be investigated further in detail for commercial adaptation.
2D TMOs and TMHs show promising advantages like large specific surface area, reduced ion diffusion time, high specific capacitance, excellent mechanical flexibility, and better electrochemical performance as compared to the bulk form, which promotes its use in flexible supercapacitor electrode materials which finds application in wearable devices. While they exhibit intriguing chemical and physical properties, 2D TMOs and TMHs undergo several issues which are still not addressed. There is a limited number of parent materials with relevant host crystals. Although numerous studies have been performed on 2D TMOs and TMHs, various synthesis techniques still face the significant challenge of controlling and tuning their thickness, lateral dimensions, structures, and morphology. Furthermore, the electron transport during the electrochemical reactions is restricted due to the inherent low electrical conductivity of TMO and TMH and cracking of electrodes during extended charging and discharging cycles owing to the presence of strain in pure TMO and TMH. Future research on precisely tuning the physical and chemical properties via synthesis techniques and parameters is imperative towards advanced electrochemical performance.
MXenes have recently gathered a lot of attention due to their high electrical and thermal conductivity, hydrophilic nature, high surface area, and excellent oxidation resistance. However, due to the rigid nanosheet morphology of MXene, there is reduced interlayer spacing, resulting in a reduction in ion diffusivity. Engineering of MXene electrodes by physical means to overcome the drawbacks is challenging and has not been fully explored due to its inherent brittle nature. Mxenes are economically costly and display limited electrochemical and environmental stability, limiting their range of applications. Despite the potential of Mxenes, comprehensive ecotoxicological assessments followed by the development of green and facile synthesis techniques are crucial for realizing the goal of energy storage applications.
TMDC possesses a layered hexagonal structure analogous to graphene with weak Van Der Waals forces separating strong interlayer covalent bonds resulting in viable intercalation and deintercalation of cations. TMDCs are among the most extensively researched materials for supercapacitor applications due to their excellent electrochemical property, variable oxidation states, sheet-like morphology, large surface area, and excellent redox charge storage mechanism. Although TMDCs have a tremendous research interest in supercapacitor electrodes, it has not reached their potential due to their disadvantageous intrinsic resistivity, limiting the electron transfer, thereby reducing the increase in specific capacitance.
Future research work should be more geared towards incorporating graphene with other electrode materials such as metal oxides and conducting polymers. The study of the effect of graphene on these electrode materials might help in minimizing the particle size, enhancing the specific surface area, influence porosity, prevent particle agglomeration, enhance the cyclic stability and pseudocapacitance. In an attempt to synthesize a supercapacitor material with the aforementioned characteristics, there has been a recent growth in research towards the development of ternary nanocomposite supercapacitor electrode materials.