

Abstract
The adhesion strength, interface energy, interfacial fracture toughness, and electronic structure of Ag(001)/BaTiO3(001) interface have been calculated by using first-principles theory. Adhesion work is used to analyze interfacial fracture toughness, and electronic structure is used to analyze interfacial charge transfer and bonding. Compared with BaO-terminated, the interfaces composed of TiO2-terminated BaTiO3 and Ag have relatively small interface distance and interface energy, higher adhesion work and interface fracture toughness. Among the six stacking models, M 22 is the most stable interface and has the highest interfacial fracture toughness, the reason of which is that Ag–O bond produced by the hybrid of Ag-5 s orbital and O-2 s orbital. This work provides some theoretical guidance for the experiment and other theoretical research of Ag/BaTiO3 composites, and provides research ideas for the calculation of cermet interface.
Export citation and abstract BibTeX RIS
Barium titanate ceramic, a vital essential ceramic material, is known as "the pillar of the electronic ceramic industry," which is widely used in electronic ceramics. 1 Besides, barium titanate is also used in photocatalysis, 2 nonlinear optics, 3 bioceramics, 4 energy storage, 5 etc. Although barium titanate ceramics have excellent photoelectromagnetic properties, due to their crystal structure, 6 insufficient reliability of mechanical performance limits the application of barium titanate crystals. 7 The mechanical properties of brittle ceramics can be improved by introducing tough materials. 8 The dielectric properties can also be improved by adding metal phases to BaTiO3 ceramics, which is conducive to the miniaturization of MLCC (Multilayer ceramic capacitor). 7,8 The reason why Ag is the thoughtful material for metal-dielectric ceramic composite is that Ag-dielectric ceramic can be heated in air without being oxidized. 9
Many studies have proved that adding Ag to the barium titanate matrix can improve the mechanical and electromagnetic properties of barium titanate, and this improvement process is inextricably contributed to its interface. 9,10 A study conducted by Mohsin Saleem et al. 10 reported that preparation of barium titanate-silver nanocomposite by the Alkoxide-Hydroxide sol-gel process displayed high dielectric performance. In order to understand the nature of the Ag/BaTiO3 interface in depth, it is necessary to clarify the atomic and electronic structure between BaTiO3 and Ag, as well as the initial interaction and thermodynamic stability of the entire Ag/BaTiO3 interface. In addition, the thermal cracks generated in the sintering process of NME (precious metal electrode) MLCC porcelain not only affect the product qualification rate, but some micro crack sources will gradually expand due to thermal stress in future use, resulting in product failure. The Ag/BaTiO3 interface is likely to become the source of potential cracks and the path of expansion due to the large differences in the toughness, strength, and thermal conductivity of the materials on both sides. Therefore, it is of great significance to study the strength of the cermet interface accidentally.
Many different methods have been proposed to measure the bonding strength of the metal-oxide interface. 11 For example, experimental methods have been used by Chen 12 to measure the strength and toughness of Ag/BaTiO3 composites with different Ag content. Besides, Leandro Bolzoni 13 have studied the enhancement of brittle mechanical behavior by adding metallic particles to piezoelectric ceramics. However, these methods are not universal and their results are often contradictory. In addition, most methods cannot provide quantitative results with physical meaning.
With eye-catching development of renew computational codes and the fantastic enhancement of computer calculation power, ab initio calculations have been becoming increasingly accurate and fast in designing new materials and calculating the properties of existing materials. 14,15 Nowadays, Density Functional Theory (DFT) has been widely applied in interface and adsorption simulations. 16–19 Interface energy, electronic structure and bond analysis of interface systems can be precisely described by DFT, which can provide methods and perspectives never seen before to study and research interface reaction and structure at the atomic or molecular scale. Until now, Density Functional Theory has been applied to calculation of the Gas-liquid interface such as n-alkane/water interface properties, 20 the solid-solid interface like MgO/Ag(001) weakly interacting interface, 21 the liquid-solid interface like water-graphene, 22 and so on, which has shown satisfactory results and unexpectedly accurate predictions for interface atomic arrangement and electronic structure calculations and provides a satisfactory solution to calculating interface.
In this paper, the CASTEP module in Materials Studio was used to calculate the interface. The atomic arrangement and electronic structure of Ag(001)/BaTiO3(001) interface were analyzed. The effects of atomic stacking position on interface energy, interface fracture toughness and interface bonding were obtained.
Computational Details
The Curie temperature (Tc) of BaTiO3 crystal is 120 °C (393 K), the structure of which is usually in cubic phase. The lattice parameters of cubic BaTiO3 are a = b = c = 4.010 Ǻ, and the space group is Pm m. Theneutral (001) surfaces of the BaTiO3 perovskites are of great significance for basic research especially in condensed matter physics and other related fields, and also very essential for practical applications, such as numerous microelectronic,
23
photocatalysis,
24
and other high-technology applications.
25
In the research of ferroelectric memory, the M/BaTiO3(001) interface is the most important (M = metal).
26,27
At the same time, the stability of BaTiO3(001) TiO2-terminated surface decreases due to the existence of Ti atom dangling bond, and it shows good adsorption characteristics, so it is suitable for epitaxial growth and interface formation. Therefore, BaTiO3(001) is selected as one side of the interface. At the same time, the combination of Ag(001) and BaTiO3(001) is better by pre calculation. The computational conditions and interface models were simplified in the light of previous similar research of cermet interface calculation.
28–31
All calculations were performed under zero absolute temperature and vacuum environment.
m. Theneutral (001) surfaces of the BaTiO3 perovskites are of great significance for basic research especially in condensed matter physics and other related fields, and also very essential for practical applications, such as numerous microelectronic,
23
photocatalysis,
24
and other high-technology applications.
25
In the research of ferroelectric memory, the M/BaTiO3(001) interface is the most important (M = metal).
26,27
At the same time, the stability of BaTiO3(001) TiO2-terminated surface decreases due to the existence of Ti atom dangling bond, and it shows good adsorption characteristics, so it is suitable for epitaxial growth and interface formation. Therefore, BaTiO3(001) is selected as one side of the interface. At the same time, the combination of Ag(001) and BaTiO3(001) is better by pre calculation. The computational conditions and interface models were simplified in the light of previous similar research of cermet interface calculation.
28–31
All calculations were performed under zero absolute temperature and vacuum environment.
All DFT calculations was performed by using the Cambridge Serial Total Energy Package (CASTEP). 32 Electron exchange and correlation were described using the Perdew–Burke–Ernzerhof (PBE) function of the Generalized Gradient Approximation (GGA). 33 The interaction between valence electrons and the ionic core was described by the ultrasoft pseudopotential, 34 and the valence electron configurations Ag-4d105s1, Ti-3s23p63d24s2, O-2s22p4, Ba-5s25p66s2, were considered in this paper. The electronic ground state can be reached by solving Kohn–Sham equation. 35 Besides, the Broyden-Fletcher-Goldfarb-Shanno (BFGS) method 36 was used to structure optimization and the energy minimization. In the self-consistent calculations, the convergence tolerances of energy, stress, force and displacement were 2.0 × 10⁻⁵ eV atom−1, 0.1 GPa, 0.05 eV Å and 0.002 Å respectively. The calculated parameters and the periodic supercell slabs will make a difference to the computational results. In order to verify the validity of the calculating parameters, the bulk Ag and BaTiO3 and their surfaces were calculated in the first place.
Based on the relevant experimental data, the bulk BaTiO3 and Ag unit cell models were established. Determining K-point and cut-off energy was the primary step, which could be achieved by the convergence test related Monkhorst-Pack k-point sampling grids and cutoff energy. For the plane-wave cutoff energy of 800 eV, k-points meshes of 9 × 9 × 9 for bulk BaTiO3 and Ag unit cells, the deviation of total energy converges less than 2.0 × 10⁻⁵ eV atom−1. Afterward, BaTiO3 and Ag surface slabs shown as Fig. 1 with different number of layers and 15 Ǻ vacuum layer were established, whose surface energy was calculated with diverse calculating parameters. After the number of plate layers and calculating parameters converged, the stable Ag(001) and BaTiO3(001) surfaces were determined. Then the interface modeling is to stack Ag(001) on BaTiO3(001) substrate.

Figure 1. Sketch of surface model. (a) TiO2-terminated BaTiO3(001); (b) BaO-terminated BaTiO3(001); (c) Ag(001); (d-1) TiO2-terminated BaTiO3(001) of 9 layers; (d-2) BaO-terminated BaTiO3(001) of 9 layers.
Download figure:
Standard image High-resolution imageThe supercell method with periodic boundaries was applied in both surface and interface modeling. A vacuum layer with 15 Ǻ was added between two free surfaces to avoid charge interaction between them. All kind of low interface energy models were coming into under consideration. And finally, the following 6 interface models were found by simplifying. The position of atoms at the initial interfaces were shown in Fig. 2. The interface model was to stack the optimized 7-layer Ag(001) surface and 8-layer BaTiO3(001) surface together, and the interface lattice matching degree was 2.75%. M 11, M 12 and M 13 were the stacking interfaces of BaO-terminated BaTiO3(001) and Ag at the top, bridge sites of barium and bridge sites of barium oxygen, respectively. M 21, M 22 and M 23 were the stacking interfaces of TiO2-terminated BaTiO3(001) and Ag at the top sites of titanium and center sites of oxygen, top sites of oxygen,bridge sites of oxygen, respectively.

Figure 2. Six Ag (100)/BaTiO3 (100) interfaces. Green ball, Ba; red ball, O; grey ball, Ti; gray blue ball, Ag. The α in M αβ, the surface termination of BaTiO3 (M 1β, the interfaces formed by BaO-terminated BaTiO3 and Ag; M 2β, the interfaces formed by TiO2-terminated BaTiO3 and Ag); the β in M αβ, the position of Ag relative to BaTiO3.
Download figure:
Standard image High-resolution imageResults and Discussion
Surface energy
Surface energy (γs ) is the excess energy of surface particles relative to internal particles, which can be used for evaluation of surface stability. 37 The γs was usually calculated by the following formula: 38

Where Eslab(N) is total energy of surface supercell slab, whose number of atoms or formulas is N. Ebulk is the total energy of each atom or formulas in the bulk phase. As is the area corresponding to Eslab(N), and the factor 2 is due to the fact that the slab for calculation has two surfaces.
In this section, the convergent surface energy of Ag(001) was obtained by using this formula, which was shown in Table I. When the surface energy of BaTiO3(001) was calculated by this method, the number of atoms in the plate system with odd total number of layers did not match the atomic ratio of the bulk. And for plates with even number of layers, only the average surface energy of two kinds of atoms-terminated could be calculated. Therefore, the method used by Mastrikov 39 to calculate the surface energy of LaMnO3 with different atoms termination could be applied to calculate the surface energy of BaTiO3(001). The surface energy was calculated by using 9-layer surface supercells with different atoms-terminated as shown in Figs. 1-(d-1,d-2). The surface energy is defined as the sum of the cleavage energy Ec and the relaxation energy Er . As the ABO3 crystal was cut along the (001) crystal plane direction, both AO and BO2 surfaces appeared at the same time, so it could be considered that the cutoff energy of the two surfaces were the same. The cleavage energy Ec can be calculated according to the following formula:

Table I. Surface energy convergence and the number of atomic layers.
| Atomic layers (N) | Surface energy (J m−2) | ||
|---|---|---|---|
| Ag(100) | BaTiO3(100) | ||
| BaO-terminated | TiO2-terminated | ||
| 3 | 0.963 | 1.013 | 1.198 |
| 4 | 1.132 | — | — |
| 5 | 1.179 | 1.134 | 1.348 |
| 6 | 1.255 | — | — |
| 7 | 1.280 | 1.262 | 1.393 |
| 8 | 1.280 | — | — |
| 9 | 1.280 | 1.263 | 1.393 |
| 10 | 1.280 | — | — |
| 11 | — | 1.264 | 1.393 |
Where  and
and  are the energy before optimization of 9-layer BaO-terminated and TiO2-terminated BaTiO3(001) surface supercells respectively. Ebulk(BaTiO3) is the total energy of each BaTiO3 in the bulk phase (formulas = BaTiO3). The factor 1/4 is due to the fact that the two surface supercells contain four surfaces. The factor 9 is due to the fact that the two surface supercells contain nine BaTiO3.
The relaxation energy Er is defined as the energy change of geometric plate before and after structural optimization:

Where  and
and  are the energy of slab I before and after optimization respectively. The factor 1/2 is due to the fact that the surface supercell has two identical surfaces. From the calculation results, BaO-terminated BaTiO3(001) has strong stability. The surface energy of BaTiO3(001) with different layers could also be calculated by this method, which was shown in Table I. As shown in Table I the surface energies of Ag(001), BaO-terminated and TiO2-terminated BaTiO3(001) has converged to 1.28 J m−2, 1.26 J m−2 and 1.39 J m−2, respectively, when the number of atomic layers is 7.
Besides, the number of convergence layers and surface energy of Ag surface are consistent with other experimental 40 and computational results. At the same time, in order to better analyze the surface structure, we have made statistics and comparisons of the atomic positions before and after relaxation of different atoms in different layers (refers to Table II). After undergoing surface relaxation, each atomic layer moved to the bulk phase in different degrees, which reduced the distance between the atomic layers. And the closer the distance between the atoms to the surface, the greater the degree of relaxation. As the atomic layer was further away from the surface, there was decreasing degree of displacement compared with the closer one. The phenomenon was due to the atom surface effect, which was caused by the unsaturation of surface atoms. In general, the atoms of solid phase were in a state of mutual attraction, which made the solid atoms stack on top of each other and keep a certain volume and shape instead of scattering away. The above phenomenon of surface atoms relaxation towards bulk phase originated from the asymmetric arrangement of atoms on both sides of the surface layer. Due to the lack of attraction of some atoms on the side of the atomic layer near the surface, the atoms were subjected to the resultant force pointing to the bulk phase. And since the closer to the surface, the greater the degree of this asymmetry, its tendency to move was more obvious. In this BaO-terminated BaTiO3(001) surface calculation, after structural optimization, the position changes of metal atoms in the same number layer were far greater than that of non-metallic atoms in the same layer, which phenomenon was also found in TiO2-terminated BaTiO3(001) surface. In other words, the relaxation of surface led a considerable rumpling that was also found by Padilla, Vanderbilt 41 and Eglitis 42 for BaTiO3(001) surface rumpling.
Table II. Position changes of Ag and BaO-terminated BaTiO3 surface after relaxation.
| Number of layers | Atom | ΔD1 (Å) | Atom (BaO-terminated) | ΔD2 (Å) | Average of ΔD2 (Å) |
|---|---|---|---|---|---|
| 1st layer | Ag | 0.264 | Ba | 0.261 | 0.1725 |
| O | 0.084 | ||||
| 3rd layer | Ag | 0.178 | Ba | 0.165 | 0.1135 |
| O | 0.062 | ||||
| 5th layer | Ag | 0.087 | Ba | 0.103 | 0.073 |
| O | 0.043 | ||||
| 2nd layer | Ag | 0.141 | Ti | 0.02 | 0.0115 |
| O | 0.003 | ||||
| 4th layer | Ag | 0.071 | Ti | 0.06 | 0.035 |
| O | 0.01 | ||||
| 6th layer | Ag | — | Ti | 0.082 | 0.082 |
Note: The reference datum for ΔD calculation is the seventh layers atom and the average of ΔD is the average distance of different atoms in same layer of BaO-terminated BaTiO3.
Adhesion work
Adhesion work (Wadh) is one of the most important characteristic in interface particularities, which is reversible work to separate a complete interface into two free surfaces. 43,44 In calculation of slab interface system, Wadh can be calculated by the following formula:

where Wadh is the adhesion work of interface Ag/BaTiO3, Eslab,Ag and  are the the total energy of Ag and BaTiO3 surface after complete relaxation,
  is the total energy of interface Ag/BaTiO3. A is the interface area corresponding to interface Ag/BaTiO3.
Two methods were applied to calculate Wadh, first of which was UBER method. 45,46 For each interface model with a series of different interfacial distances (D0), Wadh was calculated respectively. A series of Wadh of different models were combined with their corresponding interfacial distances and Wadh-D0 curves were got (shown as Fig. 3). With the increase of D0, the value of Wadh for the six models increased at first and then converged or decreased. The extreme value of Wadh were obtained at a certain D0 as shown in Fig. 3. And the extreme value of Wadh were maximum value for adhesion work and their corresponding value of D0 was optimal interface distance simultaneously (The calculation results were listed in the UBER column of Tables III, IV). What needs to be explained here was that the stability of the interface whose UBER curve had no extremum did have none extreme value with the change of the interface spacing. The interface distance corresponding to the convergence of adhesion work was relative equilibrium spacing. 47 The reason why the optimal interface spacing of these interfaces was selected as the minimum interface spacing corresponding to the convergence of the adhesion work was to save computing resources. For the other method, the interface models with the optimal interface distance obtained by UBER method were completely optimized, and the new equilibrium interface distance Deq and adhesion work were obtained, which were listed in the fully optimized column of Tables III, IV.

Figure 3. Universal binding energy relation curves (UBER) for Ag(100)/BaTiO3(100) interface models.
Download figure:
Standard image High-resolution imageTable III. The Wadh and Deq calculated by two methods.
| Interface model | UBER | Fully relaxed | ||
|---|---|---|---|---|
| D0 (Å) | Wadh (J m−2) | Deq (Å) | Wadh (J m−2) | |
| M 11 | 3.4 | −0.044 | 3.14 | 0.349 |
| M 12 | 3.0 | −0.139 | 3.02 | −0.094 |
| M 13 | 3.0 | −0.120 | 2.97 | −0.087 |
| M 21 | 3.1 | 0.199 | 3.02 | 0.762 |
| M 22 | 2.4 | 0.695 | 2.36 | 1.194 |
| M 23 | 2.7 | 0.386 | 2.56 | 0.980 |
Table IV. DAg-M calculated by two methods.
| Interface model | UBER | Fully relaxed | ||||
|---|---|---|---|---|---|---|
| DAg-O (Å) | DAg-Ba (Å) | DAg-Ti (Å) | DAg-O (Å) | DAg-Ba (Å) | DAg-Ti (Å) | |
| M 11 | 3.40 | 3.47 | — | 3.14 | 3.42 | — |
| M 12 | 3.64 | 3.70 | — | 3.63 | 3.70 | — |
| M 13 | 3.33 | 3.39 | — | 3.30 | 3.42 | — |
| M 21 | 3.65 | — | 3.10 | 3.41 | — | 3.02 |
| M 22 | 2.40 | — | 3,21 | 2.36 | — | 3.13 |
| M 23 | 2.99 | — | 3.06 | 2.92 | — | 2.95 |
Note: DAg-M is the distance between M atom in the first layer of BaTiO3 surface slab and Ag atom in the first layer of Ag surface slab.
After observing and analyzing Tables III and IV, it was found that the relative values of adhesion work (Wadh) and interface distance (D) obtained by the two methods were coincident. At the same time, the difference of interface distance calculated by the two methods was not worth mentioning, But there was a certain gap in adhesion work. The calculated results after complete relaxation could be regarded as equilibrium state. Surface capping and surface atoms had important influence on the interfacial distance and adhesion work. Equilibrium atomic distance showed that the interface composed of TiO2-terminated BaTiO3 surface had smaller interface distance and larger adhesion work than that with BaO as the terminal. Model M 22 had the smallest interface distance and the largest adhesion work, followed by M 23 and interface M 21. These three models were composed of TiO2-terminated BaTiO3 surface and Ag surface. Simultaneously, it was also found that the adhesion work of M 12 and M13 were negative number, which indicated that those two interfaces were unstable. In addition, as long as surface Ag atoms were not at the top of O atoms, its relative position had little effect on the interfacial distance and adhesion work.
There were more oxygen atoms on the surface of TiO2-terminated BaTiO3. Compared with other interfaces, the Ag atoms were all located at the top of O atom in the M 22 interface model. And after optimization, the distance between Ag and O atoms at interfaces decreased, which was more obvious on the Ag–O distance in M 11. It was speculated that the interaction between Ag and O atoms makes M 22 the optimal interface, and the TiO2-terminated BaTiO3 surface had lower interface distance because of the large number of oxygen atoms on the surface.
Based on the above analysis, it could be reasonably inferred that the interaction between the atoms at the interface composed of TiO2 capped BaTiO3 surface was stronger and more stable in thermodynamics. Among these 6 models, M 22 had the smallest interfacial distance and the largest adhesion work, which was probably due to the stronger interaction between Ag atoms and O atoms than Ag atoms and other atoms.
Interface energy
Interface energy (γi ) is the other quantity often used to describe the thermodynamic stability of the interface, which is defined as the difference between the free energy of interface atoms and that of bulk atoms. 48 Interface energy is rarely involved in the literature related to experiments for the reason that it is of great difficulty to obtain accurate interface energy results by means of experiment experiments. And the value of interface energy of solid-solid interface is usually ignored. If there are substances with similar properties and microstructure on both sides of the interface, seeing that the absolute value of the interface energy is very small, it is tolerable to ignore it. However, it is obviously unreasonable to ignore the interfacial energy directly for the interface composed of heterogeneous materials with large difference in properties and microstructure. The two solid materials that make up the interface are completely different, with the interface energy positive, which is mainly due to defects such as lattice distortion at the interface, which increases the instability of the interface. At the same time, the interface atoms with negative interfacial energy are more likely to diffuse, resulting in interface alloying and even forming new interface phases.
Where  is the total energy of fully optimized Ag/BaTiO3 interface model.
  and
and  are respectively the total energy of each atom in the Ag bulk phase and each formulas in the BaTiO3 bulk phase. M and N are respectively the number of Ag atoms and BaTiO3 in Ag/BaTiO3 interface model.
  and
and  are the surface energy of Ag and the BaTiO3 surface slabs, Ai
is the interface area.
are the surface energy of Ag and the BaTiO3 surface slabs, Ai
is the interface area.
The interface energy (γi ) results calculated by formula (5) were listed in Table V. It could be seen from Table V that the interface model with the lowest interface energy was M 22, which was −0.312 J m−2. The order of interface energy from low to high was M 22 < M 23 < M 21 < M 13 < M 12 < M 11. Except for M 22 and M 23 interface energy calculation results were negative, the interface energy of the other interface models were all positive values. And the three interface models with the lowest interface energy were all interfaces composed of Ag and TiO2-terminated BaTiO3, while the BaO-terminated interface had larger interface energy and all of them were positive values.
Table V. The interface energy (γi ) of different interface models.
| Terminated atoms | Interface models | γi (J m−2) |
|---|---|---|
| BaO-terminated | M 11 | 0.676 |
| M 12 | 0.482 | |
| M 13 | 0.443 | |
| TiO2-terminated | M 21 | 0.236 |
| M 22 | −0.376 | |
| M 23 | −0.209 |
The type and relative position of interface atoms were considered in the analysis. The three interface models with low interface energy were TiO2-terminated, which contained more oxygen atoms than the BaO-terminated interface. According to Table IV, the Ag-O atomic distance at the M 22 and M 23 interface with the interface energy negative were the shortest two of the six models, and the Ag-O atomic distance all decreased after complete relaxation. And M 22, had the lowest interface energy of the six interfaces, where the interface Ag atoms were located at the top position of the O atom, in which the Ag–O atom distance was the lowest among all the interface models. Besides, after complete relaxation, the Ag–O atom distance of M 22 model decreased to a greater degree.
In the calculation results of adhesion work (Wadh) and interface energy (γi ) and subsequent analysis, the same conclusion was obtained: interface oxygen atoms played a vital role in adhesion work and interface energy, and the relative positions of Ag–O atoms as well as their interaction would strongly affect the stability of the interface. The correlation between Ag, O atoms was stronger than that of other atoms in the interface. Among the six interface models, the M 22 interface with the smallest interface energy was most likely to form a new interface phase due to atomic diffusion.
Interfacial fracture toughness
The interface is the only way in the process of stress transmission from the matrix to the reinforcing phase, which plays a vital role in the overall strength of the cermet composite. And the fracture performance plays a key role in the strength of the cermet. Ag and BaTiO3 differ greatly in toughness and strength, which makes the interface the location where the properties change the most in the material. When the stress and temperature are constantly changing, the interface is the most vulnerable position, and interface fracture is the main reason for the failure of cermet composites.
Fracture toughness is the impedance value of the material when the unstable fracture starts from cracks or crack-like defects in the specimen or component. The fracture failure of the interface is the process of dividing the interface into two parts, which is similar to the definition of interface adhesion work Wadh, so that Wadh is often used to describe the fracture toughness of the interface. The relationship between Wadh and the critical stress σF required for crack growth can be described by Griffith equation: 49

Where E is Young's modulus, c is crack length. It can be seen that σF increases with the increase of Wadh, so the larger the Wadh, the better the interface fracture toughness of the material. In the study of Chen and Bielawski, it was found that the interfacial fracture toughness along a specific crystal orientation could be calculated by the following formula: 50

Where E[hkl] is the Young's modulus of a material along the crystal orientation with index [hkl]. According to the adhesion work Wadh
and Young's modulus E[hkl],  could be calculated by this formula. Since the materials and crystal orientations of the given interface models were determined, the
  of the interface models could be analyzed qualitatively.
According to the above two formulas, the σF
and  of the interfaces could be analyzed based on the Wadh (as shown in Table III) and E[hkl] of different interface models to analyze the interface fracture toughness. For six different interface models, the order of σF
and
of the interfaces could be analyzed based on the Wadh (as shown in Table III) and E[hkl] of different interface models to analyze the interface fracture toughness. For six different interface models, the order of σF
and  were: M 22 > M 23 > M 21 > M 11 > M 13 > M 12. The Ag and TiO2-terminated BaTiO3 had the largest σF
and
were: M 22 > M 23 > M 21 > M 11 > M 13 > M 12. The Ag and TiO2-terminated BaTiO3 had the largest σF
and  in all interfaces, as well as had better interfacial fracture toughness than others. The calculated values of Young's modes E[hkl] of Ag and BaTiO3 along the [001] direction were EAg,[001] = 15.18 GPa,
 ![${E}_{{{\rm{BaTiO}}}_{3},\left[{\rm{001}}\right]}$](https://content.cld.iop.org/journals/2162-8777/10/9/093004/revision2/jssac08dbieqn18.gif) = 227.08 GPa. Therefore, the value range of
= 227.08 GPa. Therefore, the value range of  for the O top stacking of TiO2-terminated BaTiO3 was 0.26 to 1.04 MPa
 m1/2.
m1/2.
Electron density difference analysis
Electron density difference refers to the difference of the charge density before and after the interface formed by the completely relaxed surface combination. It is usually used to describe the electron transfer between the interfaces and the interaction between interfacial atoms. In order to further analyze the interaction between the interfaces, the electron density difference was calculated. The electron density difference could be expressed as:

Where  is the electron density after the complete relaxation of the interface,
  and
and  are the electron densities of Ag(100) and BaTiO3(100) surface respectively.
As graphically shown in Fig. 4, the charge transfer degree of M 22 and M 23 with lower interface energy was significantly greater than that of other interfaces. The electron transfer around the Ag and O atoms at the M 22 interface and the Ag atoms at the M23 interface were high, which was consistent with the conclusion of the interface energy analysis. At the interface of M 22, electron density decreased around Ag atoms and oxygen atoms near the interface decreases, with the electron density between Ag and O atoms increasing, which was consistent with the formation characteristics of covalent bond. The electron density transfer at the M23 interface also had a similar phenomenon, while the degree of electron transfer was obviously lower than that at the M22 interface. The relatively low change of electron density at M12 and M13 indicated that the interaction between the two solid phases composing the interface was weak and the composed interface was unstable.
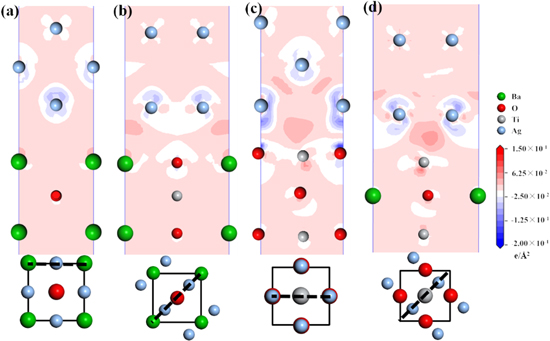
Figure 4. Total valence electron density difference section diagram and corresponding interface stacking model. (a) M 12, (b) M 13, (c) M 22, (d) M 23 (Below is the stacking diagram of the upper and lower atoms near the interface, and the black dotted line is the projection of the section along the interface).
Download figure:
Standard image High-resolution imageThe electron transfer between Ag–O atoms at the interface was much stronger than between Ag–Ba and Ag–Ti atoms, indicating that the interaction between Ag–O atoms was stronger than that between other atoms on both sides of the interface. During the formation of the interface, the contribution between Ag–O atoms was greater than the contribution produced by the interaction between other atoms, which was probably due to the covalent interaction between Ag and O atoms.
Partial density of states analysis
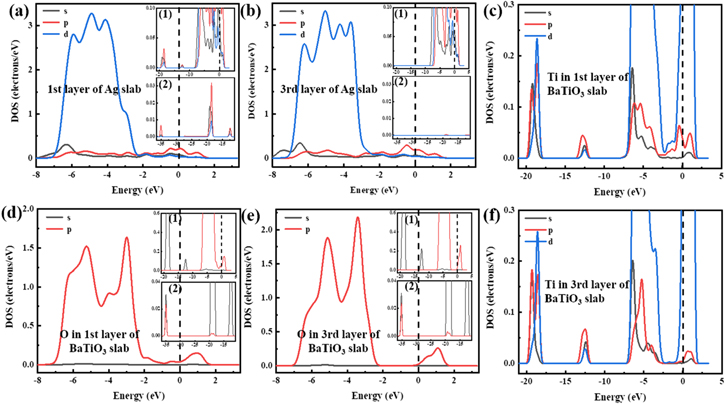
In order to further analyze the bonding mechanism, partial density of states (PDOSs) of different atoms with most stable configuration M 22 at the interface were calculated. The part of PDOSs was shown in Fig. 5. The density of states of the first layer atoms at the interface could clearly reflect the situation of the atoms participating in the interface bonding, and could accurately analyze the hybridization of the electronic orbits of the bonding atoms at the interface. Compared with the first layer atoms, the third layer atoms at the interface were relatively less affected by the interface, and its density of states were closer to the bulk atoms. By comparing it with the first layer of atoms, influence on the atoms by the interface could be obtained, making it easier to analyze the interface bonding. Therefore, in addition to the main figure in Fig. 5 describing the entire PDOSs near the Fermi energy level, the attached figures of density of states of Ag and O atoms were added to illustrating the information of PDOS completely. The enlarged part of PDOSs were pictured in Fig. 5-(1,2).
Figure 5. Partial density of states (PDOSs) for M 22. (a), (b) 1st, 3rd layer of Ag slab; (c), (f) Ti in 1st, 3rd layer of BaTiO3 slab; (d), (e) O in 1st, 3rd layer of BaTiO3 slab. (1, 2) partial enlarged view of PDOSs. The Fermi level is indicated by a vertical dotted line at 0 eV.
Download figure:
Standard image High-resolution image
As shown in Figs. 5a, 5d, there was a significant overlap between the Ag-5 s orbitals of the first layer of Ag atoms and the O-2 s orbitals of the first layer of oxygen atoms from −6 eV to −3 eV, which was mainly around 3 eV and 6.5 eV. At the same time, comparing Figs. 5a, 5d with Figs. 5b, 5e, it was found that a new peak appeared near the o-2p orbital-4ev of the oxygen atom in the first layer of the interface, which overlapped with the Ag-5 s orbital. In addition, comparing their attached figures, new peaks appeared of Ag atoms in the first layer at −12.5 eV, −19 eV, etc., which were corresponding to the peak of oxygen atoms at the interface. In addition, the orbitals of the Ag and O atoms in the interface layer moved to the Fermi level, which indicated that the activity of Ag and O was enhanced due to the influence of interface and made greater contribution to the interfacial bonding.
Owing to the high content of oxygen atoms on the surface of TiO2-terminated BaTiO3(001), the thermodynamic stability of the stacking interface was higher. The Ag atoms in the surface layer were all located at the top of the O atom in M 22 interface. Due to the high activity of the O atoms at the interface, it was easier to achieve orbital hybridization between Ag–O atoms. It was indicated that Ag–O bonds were formed at the interface, and the bonds had some covalent properties. There was no obvious difference in peak position and peak intensity between the first layer of Ti atoms and bulk atoms, which indicated that Ti atoms did not participate in the bonding of interface and made little contribution to the formation of interface.
Conclusions
The electronic structure, stability and interface energy of six Ag(001)/BaTiO3(001) interface models have been systematically investigated by density functional Theory (DFT). The results show that the interfaces composed of TiO2-terminated BaTiO3 and Ag have smaller interfacial distance and interface energy, larger adhesion work and higher interfacial fracture toughness. The thermodynamic stability of these interfaces are higher. The most stable interface is M 22, the Ag atoms of which are all located on the top of O atoms, and the distance between Ag and O atoms decreases during the optimization process. The analysis of electron density difference and PDOS further prove that the Ag-5 s electronic orbital hybridized with the O-2 s electronic orbital and the Ag–O covalent bonds are forms. In addition, due to the more complex application environment, the interface between BaTiO3 and other metals under more complex hot and pressure conditions still needs to be investigated.
Acknowledgments
This work was supported by the National Natural Science Foundation of China (grant no. 51771104, 51971119) and the Future Plan for Young Talent of Shandong University (grant number 2016WLJH40).