Abstract
Tris(trimethylsilyl) phosphite (TMSPi) has emerged as an useful electrolyte additive for lithium ion cells. This work examines the use of TMSPi and a structurally analogous compound, triethyl phosphite (TEPi), in LiNi0.5Mn0.3Co0.2O2-graphite full cells, containing a (baseline) electrolyte with 1.2 M LiPF6 in EC:EMC (3:7 w/w) and operating between 3.0–4.4 V. Galvanostatic cycling data reveal a measurable difference in capacity fade between the TMSPi and TEPi cells. Furthermore, lower impedance rise is observed for the TMSPi cells, because of the formation of a P- and O-rich surface film on the positive electrode that was revealed by X-ray photoelectron spectroscopy data. Elemental analysis on negative electrodes harvested from cycled cells show lower contents of transition metal (TM) elements for the TMSPi cells than for the baseline and TEPi cells. Our findings indicate that removal of TMS groups from the central P-O core of the TMSPi additive enables formation of the oxide surface film. This film is able to block the generation of reactive TM-oxygen radical species, suppress hydrogen abstraction from the electrolyte solvent, and minimize oxidation reactions at the positive electrode-electrolyte interface. In contrast, oxidation of TEPi does not yield a protective positive electrode film, which results in inferior electrochemical performance.
Export citation and abstract BibTeX RIS

This is an open access article distributed under the terms of the Creative Commons Attribution 4.0 License (CC BY, http://creativecommons.org/licenses/by/4.0/), which permits unrestricted reuse of the work in any medium, provided the original work is properly cited.
The electrolyte plays a vital role in lithium ion battery (LIB) cells – not only must it enable Li+ ion transport between the electrodes, it should also form passivating layers (such as the solid electrolyte interphase (SEI) on graphite), and remain stable under the oxidizing and reducing conditions at the positive and negative electrodes, respectively. While conventional carbonate-based electrolytes meet the requirements of commercial LIB cells, the next generation of cathode materials will require high-voltage operating conditions (>4.5 V vs. Li/Li+) in order to meet the demands of higher energy and power. At these higher voltages, the conventional electrolytes experience severe oxidation leading to rapid performance loss and cell failure. Approaches to mitigate electrolyte oxidation at the positive electrode (cathode) include the (i) use of electrolytes with higher oxidation potentials which are intrinsically stable at higher voltages;1,2 (ii) application of cathode protection coatings;3 and (iii) incorporation of additives into the electrolyte that form protective films to stabilize the cathode-electrolyte interface (CEI).4,5 This study addresses the last approach, in cells containing a nickel-rich layered oxide cathode and a graphite-based anode.
Nickel-rich layered-oxides, such as LiNixMnyCozO2 (NMC, where x + y + z = 1) and LiNi0.8Co0.15Al0.05O2 (NCA), are promising high energy density cathode materials for electric vehicle applications.6 While the lower nickel-content oxides display better thermal stabilities (but lower capacities), the higher nickel-content oxides display higher capacities (but lesser safety). A major drawback of these oxides is the loss of lattice oxygen at high states of delithiation.6,7 This oxygen loss has been correlated with electrode impedance rise due to phase transformations at the oxide surface.8–10 In addition to the impedance rise these layered oxides also suffer from transition metal dissolution resulting from the presence of corrosive protic species (such as HF, alcohols, etc.) in the electrolyte.11–13 Therefore, the use of electrolyte additives that can (i) sacrificially form a protective layer on the cathode and (ii) mitigate the generation of protic species in the bulk electrolyte are critical to enabling these oxide materials to perform under high-voltage operation conditions.
The relatively recent introduction of silyl-substituted electrolyte additives, such as tris(trimethylsilyl)phosphite (TMSPi) (molecular structure shown in Figure 1),14 has led to numerous experimental and computational studies on these additives.15–27 Various studies have investigated the use of TMSPi in binary mixtures with compounds, such as vinylene carbonate (VC),26 and in ternary mixtures of TMSPi and other additives.20,21 For example, in a comprehensive study performed by Dahn and coworkers (which examined over 110 electrolyte additive blends), a ternary mixture containing 2 wt% prop-1-ene-1,3 soltone (PES) + 1 wt% methylene methane disulfonate (MMDS) + 1 wt% TMSPi was shown to give a combination of high coulombic efficiency, low impedance, and superior long term performance in NMC333/Graphite (Gr) full cells (2.8–4.2 V range), out-performing all the other electrolyte additive blends.20
Figure 1. Molecular structures of tris(trimethylsilyl) phosphite (TMSPi) and triethyl phosphite (TEPi).
Detailed mechanistic investigations on the use of TMSPi as an electrolyte additive are limited17–19,22 and in all reported systems the observed benefits of TMSPi have been attributed to two common traits: formation of a protective film on the cathode, and elimination of HF from the electrolyte. While the reaction of HF with trimethylsilyl (TMS) groups is well documented both experimentally18,22 and computationally,19,23,25 the formation of TMSPi-based surface films is poorly understood. Even less is known about the effects of triethylphosphite (TEPi) (Figure 1) in LIB cells: the compound has been shown to benefit cells by acting as an oxygen scavenger28 and as a flame retardant.29 However, for unidentified reasons, its use as an electrolyte additive hurts the electrochemical performance of cells.30
In this manuscript we investigate mechanisms associated with the use of TMSPi and TEPi as structurally analogous electrolyte additives in a 1.2 M LiPF6 in EC/EMC, 3:7 w/w (baseline) electrolyte. Full cells containing a LiNi0.5Mn0.3Co0.2O2 (NMC532)-based positive electrode and a graphite-based negative electrode were cycled between 3.0–4.4 V at 30°C to determine effects of the additives on capacity retention and impedance rise. In order to discern the effects of TMSPi and TEPi, surface film formation on the positive electrodes was examined using X-ray photoelectron spectroscopy (XPS), and the transition metal (TM) content on negative electrodes was determined using Inductively Coupled Plasma - Mass Spectroscopy (ICP-MS) analysis. We conclude that differences in the functional group (ethyl vs trimethylsilyl) appended to the tricoordinate phosphorous atom core of the additive are important. The ability of the functional group to react with fluorinated species in the bulk electrolyte, to prevent (or undergo) hydrogen abstraction under high-voltage conditions, and to form (or inhibit formation) of a protective surface film at the positive electrode are all factors that have a significant effect on cell performance.
Experimental
All electrodes in this study are from the Cell Analysis, Modeling and Prototyping (CAMP) facility at Argonne. The positive electrode contained a coating of 90 wt% Li1.03(Ni0.5Mn0.3Co0.2)0.97O2 (TODA America), 5.0 wt% PVDF binder (Solvay, Solef 5130) and 5.0 wt% C45 carbon black (Timcal) on an aluminum current collector. The negative electrode contained a coating of 92 wt% A12 graphite (Phillips 66 CPreme), 6 wt% PVDF binder (Kureha, KF 9300) and 2 wt% C45 carbon black (Timcal) on a copper current collector.12 The coin cells also contained a Celgard 2325 (PP/PE/PP) separator and the baseline electrolyte (Tomiyama, Japan), with and without the additives. The TEPi (98%) and TMSPi (≥95%) compounds were purchased from Sigma Aldrich and used as received. In this manuscript, cells with only the baseline electrolyte (1.2 M LiPF6 in ethyl carbonate/ethyl methyl carbonate (EC/EMC), 3:7 w/w) are referred to as the baseline (or Gen 2) cells: those with 1 wt% TEPi (60.2 μM) and 1 wt% TMSPi (33.5 μM) in the baseline electrolyte are referred as TEPi and TMSPi cells, respectively.
All electrochemical data were collected on MACCOR cyclers using 2032-type coin cells assembled in an argon-atmosphere glove box; multiple cells were used for each test condition. The cell assembly and testing followed standard procedures that are detailed in a recent article by Long and coworkers.31 Prior to cell assembly, the electrodes were dried at 110°C, and the separator at 70°C, in vacuum ovens. Galvanostatic charge/discharge cycling was conducted between 3.0–4.4 V at 30°C. Four initial (formation) cycles at a C/10 rate were followed by aging cycles at a C/3 rate, which included a 3 h constant voltage hold at 4.4 V. Hybrid pulse power characterization (HPPC) tests were performed intermittently through the aging cycles to obtain area specific impedance (ASI) data.12
In order to explore aging mechanisms, electrodes were obtained from cycled cells that were disassembled in an argon-atmosphere glove box. The positive electrodes were lightly rinsed with dimethyl carbonate (DMC, Sigma Aldrich, >99%, anhydrous) and examined using a PHI 5000 VersaProbe II XPS system from Physical Electronics; details of instrumentation and analysis procedures are available in Ref. 12. The XPS spectra were obtained using Al Kα (1486.6 eV) radiation. Peak fits of all spectra were performed using Shirley background correction and Gaussian-Lorentzian curve synthesis available in the CASAXPS software. The energy scale was adjusted based on the 285.0 eV peak in the C 1s spectra. The XPS spectra were normalized so that the area under a region equals the atom percentage of that element in the sample.
Transition metal content in the negative electrodes was quantified using a Perkin Elmer/Sciex ELAN DRC-II ICP-MS system calibrated using NIST traceable standards.32 In preparation for the analysis, the electrodes were lightly rinsed with DMC to remove residual electrolyte. The electrode coatings were then scraped off the copper current collector, weighed, then incinerated at 600°C for 16 h; the resulting residue was dissolved in an acidic medium and diluted as needed for the experiments. The TM contents were calculated from the measured molar concentrations in the liquid solution, and reported in μg/g, where g refers to the coating weight before incineration.
Results
Capacity retention
The cycling performance of NMC532/graphite full cells, with and without the electrolyte additives, is shown in Figure 2. As described earlier, the cycling protocol includes faster (aging) cycles at a ∼C/3 rate and periodic slower cycles at a ∼C/10 rate to determine cell capacity retention as these slower cycles are less affected by the rise in cell impedance.12
Figure 2. Data from NMC532/graphite full cells containing the baseline, TMSPi and TEPi electrolyte solutions: (a) Capacity-voltage profile of the first (solid), second (dashed) and 119th (dotted) cycles (all ∼C/10); (b) Discharge capacity versus cycle number; and (c) Coulombic efficiency as a function of cycle number.
The capacity-voltage profiles of the first, second, and 119th cycles are displayed in Figure 2a. The first cycle charge capacities of the baseline, TMSPi and TEPi cells are 220, 220.5 and 226 mAh/g, respectively; the corresponding discharge capacities are 191, 190 and 194.5 mAh/g, which yield coulombic efficiencies (CE) of 86.9, 86.2, and 86.1%, respectively. It is evident that the TEPi cells show the highest charge and discharge capacities but the lowest CE. The second cycle profiles of all the cells are quite similar; the coulombic efficiencies are higher than those of the first cycle, as expected. The profiles are also similar for the 119th cycle, except for the slightly higher capacities displayed by the TMSPi cells.
This higher capacity is more easily seen in Figure 2b, which contains plots of cell discharge capacity vs cycle number: the data are averages of capacities from multiple cells. For each cell chemistry, data from individual cells lay within a tight band indicating excellent cell-to-cell reproducibility and confirming the validity of our cell assembly protocol.31 The capacity retention of the baseline, TMSPi and TEPi cells after 119 cycles, determined from the C/10 data in Figure 2b, are 85.6, 88.8, and 81.7%, respectively. Note that even though the TEPi cells have a higher initial discharge capacity, the capacity retention after 119 cycles is lower than that of the baseline and TMSPi cells. The causes of this behavior will be discussed in a later section. The coulombic efficiency data over the 119 cycles is shown in Figure 2c. The lower efficiencies observed every ∼20 cycles are a consequence of the C-rate changes in the test protocol, as explained in the article by Long et al.31 Figure 2c indicates that the CE values are highest for TMSPi, and lowest for the TEPi, which is consistent with the capacity retention values for these cells.
Capacity fade rate data obtained from the discharge capacity versus cycle number plots for the baseline, TMSPi and TEPi containing cells are shown in Figure 3. To calculate these fade rates, the last ten C/3 cycles prior to the HPPC tests were used. A linear fit (R2 >0.95) was applied to the cycles; the fits are shown as solid lines overlapping the C/3 markers (Figure 3a). The slopes of these fits, for the five ranges indicated, are shown in the inset table. These slopes, which indicate the average capacity loss per cycle, are shown as bars in Figure 3b. An examination of Figure 3b shows that for the baseline cell the capacity fade rate (0.36 mAh/goxide) is highest in range 1, but decreases and reaches a plateau by range 3 (0.27 mAh/goxide). The TEPi cells show a trend similar to that of the baseline cells with a high capacity fade rate in range 1 (0.40 mAh/goxide) that plateaus by range 3 (0.35 mAh/goxide). The TMSPi cell shows a consistent capacity fade rate (0.25 mAh/goxide) over the cycling protocol (ranges 1–5). It is clear from Figure 3b that the average capacity loss per cycle is highest for the TEPi cells over all ranges, whereas that for the baseline cells is only slightly higher than that of the TMSPi cells by range 3.
Figure 3. Capacity fade rate values for NMC532/graphite full cells containing the baseline, TMSPi and TEPi electrolyte solutions: (a) The ten C/3 cycles prior to the HPPC measurements in all cycling ranges are indicated by solid lines in these discharge capacity versus cycle number plots; (b) The average capacity loss per cycle (in mAh/goxide) for the various cycling ranges. The highlighted cycles in (a) are represented as one bar; a dashed line connecting the bars serves as a visual aid.
Impedance rise
While capacity retention is an important performance measure, the ability of a LIB cell to charge and discharge quickly is an important characteristic for electric vehicle applications. On the road, vehicle batteries must be able to withstand the effects of both acceleration (high currents due to rapid discharge) and regenerative breaking (high currents due to rapid charge) without significant degradation over time. To measure the ability to deliver (accelerate) and receive (regenerate) high current pulses over a voltage range, hybrid pulse power characterization (HPPC) tests are performed intermittently during cell cycling.12,33,34 In our HPPC tests a fully charged cell (upper cutoff voltage of 4.4 V) is subjected to a series of current pulse profiles with the following segments repeating: (i) a 10% depth of discharge (DOD) constant-current C/1 discharge (based on the initial capacity of the cell); (ii) a 1 h rest period; and (iii) a pulse profile containing constant-current discharge (2C) and charge (1.5C) 10-second pulses. Area specific impedance (ASI) values are calculated by multiplying the derived charge and discharge resistance data with the geometric area of the positive electrode (1.54 cm2). The ASI value is calculated for every 10% DOD pulse in the HPPC cycle and then plotted as a function of the open circuit voltage.12
Discharge-pulse ASI plots for the baseline, TMSPi, and TEPi cells are shown in Figures 4a–4c; ASI data at full cell voltages of 3.7 and 4.2 V are shown in Table I. In the figures, the voltages at which data were obtained are marked with the filled circles; the line that connects these points simply serves as a visual aid. All plots contain data obtained during cycles 7, 30, 53, 76 and 99; it is evident that cycle 7 shows the lowest ASI values, whereas cycle 99 shows the highest values, indicating that cell impedance increases on aging (see Figure 4a).
Figure 4. Discharge-pulse area specific impedance for the (a) baseline, (b) TMSPi and (c) TEPi cells as a function of cell voltage and cycle number (color coded). In panels (b) and (c), the baseline cell data are shown in gray. In panel (d) the average ASI values at a cell voltage of ∼3.7 V are shown for cells containing the indicated electrolyte systems.
Table I. Selected ASI values (Ω-cm2) at voltages of ∼3.7 V and ∼4.2 V for the baseline, TMSPi and TEPi cells. The percent ASI rise is between cycles 7 and 99.
| Baseline | TMSPi | TEPi | |
|---|---|---|---|
| Cycle 7 ASI @ ∼3.7 V | 21.0 | 21.5 | 24.1 |
| Cycle 99 ASI @ ∼3.7 V | 35.4 | 31.3 | 40.1 |
| % ASI rise @ ∼3.7 V | 68.6% | 45.6% | 66.4% |
| Cycle 7 ASI @ ∼4.2 V | 23.5 | 24.3 | 27.1 |
| Cycle 99 ASI @ ∼4.2 V | 51.7 | 42.1 | 52.4 |
| % ASI rise @ ∼4.2 V | 120.0% | 73.3% | 93.4% |
The data from the baseline cells are included in Figures 4b and 4c as a series of gray lines, which helps to show the influence of the electrolyte additives. The initial impedance (cycle 7) of the TMSPi cells is comparable to that of the baseline cells; however, the impedance rise is lower during cycling. In contrast, not only is the initial impedance higher but the overall impedance of the TEPi cells is always measurably higher than that of the baseline cells. The impedance rise at a cell voltage of ∼3.7 V (a ∼50% state of charge), displayed in Figure 4d, highlights this behavior. The trend is also evident in Table I; the impedance rise at ∼3.7 V is 69, 46, and 66%, and at 4.2 V is 120, 73, and 93%, for the baseline, TMSPi, and TEPi cells, respectively.
XPS studies of the positive electrodes
XPS data from a pristine (not-cycled) positive electrode and from positive electrodes harvested from cycled cells are shown in Figure 5. The 'formation' data (dashed lines) are from cells that underwent four C/10 cycles in the 3.0–4.4 V range at 30°C. The 'aged' data are from cells that completed the test protocol (i.e., after 119 cycles). The harvested electrodes were rinsed with DMC prior to analysis to remove residual electrolyte. Table II lists the elemental concentrations (at%) obtained from these XPS spectra that reflect the compositions in the top ∼5 nm of the electrode surface.
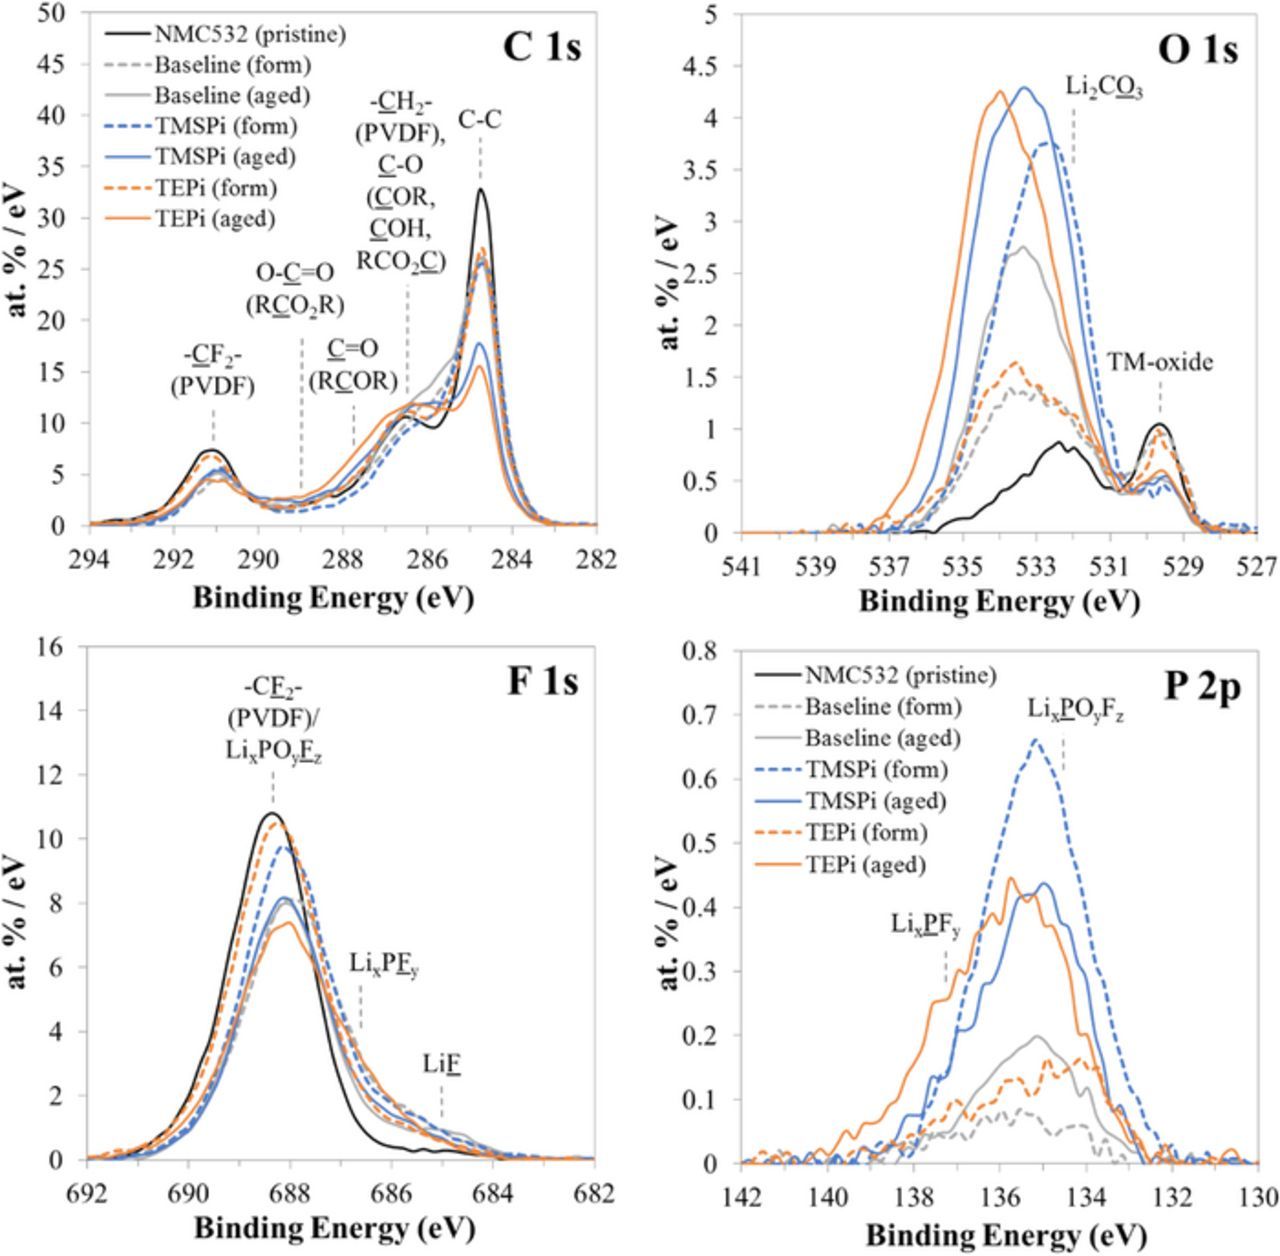
Figure 5. XPS spectra from a pristine (non-cycled) positive electrode and from harvested positive electrodes from the baseline, TMSPi and TEPi cells after formation cycling (form) and after aging cycling (aged). The color-coding identifies spectra in the various plots.
Table II. Elemental compositions (at%) calculated from the XPS data.
| Electrode | C 1s | O 1s | F 1s | P 2p |
|---|---|---|---|---|
| NMC532 (pristine) | 72.4 | 3.9 | 23.7 | 0.0 |
| Baseline (formed) | 70.2 | 6.8 | 22.7 | 0.3 |
| Baseline (aged) | 69.9 | 9.3 | 20.2 | 0.6 |
| TMSPi (formed) | 61.9 | 12.1 | 24.0 | 2.0 |
| TMSPi (aged) | 61.8 | 15.8 | 21.0 | 1.4 |
| TEPi (formed) | 67.0 | 7.1 | 25.3 | 0.6 |
| TEPi (aged) | 60.9 | 15.7 | 21.7 | 1.7 |
For the pristine positive electrode, the C 1s spectrum shows three peaks, from the amorphous carbons at 285.0 eV and from the PVDF binder (-CF2- and –CH2- bonds at 291.0 and 286.5 eV, respectively). The F 1s spectrum shows one peak at 688.4 eV, originating from the PVDF binder. The O 1s spectrum shows two peaks of similar intensities, from the TM-oxide at 529.7 eV and from oxide surface impurities at 532.2 eV.
After formation cycles, the main peaks in the C 1s and F 1s spectra show lower intensities suggesting coverage of the carbon and binder components. In the F 1s spectra, intensity increases centered around 685 eV and 686.5 eV suggest the presence of Li-F and P-F bonds in these surface films. The films also contain oxygen and phosphorous as seen in the O 1s and P 2p spectra (also see Table II). The biggest change is seen for the TMSPi electrode which displays a large, broad peak centered at 532.8 eV in the O 1s spectrum and a suppression of the TM-oxide peak at 529.7 eV. Additionally, a significant peak centered at 134.9 eV in the P 2p spectrum is observed for the TMSPi cell as well as a peak associated with Li at 56.0 eV in the low binding energy region (see Figure S1 in the supporting information). These data suggest the presence of a relatively thick film, containing a PxOy species similar to the molecular structure of the TMSPi additive core. In contrast, the baseline and TEPi cells show smaller (and similar) changes to the O 1s and P 2p spectrum with both forming a thinner surface film as evidenced by the presence of the TM-oxide peak.
After 119 cycles, the intensity of the amorphous carbons and PVDF binder peaks in the C 1s spectra decreases further indicating additional coverage during the cycling. On the TEPi electrode we observe higher intensities in the 286–288 eV range, compared to those of the baseline and TMSPi electrodes, indicating compounds with C=O bonds. The binder peak intensity in the F 1s spectrum decreases, but the 685 eV and 686.5 eV intensities change little, indicating that the Li-F and P-F contents are mostly unchanged. Again, the biggest changes are noted in the O 1s spectra; all cells show intensities in the 531–536 eV range that are stronger than those for the formed electrodes. The difference is especially striking for the TEPi electrode, which displays intensities that are comparable to those of the TMSPi sample. Table II shows that the oxygen concentration increases from 7.1 to 15.7% for the formed and aged TEPi samples, respectively; the corresponding values for the TMSPi samples are 12.1 and 15.8%, and for the baseline samples are 6.8 and 9.3%, respectively. Changes are also seen in the phosphorous concentrations, which increase on aging for the baseline (from 0.3 to 0.6%) and TEPi (from 0.6 to 1.7%) samples but decrease (from 2.0 to 1.4%) for the TMSPi sample. For the TEPi sample, the P 2p spectra (Figure 5) show intensity increases both in the 134–136 eV range (P-O bonds), and in the 137–139 eV range (P-F bonds); on the other hand, the TMSPi sample shows an intensity decrease in the P-O range suggesting modifications in the composition and/or thickness of the surface films during the aging cycles.
During the XPS measurements we also collected data in the 96–108 eV range, which corresponds to the expected Si 2p range for Si-bearing compounds (see Figure S1 in the supporting information). No additional intensities were evident in this range, indicating the absence of Si-bearing species in the electrode surface films. This result contradicts assertions from a previous work, which indicates Si-presence in the positive electrode surface films of TMSPi cells.17 One possibility is that the previously reported silicon is from electrolyte residue left behind on the electrode because of inadequate rinsing.
ICP-MS analyses of the cycled negative electrodes
One explanation for the observed capacity fade is the deposition of TMs (specifically Mn) on the graphite electrode leading to accelerated electrolyte decomposition and Li-trapping in the graphite SEI.12,32 Numerous studies investigating TMSPi have indicated its ability to react with HF in the bulk electrolyte.18,19,22,23,25 Experiments in our laboratory have confirmed that TMSPi presence in the baseline electrolyte leads to the disappearance of HF; on the other hand, TEPi presence does not affect the HF content in the electrolyte. Because HF is expected to accelerate metal-ion dissolution from the positive electrode, we would expect to see differences in TM concentration on the graphite electrodes between the different electrolyte systems.
Figure 6 shows the measured Mn, Co and Ni concentrations in the graphite electrodes given in parts per million of the dry weight. For all three electrolytes the Mn concentration is highest, followed by Ni and then Co (Figure 6a). We note that the total TM content is lowest for the TMSPi, and highest for the TEPi, samples (Figure 6b). Figure 6b also includes a scatter plot of Mn (and TM) content plotted versus cell capacity fade. It is evident that a lower cell capacity fade correlates with a lower amount of Mn and TM deposition on the graphite electrode, in agreement with the recent article by Gilbert et al.32
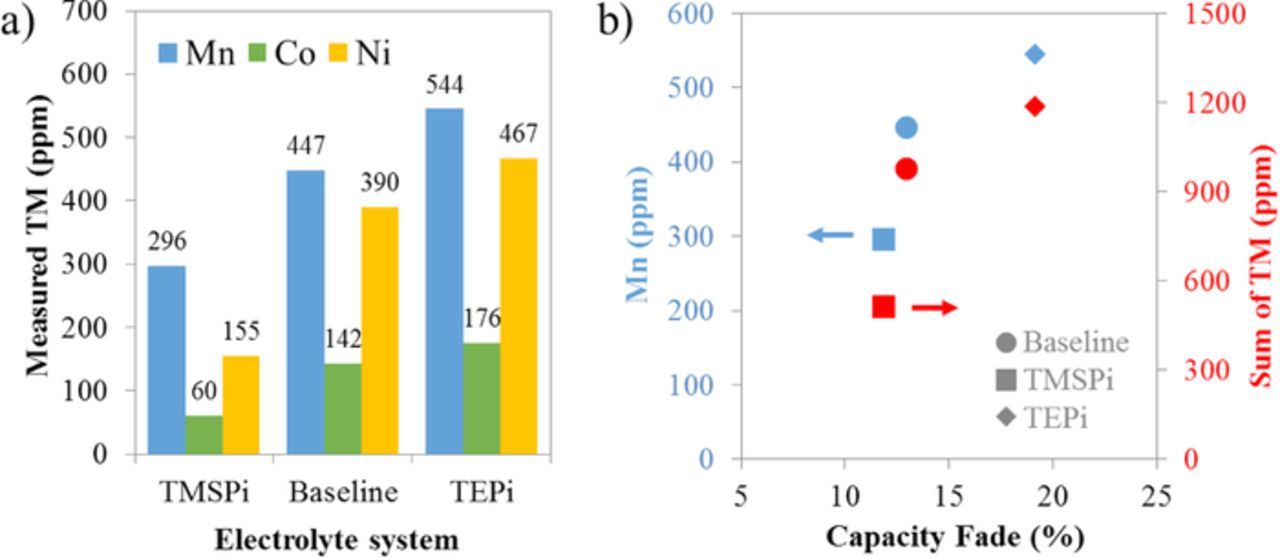
Figure 6. (a) Measured Mn, Co and Ni concentrations (in ppm or μg/g) in graphite electrodes harvested from cells with the baseline, TMSPi and TEPi electrolytes. (b) Mn and total TM concentrations (Mn, Co, Ni) plotted versus the discharge capacity fade.
Discussion
To account for the performance degradation of the baseline cell the following mechanism is proposed (see Figure 7a).35 At the higher cycling voltages, reactive nonbridging oxygen dangling bond centers (M-O• radicals) abstract hydrogen atoms from solvent molecules36 generating solvent radicals and transient M-OH species. The abstracted hydrogen can react with fluorine species in the electrolyte to form corrosive acids (such as HF) that enhance TM dissolution from the oxide electrode.35 These dissolved TM elements (especially Mn) migrate, diffuse, and deposit at the negative electrode. At this location Mn2+ ions are able to accelerate electrolyte reduction and form species that coordinate Li+ ions, sequester them in the SEI and thus decrease the overall amount of cyclable Li+ ions in the cell resulting in capacity fade.13,37,38 Further hydrogen abstraction from the solvent upon oxidation, and deprotonation of the M-OH species, regenerates the reactive metal-oxide radical species continuing the catalytic cycle.
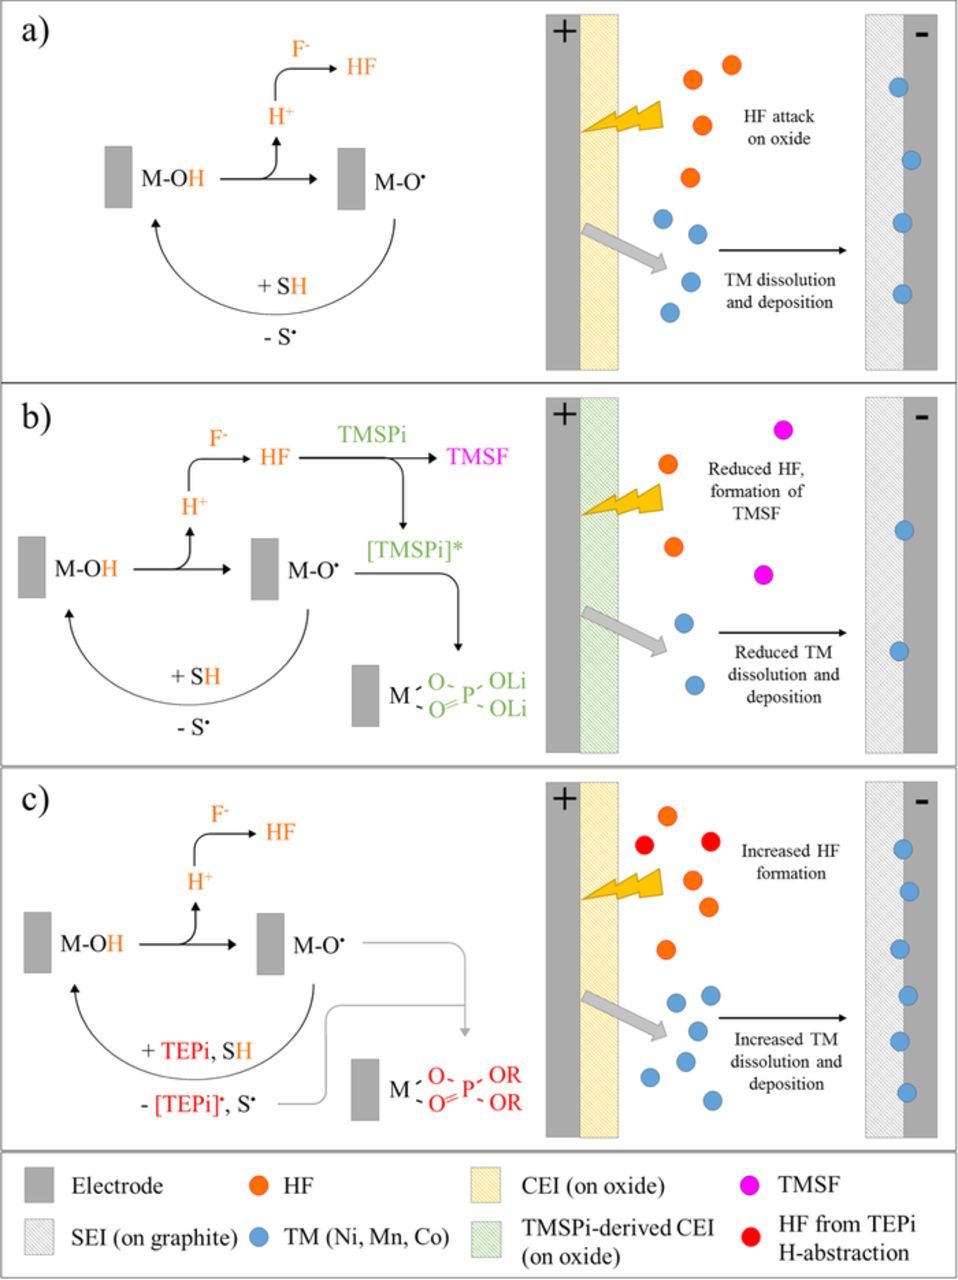
Figure 7. Schematic adaptation of the electrocatalytic cycle proposed by Shkrob and Abraham35 and the role of TMSPi and TEPi on the formation of oxide surface films and TM dissolution.
Impedance rise in layered oxide/graphite full cells has been shown to occur primarily at the positive electrode: contributions from the negative electrode are relatively small. Previous studies12,38,39 have indicated that, in the absence of additives, the impedance rise can originate through: (i) the presence of resistive electrode surface films,38 (ii) increasing separation of primary particle grain boundaries during cycling,32,40 and (iii) oxygen-loss from the oxide particle surface giving rise to higher impedance crystal structures and/or electrochemically inactive phases.8,9 For the baseline positive electrode we propose that TM dissolution leads to high impedance sites on the oxide; however, all the factors listed above likely work in tandem to increase cell impedance.
For the TMSPi cells we propose that the reaction of the TMS groups in the additive with HF leads to the formation of trimethylsilyl fluoride (TMSF) and a phosphorus intermediate by-product ([TMSPi]*) as shown in Figure 7b. In close proximity to the oxide surface the highly reactive M-O• species forms a bond with the central P atom of the [TMSPi]* intermediate forming the P- and O-rich surface film detected by XPS. For this bond to form, the scission of at least one TMS group must occur; however, the removal of two or all of the TMS groups from the central P-O moiety prior to surface film formation is entirely possible. Quenching of the reactive M-O• sites with the phosphorus-bearing film reduces hydrogen abstraction from solvent molecules and in turn reduces the formation of corrosive acid species. Subsequently, less TM dissolution from the oxide and less deposition on the graphite electrode occurs as evidenced by the lowest measured TM concentration on the graphite electrode. Additionally, the lower overall impedance rise can be rationalized by (i) a reduction in oxide surface phase transformations due to lower TM dissolution from the oxide and (ii) the presence of a protective oxide surface film composed of a compact and conductive POxLiy layer.
For the TEPi cells, the higher first cycle charge and discharge capacities (Figure 2) are worth noting; the additive apparently acts as a sacrificial oxidant that can mitigate some of the capacity loss during SEI formation in the initial charge cycle. The possibility of such parasitic surface reactions on the positive electrode leading to higher charge capacities has been proposed by other researchers.41 With this in mind, the deleterious effect of TEPi on both cell capacity fade and impedance rise can be rationalized as follows. We propose that the oxidation of TEPi, as indicated by the high first cycle charge capacity, occurs via hydrogen abstraction from the TEPi alkyl groups initially generating more HF species compared to the baseline cell (Figure 7c). Unlike TMSPi, TEPi does not initially form a surface film on the oxide electrode, as evidenced by XPS of the formed electrode, allowing the M-O• catalytic centers to continue oxidizing solvent molecules generating corrosive acids. The oxidized TEPi material, [TEPi]•, does eventually form a P- and O-rich surface film on the oxide positive electrode as seen from XPS data on the aged electrode. The resulting increase in HF concentration would lead to an increase in TM dissolution and deposition at the negative electrode, which is in agreement with the ICP data from the cycled graphite electrode. As the XPS data shows no significant surface film after formation cycles, the higher initial impedance could be a consequence of the enhanced TM dissolution due to the TEPi oxidation.
The differences in the surface film formation between TEPi and TMSPi may be steric in nature: for TMSPI, scission of the TMS groups leaves behind a smaller P-O structure that easily attaches to the oxide; while for TEPi, the steric hindrance caused by the alkyl groups makes it difficult for the central P atom to react with the TM-oxide species at the oxide surface. Therefore, while TMSPi readily forms a film at the oxide surface after formation cycling, TEPi requires a longer time to form a surface film. Furthermore, the higher quantity of C=O bonds indicates that the alkyl group presence affects the nature of the TEPi film, which could be more resistive to Li+ ion transport.
The capacity fade data presented in Figure 3 could be explained by the rate of surface film formation in the cells. The TMSPi cells show a consistently low rate of capacity fade throughout the cycling protocol, which correlates with the presence of a beneficial surface film formed after formation cycling. In contrast, the baseline cell initially shows a faster capacity fade rate which eventually levels off to a rate similar to the TMSPi cells. The TEPi cell follows a similar pattern; however, the capacity fade rate is higher both initially and during the later stages of cycling. As suggested by Figure 5, the baseline and TEPi cells do not form protective oxide surface films after the formation cycles. We propose that the presence of a beneficial surface film, which can prevent electrolyte oxidation and further TM dissolution, leads to a lower capacity fade rate. Interestingly, the fade rate of the TEPi cells remains higher than that of the baseline and TMSPi cells, which indicates that the TMs dissolved during the early part of the cycling have a significant effect. These TM elements are more effective at electrolyte reduction because of their presence in the inner SEI layer.32
Overall, the beneficial effects of the TMSPi additive results from several factors that include (i) the likely reduction of corrosive acids (like HF) via reaction with TMS groups, (ii) blocking of catalytic reactive TM-oxygen radical species to suppress solvent hydrogen abstraction and subsequent TM dissolution, and (iii) formation of a positive electrode surface film which can lower oxygen release from the oxide particles and mitigate electrolyte-electrode side reactions. In contrast, the TEPi does not appear to form a protective surface film on the positive electrode. Additional experimental and computational work is underway to refine our mechanistic understanding of these tricoordinate phosphite electrolyte additives. Our recent solution-based NMR experiments indicate a dynamic (reactive) relationship between TMSPi and the LiPF6 salt present in the baseline electrolyte, which has a major effect on cell performance and life; these findings and their implications will be detailed in subsequent articles.
Conclusions
Two compounds, tris(trimethylsilyl) phosphite (TMSPi) and triethylphosphite (TEPi), have been examined as electrolyte additives for NMC532/Gr lithium-ion cells cycled in the 3.0–4.4 V range. The results from our various tests indicate the following:
- (1)XPS data indicate that both TMSPi and TEPi cells develop P- and O-rich surface films at the positive electrode during cycling. These films form after formation cycling for TMSPi cells but occur more slowly for TEPi cells. We postulate that the scission of one or more TMS groups from TMSPi helps the central phosphite moiety to bind to oxygen atoms at the oxide surface and form a protective surface film. For TEPi the presence of ethyl groups, and the difficulty of scission, introduces steric effects that initially hinder the formation of P-O bonds at the oxide particles.
- (2)The surface films formed at the TMSPi positive electrode slows down impedance rise and also decreases the dissolution of metal ions from the oxide, which lowers the cell capacity fade. In contrast, the lack of a beneficial positive electrode surface film explains the higher capacity fade rates and higher impedance rise of the TEPi cell.
- (3)The lower capacity fade for the TMSPi cells correlates with a lower Mn and TM content in the negative electrode. In contrast, the higher capacity fade of the TEPi cells correlates with a higher Mn and TM content in the negative electrode. We suggest that HF elimination, coupled with the formation of a beneficial positive electrode surface film, by TMSPi is responsible for the lower capacity fade. In contrast, abstraction of hydrogen and HF generation could explain the increased TM dissolution and higher capacity fade of the TEPi cells. Additional experimental and computation work is underway to examine the validity of our proposed mechanisms; those results will be highlighted in future articles.
Acknowledgments
Support from the U.S. Department of Energy's Vehicle Technologies Program (DOE-VTP), specifically from Peter Faguy and Dave Howell, is gratefully acknowledged. The electrodes and cells used in this article were fabricated at Argonne's Cell Analysis, Modeling and Prototyping (CAMP) Facility. The facilities are supported within the core funding of the Applied Battery Research (ABR) for Transportation Program. We are grateful to team members of the HEHV program at the various national partner labs for their contributions. We are especially grateful to our Argonne colleagues, especially I. Shkrob, S. Trask, B. Polzin, A. Jansen, J. Croy, Z. Zhang, I. Bloom, F. Dogan, B. Key, and D. Dees for their suggestions and guidance. We also thank D. Graczyk, S. Lopykinski, and Y. Tsai for ICP-MS analysis of our samples, which was conducted at Argonne's Analytical Chemistry Laboratory. The submitted manuscript has been created by UChicago Argonne, LLC, Operator of Argonne National Laboratory ("Argonne"). Argonne, a U.S. Department of Energy Office of Science laboratory, is operated under Contract No. DE-AC02-06CH11357. The U.S. Government retains for itself, and others acting on its behalf, a paid up nonexclusive, irrevocable worldwide license in said article to reproduce, prepare derivative works, distribute copies to the public, and perform publicly and display publicly, by or on behalf of the Government.