Abstract
Li[Ni0.4Mn0.4Co0.2]O2 (NMC442)/graphite pouch cells containing various electrolyte additives, either singly or in combination, were studied using cycling experiments up to 4.4 and 4.5 V coupled with simultaneous electrochemical impedance spectroscopy (EIS) measurements. The impedance of most cells increased dramatically at 4.4 and 4.5 V, but was nearly reversible over one cycle. However, during continued cycling, the impedance of all cells slowly increased at all potentials. Electrolyte additives were found to dramatically affect this behavior. The impacts of adding prop-1-ene-1,3-sultone (PES), vinylene carbonate (VC), triallyl phosphate (TAP), methylene methane disulfonate (MMDS), ethylene sulfate (DTD) and/or tris(-trimethyl-silyl)-phosphite (TTSPi) to 1M LiPF6 ethylene carbonate:ethyl methyl carbonate (EC:EMC) electrolyte were studied. PES-containing cells had dramatically lower impedance and better capacity retention than VC and TAP-containing cells during both 4.4 and 4.5 V experiments. When MMDS, DTD and/or TTSPi were added in combination with PES, the performance was improved further. Finally, continuous charge-discharge cycling was compared to cycling with a 24-hour hold applied at the top of charge at 4.4 V. The high voltage hold led to severe impedance growth which could be partially overcome through the use of optimal additive combinations.
Export citation and abstract BibTeX RIS

This is an open access article distributed under the terms of the Creative Commons Attribution 4.0 License (CC BY, http://creativecommons.org/licenses/by/4.0/), which permits unrestricted reuse of the work in any medium, provided the original work is properly cited.
Lithium-ion (Li-ion) batteries are currently used in phones, laptop computers and, more recently, electric vehicles. It is well known that electrolyte additives can have a dramatic effect on the performance and lifetime of Li-ion batteries.1,2 Vinylene carbonate (VC) is perhaps the most famous and widely used additive and has been shown to improve cycle and calendar life of Li-ion cells.3 VC is less effective, however, when used in cells cycling to potentials above 4.2 V4 or at elevated temperatures.5 Sulfur-containing additives have recently been investigated by several research groups in the hopes of overcoming the temperature sensitivity of VC and extending the usable voltage range of Li-ion cells.6–8
Prop-1-ene-1,3-sultone (PES) has been shown to function as a stable solid electrolyte interphase (SEI)-forming additive that improved coulombic efficiency (CE), reduced charge end point capacity slippage and self-discharge rates.8,9 PES nearly eliminated all gas production during storage at 4.2 V and 60°C, whereas VC did not.9,10 The work by Xia et al.9 and Nelson et al.10 demonstrated the superiority of PES over VC as an electrolyte additive in NMC/graphite cells. Methylene methane disulfonate (MMDS) has been shown to reduce electrolyte oxidation at the positive electrode and reduce the volume of gas produced, as well as decrease the impedance and rate of parasitic reactions when compared to cells without MMDS.6,11 The additive ethylene sulfate or 1,3,2- dioxathiolane-2,2-dioxide (DTD) has been shown to function as a film-forming additive for the SEI on the negative electrode.12,13 The additive tris-(trimethyl-silyl) phosphite (TTSPi) has been shown to reduce impedance, charge end point capacity slippage and improve the CE of Li-ion cells, particularly when combined with either VC or PES in addition to a sulfur-containing additive, such as MMDS or DTD.14
Ma et al. studied the effect of additive combinations in Li-ion pouch cells.15 Ma et al. studied cells containing a combination of VC, a sulfur-containing additive, and tris(-trimethyl-silyl)-phosphate (TTSP) and/or tris(-trimethyl-silyl)-phosphite (TTSPi).15 Ma et al. found that the ternary and quaternary additive mixtures improved the cycling performance and safety of the Li[Ni1/3Mn1/3Co1/3]O2/graphite cells while reducing the impedance and parasitic reactions at the positive electrode when compared to VC alone in the electrolyte.15
Figure 1 shows capacity versus cycle number and electrochemical impedance spectroscopy data for Li[Ni1/3Mn1/3Co1/3]O2(NMC111)/graphite and Li[Ni0.4Mn0.4Co0.2]O2(NMC442)/graphite pouch cells to demonstrate the excellent capacity retention of cells containing the additive combination 2% PES + 1% MMDS + 1% TTSPi, measured by Jian Xia and Lin Ma from Dalhousie University.16,17 This additive combination will be referred to as PES211. Figures 1a and 1b show the discharge capacity as a function of cycle number for NMC111 cells cycled to 4.2 V at 55°C and NMC442 cells cycled to 4.4 V at 45°C, respectively. These cells had excellent capacity retention after long term cycling and cycling to high voltage. Figures 1c and 1d show the impedance spectra before and after cycling measured at 3.8 V and 10°C for NMC111 cells cycled to 4.2 V at 55°C and NMC442 cells cycled to 4.4 V at 45°C, respectively. The impedance of these cells was reduced during cycling compared to when measured just after formation.
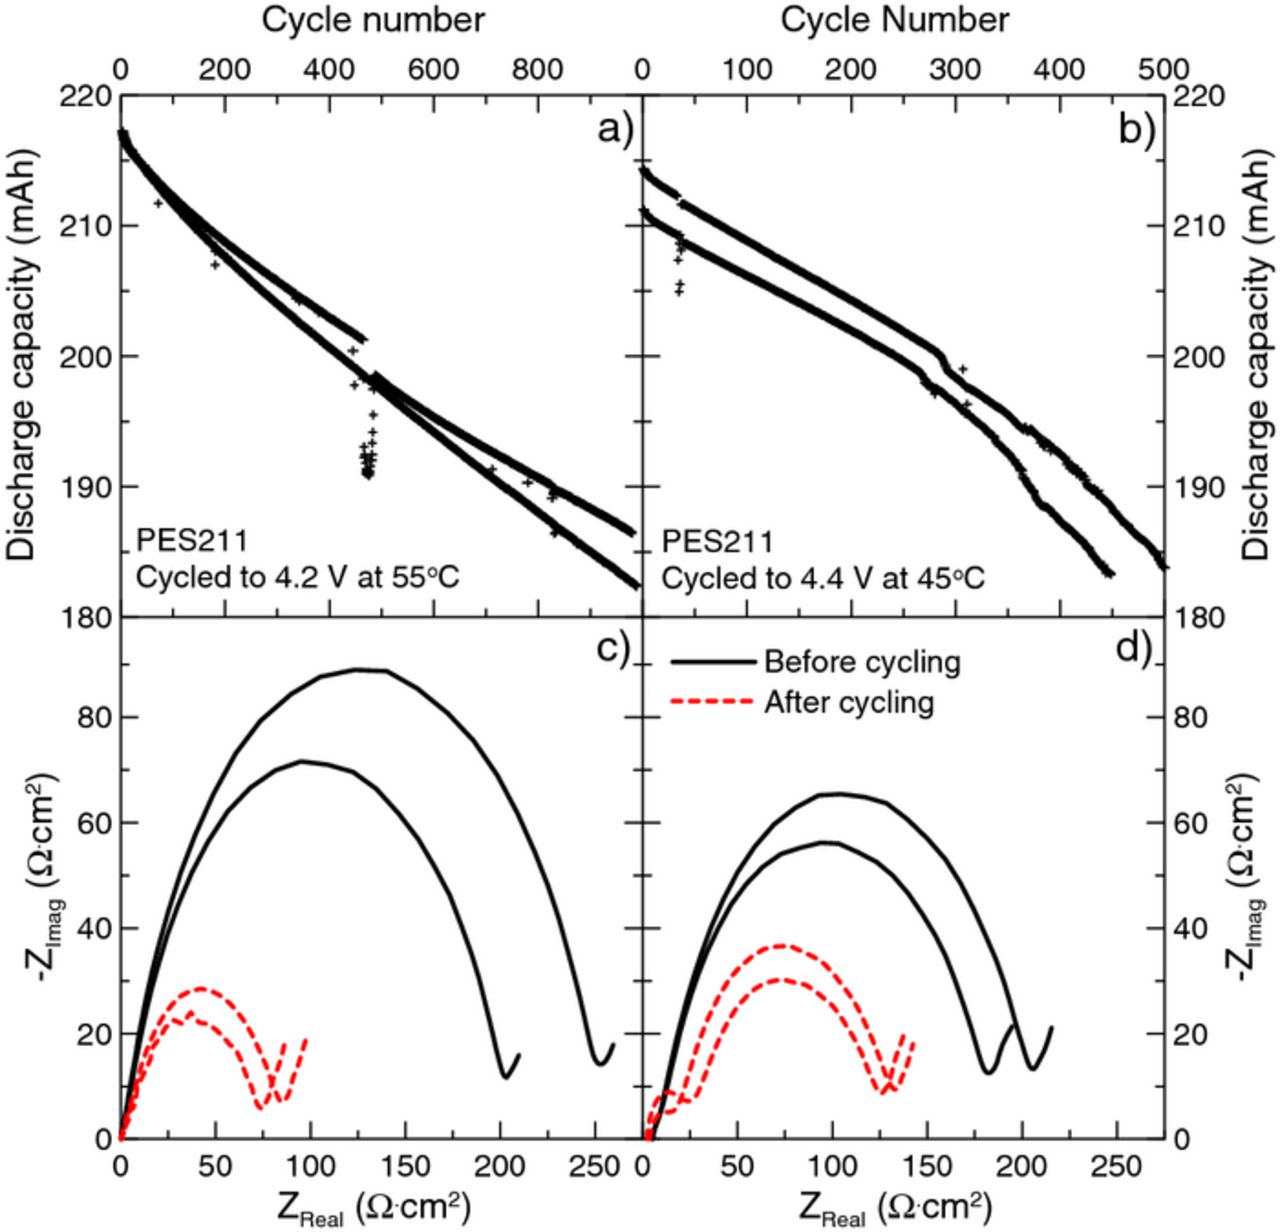
Figure 1. The discharge capacity of (a) NMC111/graphite pouch cells cycled to 4.2 V at 55°C and (b) NMC442/graphite pouch cells cycled to 4.4 V at 45°C, both filled with PES211. The impedance spectra measured before and after cycling at 3.8 V and 10°C of (c) NMC111/graphite pouch cells cycled to 4.2 V at 55°C (from panel a) and (d) NMC442/graphite pouch cells cycled to 4.4 V at 45°C (from panel b), both filled with PES211.
Despite the apparently stable impedance shown in Figure 1, it is important to measure the impedance at voltages above 3.8 V, and track the changes in impedance over several cycles. Poor performance of certain additives and additive combinations at high voltage may be due to impedance growth. Therefore, it is important to measure the impedance as a function of voltage, time and cycle number. This paper presents studies of the impact of electrolyte additives in NMC442/graphite pouch cells using electrochemical impedance spectroscopy (EIS) measurements coupled with cycling experiments to high voltage. Furthermore, the importance of performing experiments representative of "real-life" Li-ion cell use is demonstrated. Practical applications that use Li-ion batteries often leave the cells at high voltages for extended periods of time after charging. Therefore, studying the effect of extended periods of time at high voltage on the performance and impedance growth of Li-ion cells is imperative.
LiCoO2/graphite cells with upper cutoff potentials of 4.4 V are now common in the marketplace, but NMC/graphite cells that can be charged to 4.4 V are not, since NMC/graphite cells normally do not function well when charged to high potential. For this reason, NMC442/graphite pouch cells, which contain a small amount of Co and a significant amount of Mn, were chosen to be studied. Increasing the voltage range of NMC442, and other NMC grades is important to increase the energy density of cells for EV and other applications.
Experimental
Machine made 220 and 240 mAh NMC442/graphite wound pouch cells balanced for 4.7 V operation were obtained dry (no electrolyte added) from LiFUN Technologies (Zhuzhou City, China). Pouch cells were manufactured and vacuum sealed in a dry room in China before shipping to Dalhousie University. After heating to 80°C for 14 hours under vacuum to remove any residual water and then moved into an argon-filled glove box, the pouch cells were filled with 0.90 g of 1M LiPF6 in ethylene carbonate (EC): ethylmethyl carbonate (EMC) (BASF) in a ratio of 3:7 (by weight) as the control electrolyte. The additives VC (BASF, 99.97%), PES (Lianchuang Medicinal Chemistry Co., 98.20%), 1,3,2- dioxathiolane-2,2-dioxide (DTD, Aldrich, 98%), MMDS (Guangzhou Tinci Co. Ltd, 98.70%), triallyl phosphate (TAP, TCI America, >94.0%),18 and TTSPi (TCI America, >95%) were added alone or in ternary combinations to the control electrolyte in concentrations of 1 or 2% by weight. Figure 2 shows the chemical structures of the additives studied in this work. Cells were vacuum sealed using a compact vacuum sealer (MTI Corp.) after electrolyte filling.
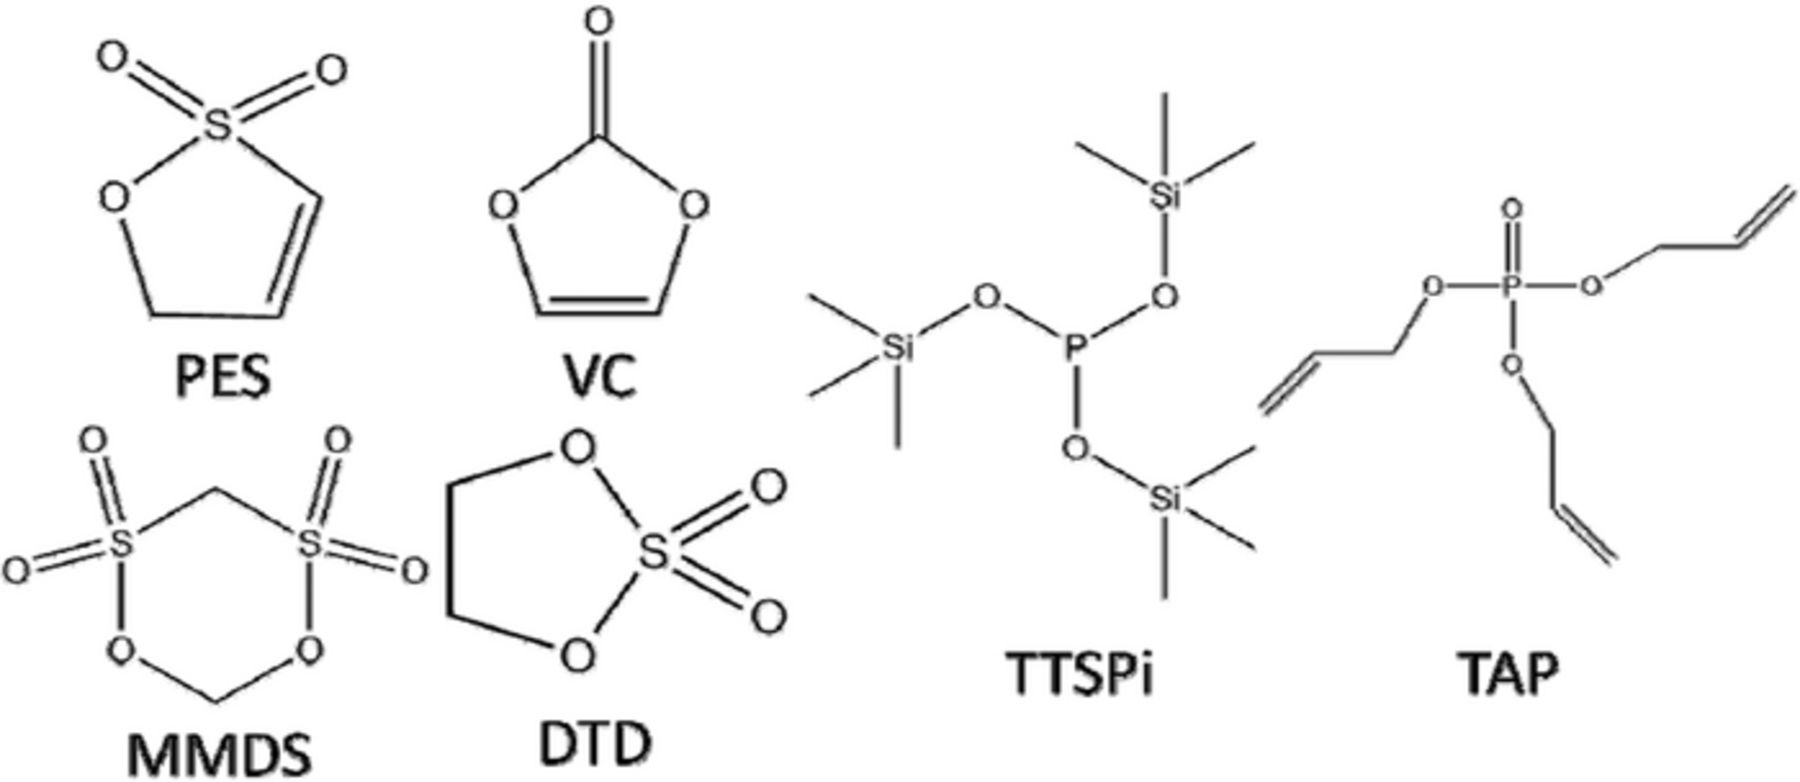
Figure 2. The chemical structures of the additives studied in this work.
All cells did a formation cycle at 40. ± 0.1°C, consisting of a 24 hour hold at 1.5 V to ensure adequate electrolyte wetting followed by a C/20 charge to 3.5 V. After this step, cells were transferred into an argon-filled glove box, cut open just below the heat seal to release generated gas and then vacuum sealed again. After degassing, the cells were charged to 4.5 V at C/20 followed by a C/20 discharge to 3.8 V. The temperature boxes used for the measurements presented in this work are stable to ± 0.1°C, and are within one degree centigrade of the set temperature.
After formation, these cells were placed in a 40. ± 0.1°C temperature box connected to one of two systems capable of electrochemical impedance spectroscopy measurements coupled with cycling capabilities. The first system consists of a Maccor series 4000 connected to a Maccor FRA model 0356. The second system, built in-house by Greg d'Eon from Dalhousie University, consists of Neware (Shenzhen, China) cyclers connected to computers with Gamry frequency response analyzer (FRA) cards via appropriate computer controlled relays. The relay switching was controlled to connect the cells to the Neware charger or to the Gamry FRA cards as required. Cells underwent charge-discharge cycling by one of two methods, as shown in Figure 3. The time axis is simply provided as a scale, not as the specific time cycles occurred in the experimental method. Cells undergoing method 1 were cycled between 2.8 and 4.4 V at C/5 and 40. ± 0.1°C. Every 12 cycles, the cells underwent an "FRA cycle" consisting of a charge and discharge at C/20 between 2.8 and 4.4 V while the FRA measured the cell impedance every 0.1 V between 3.6 and 4.4 V. After the FRA cycle, the cells were cycled again between 2.8 and 4.4 V at C/5 for 11 cycles, and the protocol was repeated. After approximately 65 cycles, the upper cutoff voltage during cycling and impedance measurements was increased to 4.5 V, and the same 11 cycle-FRA-cycle protocol continued, as shown in Figure 3.
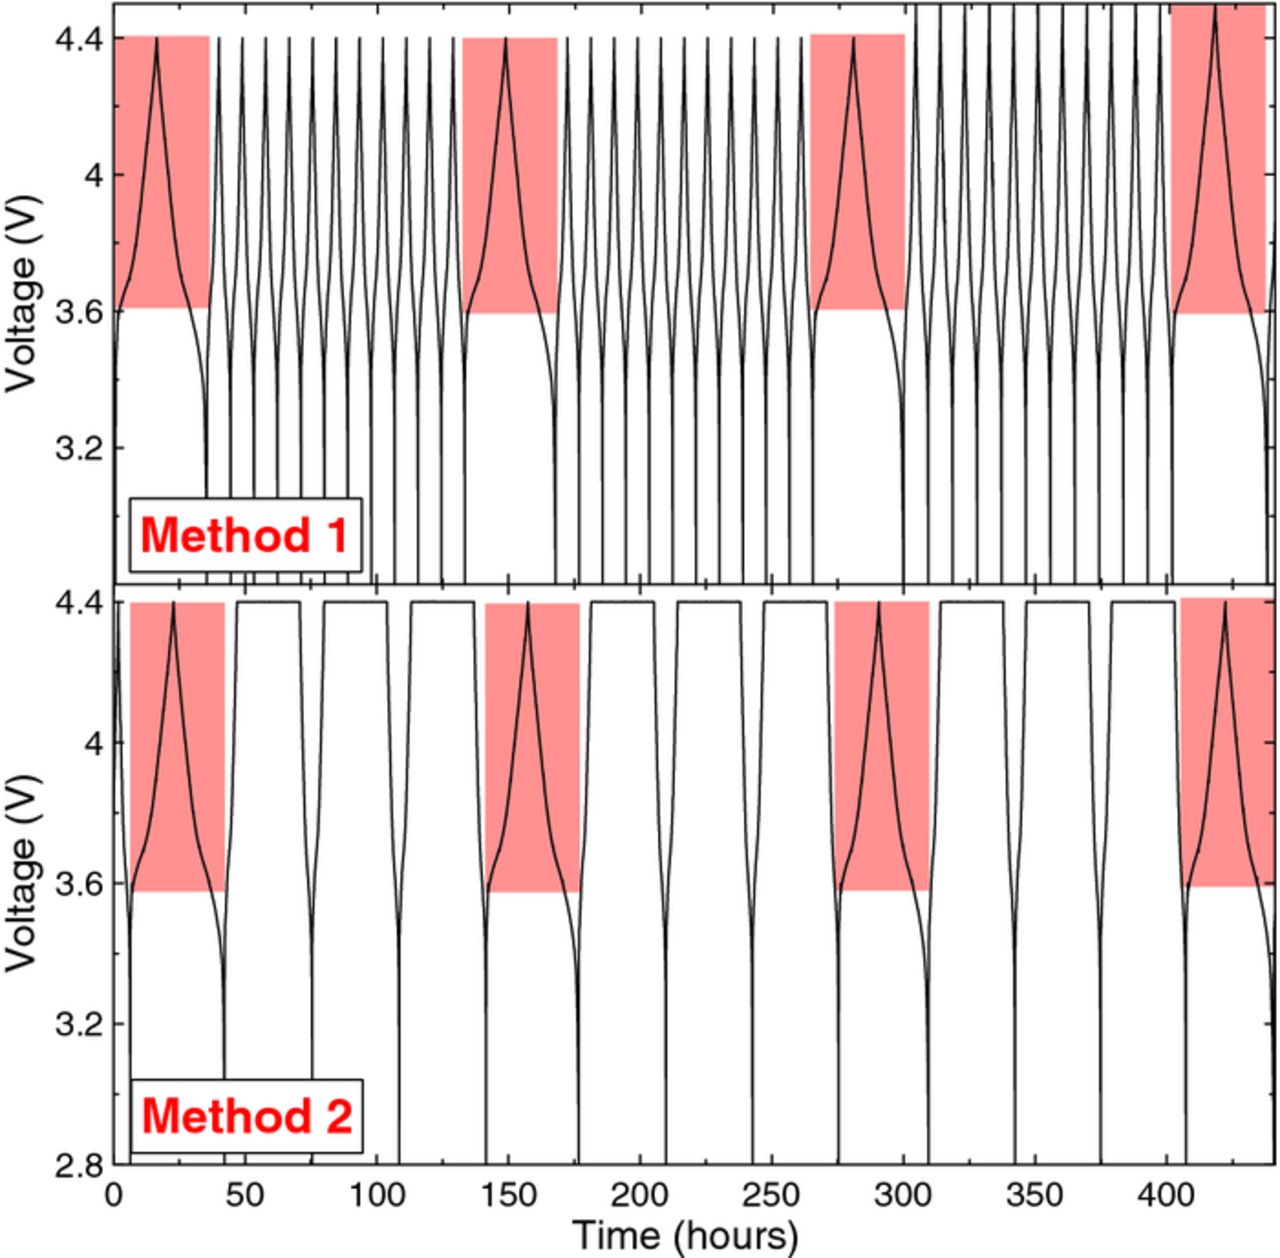
Figure 3. The two methods used in the experiments reported here. The red shaded region represents the voltage range in which the FRA was used to take impedance measurements every 0.1 V.
Cells undergoing method 2 were cycled between 2.8 and 4.4 V at C/5 and 40. ± 0.1°C including a 20 or 24 hr hold at 4.4 V. Every 4 cycles, the cells underwent an "FRA cycle" as described in method 1. After the FRA cycle, the cells were cycled again between 2.8 and 4.4 V at C/5 for 3 cycles with a 20 or 24 h hold at 4.4 V, and the protocol was repeated. Cells were typically removed from testing once they exhibited a dramatic decrease in discharge capacity that did not stabilize.
Gas evolution measurements employing Archimedes principle were done on all cells before and after formation, and after cycling. This was done by weighing the cells in nanopure water with ρ = 0.998 g/ml (20°C), such that the change in mass, Δm, is a direct measure of the volume, Δv, of gas produced during formation, storage, or cycling as described by Δv = Δm/ρ.19 This procedure is discussed in depth by Aiken et al.19
Results and Discussion
Figure 4 shows the discharge capacity versus cycle number for the NMC442/graphite pouch cells with 220 mAh capacity undergoing cycling method 1. Every 12 cycles there is a gap in the discharge capacity due to the FRA cycle. The dotted line indicates when the upper cutoff voltage was increased to 4.5 V. The cell containing 2% VC exhibited dramatic discharge capacity fade after only 20 cycles, indicating the presence of parasitic reactions and most likely the formation of unstable, resistive SEI layers on the electrodes due to electrolyte decomposition catalyzed by cycling to potentials above 4.2 V. The discharge capacity of all cells increased when the voltage range was increased. Although the 2% PES–containing cell initially had the highest discharge capacity, this cell also exhibited severe capacity fade after 115 cycles. The 2% TAP–containing cell exhibited a more gradual decrease in discharge capacity, until approximately 150 cycles. The slight increase in capacity of this cell at 210 cycles, indicated by the closed star in Figure 4, resulted from clamping the cell in an effort to increase the stack pressure and improve cell performance. The clamp was not effective, since the capacity increased minimally and then decreased rapidly again. The PES211–containing cell had the most stable discharge capacity and 87% capacity retention (at 285 cycles) during cycling to 4.5 V. This cell was then changed to run cycling method 2 (cycling to 4.4 V with a 24 hr hold at the top of charge) which is indicated by the slight increase in capacity after 285 cycles, highlighted by the open star in Figure 4. This cell did not exhibit severe discharge capacity fade up to 300 cycles when the cell was removed from testing.
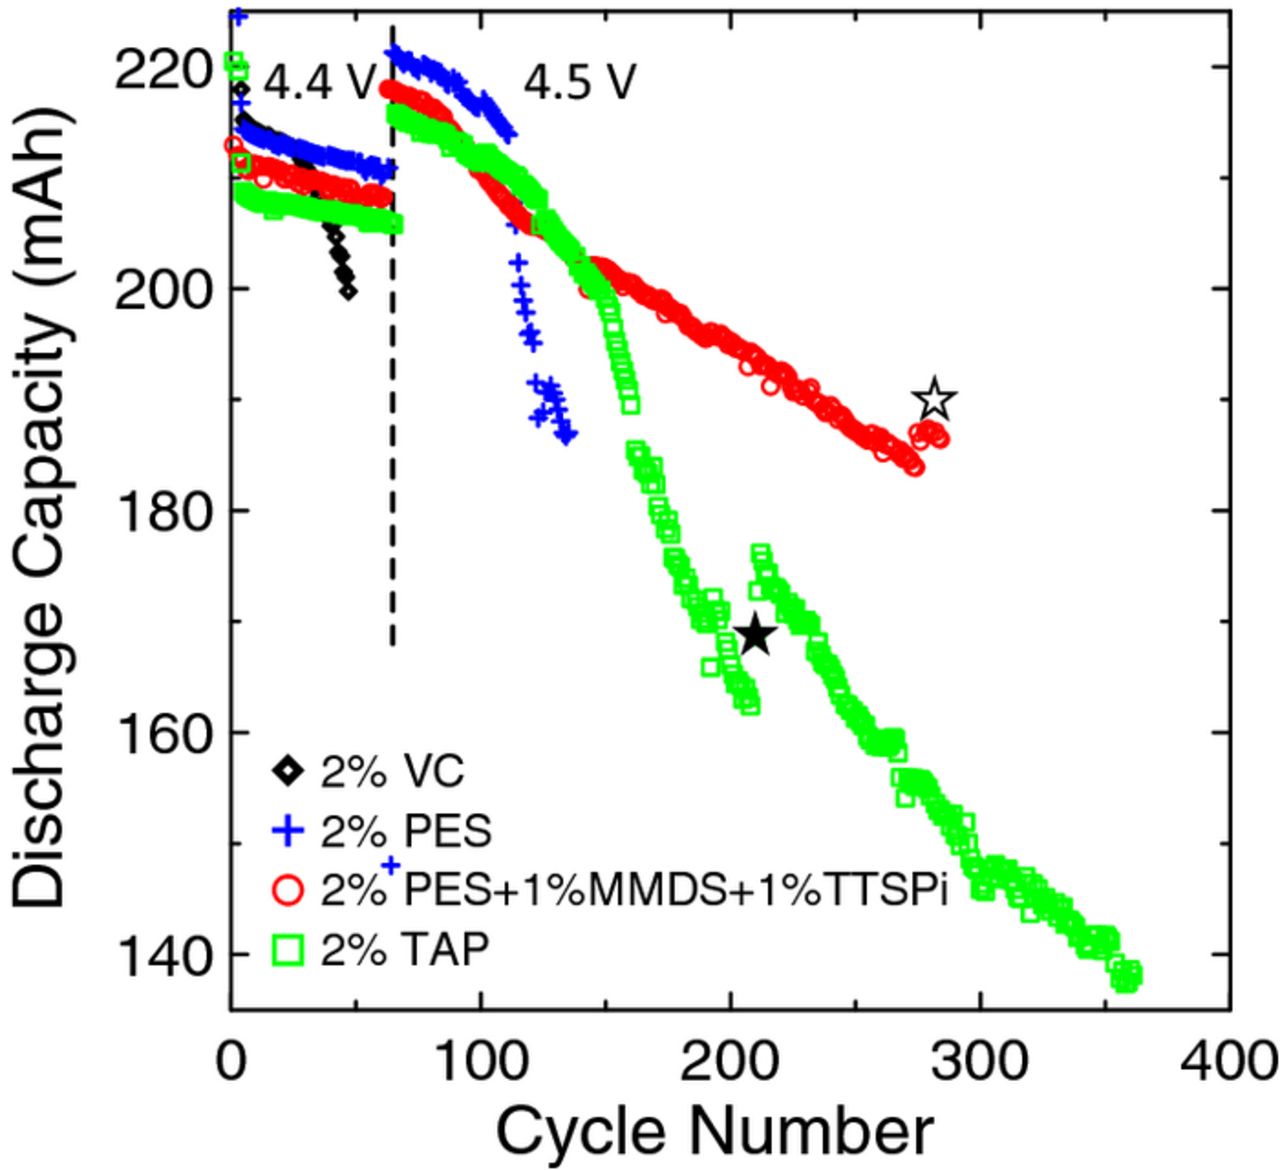
Figure 4. The discharge capacity as a function of cycle number for cells undergoing cycling tests and FRA measurements according to method 1 at 40°C. The dotted line indicates when the upper cutoff voltage was increased from 4.4 V to 4.5 V for all cells. The closed star indicates when the corresponding cell was clamped. The open star indicates when the corresponding cell was changed from method 1 to method 2.
Figure 5 is a Nyquist representation of the impedance spectra of the cell containing 2% PES at each FRA sequence, every 12 cycles, measured at 4.4 V. The cell impedance increases with increasing cycle number, as indicated in Figure 5. The shift of the first minimum of the spectra to larger values in the x-axis indicates an increase in the electrolyte resistance with increasing cycle number. The high frequency tail that occurs at low values of the real axis is most likely due to impedance contributions from the experimental setup, in particular from the lengthy wires that connect the cell to the Maccor FRA0356. The "diameter" of the "semi-circular" shape, labelled as Rct in Figure 5, is a combination of the charge transfer resistances from both the positive and negative electrodes as well as resistance due to the motion of ions through the SEI layers at both the positive and negative electrodes.
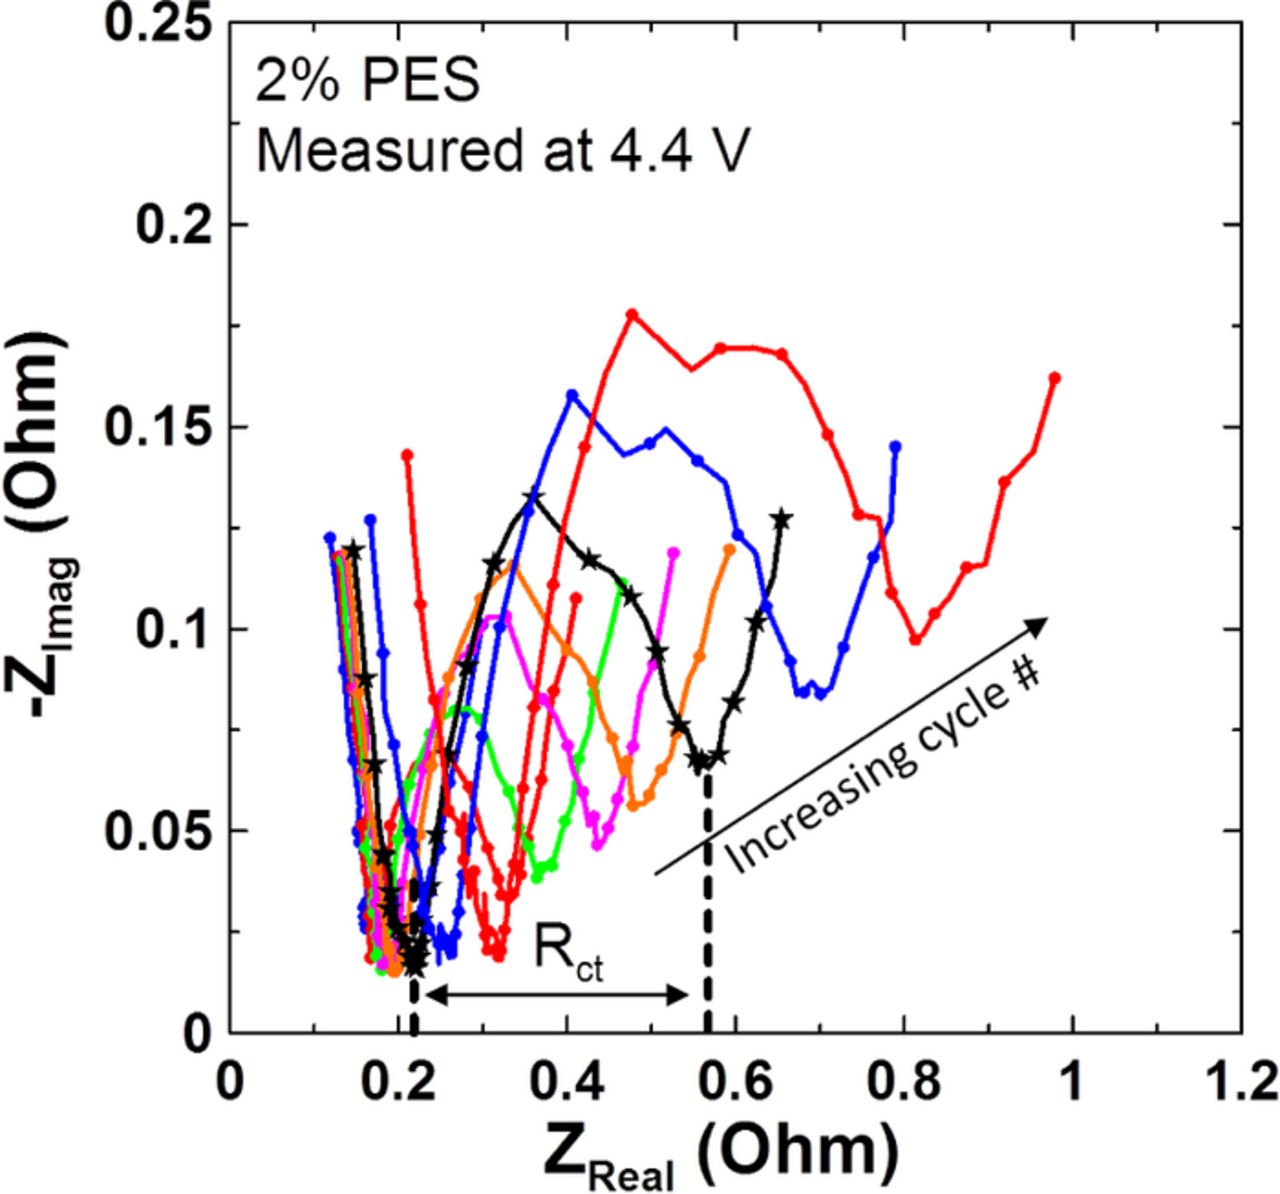
Figure 5. Impedance spectra of the 2% PES–containing cell for every FRA cycle, measured at 4.4 V and 40°C.
Figure 6 shows the resistance, Rct, as a function of voltage for the cells (described by Figure 4) undergoing method 1. Each panel shows the resistance measured during each charge and discharge of the FRA cycle, every 12 cycles, for the cell containing the electrolyte additives as labelled. Partial or missing data for an FRA cycle indicates that the cell was removed from testing at that time. The arrow in panel a) indicates the trend of the data with increasing cycle number, and applies to all panels. Figure 6 has many interesting features. All cells, except the PES211–containing cell, exhibited an increase in resistance as the voltage increased from 3.8 V to 4.4 V and an increased resistance at all voltages as the cycle number increased. When the upper cutoff voltage was increased to 4.5 V, typically at cycle 65, the impedance of all cells increased dramatically, except for the PES211 cell. Most interesting is the reversible nature of the impedance over one cycle. Despite the increase in impedance at 4.4 and 4.5 V, the impedance measured during the subsequent discharge decreased such that the value was nearly identical to the value measured upon charge suggesting dynamic changes to the surface layers on the positive electrode during charge to high voltages which are not understood at this time. All cells exhibited this reversible nature over one cycle. The impedance change for all cells, except PES211, is irreversible, however, over several cycles.
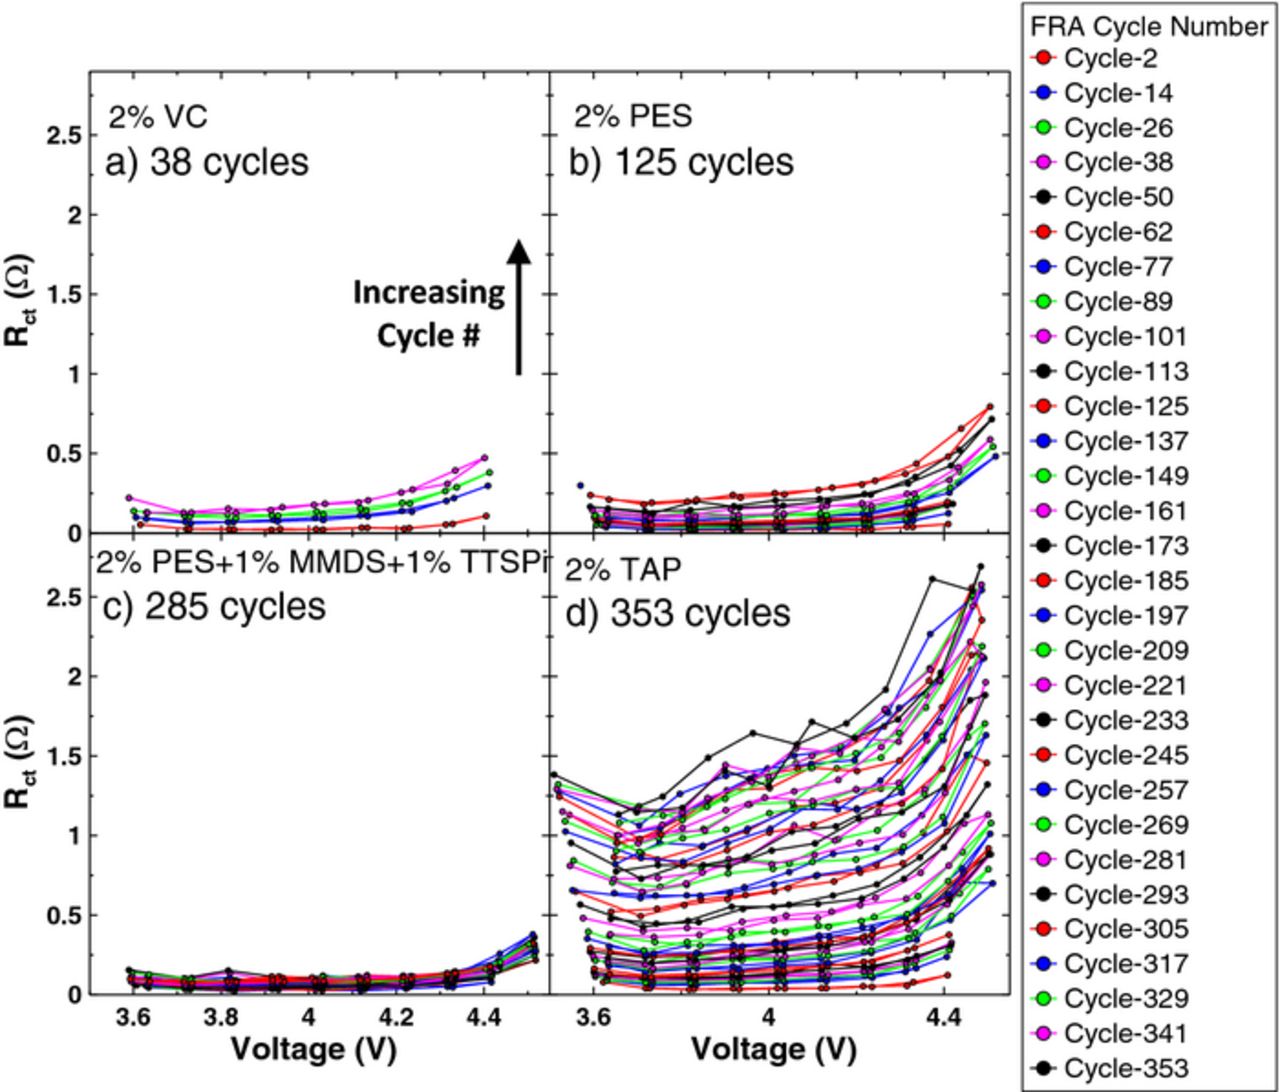
Figure 6. The combination of charge transfer resistance (both positive and negative electrodes) and resistance due to motion of ions through the SEI layers (both positive and negative electrodes), Rct, as a function of voltage measured every 11 cycles. The number of cycles shown is indicated in each panel as are the electrolyte additives in each cell. The arrow in panel a) indicates the trend of the data with increasing cycle number, and applies to all panels.
Figure 6d shows that Rct of the 2% TAP cell that was supposed to be measured at 3.6 V visibly shifts to lower voltages during charge and higher voltages during discharge as cycle number increases. This is caused by the increasingly significant relaxation of the cell voltage when the current stops prior to the EIS measurement due to increased cell impedance.
The reversibility in Rct, particularly from 4.5 V to 4.4 V is thought-provoking. Possible explanations for this are 1) resistive surface species are temporarily formed at higher potentials, and return to solution again at lower potentials; or 2) physical and reversible restructuring of the electrodes and/or SEI layers caused by high potential increased the impedance reversibly. The irreversibility in resistance over several cycles, that is, the increase in impedance with increasing cycle number, correlates with discharge capacity fade and is most likely due to SEI growth on both electrodes and electrolyte degradation. Recent work by Petibon et al.20 using symmetric cells21,22 has shown that the reversible impedance increase which occurs at high potential is predominantly due to increases in Rct of the positive electrode. However, the steady increase of impedance over many cycles, as shown in Figure 6, may also involve the negative electrode, due to transfer of oxidation products from the positive to the negative electrode.1,23 Further work using symmetric cells made from electrodes of heavily cycled cells is required.
Figure 7a shows the resistance, Rct, as a function of cycle number for the cells as measured at 4.4 V. This further emphasizes the irreversible impedance growth for all cells except PES211. A change in slope occurred around 65 cycles for the 2% PES–containing cell, when the upper cutoff voltage was increased to 4.5 V, indicating an increase in parasitic reactions and resistive species formed on the electrodes upon exposure to voltages above 4.4 V. The PES211–containing cell did not exhibit any change in slope, which is consistent with the gradual capacity fade shown in Figure 4. The slope for the 2% TAP–containing cell was constant until 150 cycles when there was an increase in slope, which has been emphasized by the dotted line. This is consistent with the severe discharge capacity fade exhibited by this cell at 150 cycles, as shown in Figure 4. This also indicates that although the impedance of the 2% TAP–containing cell continued to increase with cycle number, it was not immediately affected by the increase in upper cutoff voltage. In addition, the installation of the clamping plates on the TAP-containing cell at cycle 210 did not change the slope of the Rct versus cycle number plot suggesting that any gas evolution in the cell was not affecting Rct strongly.
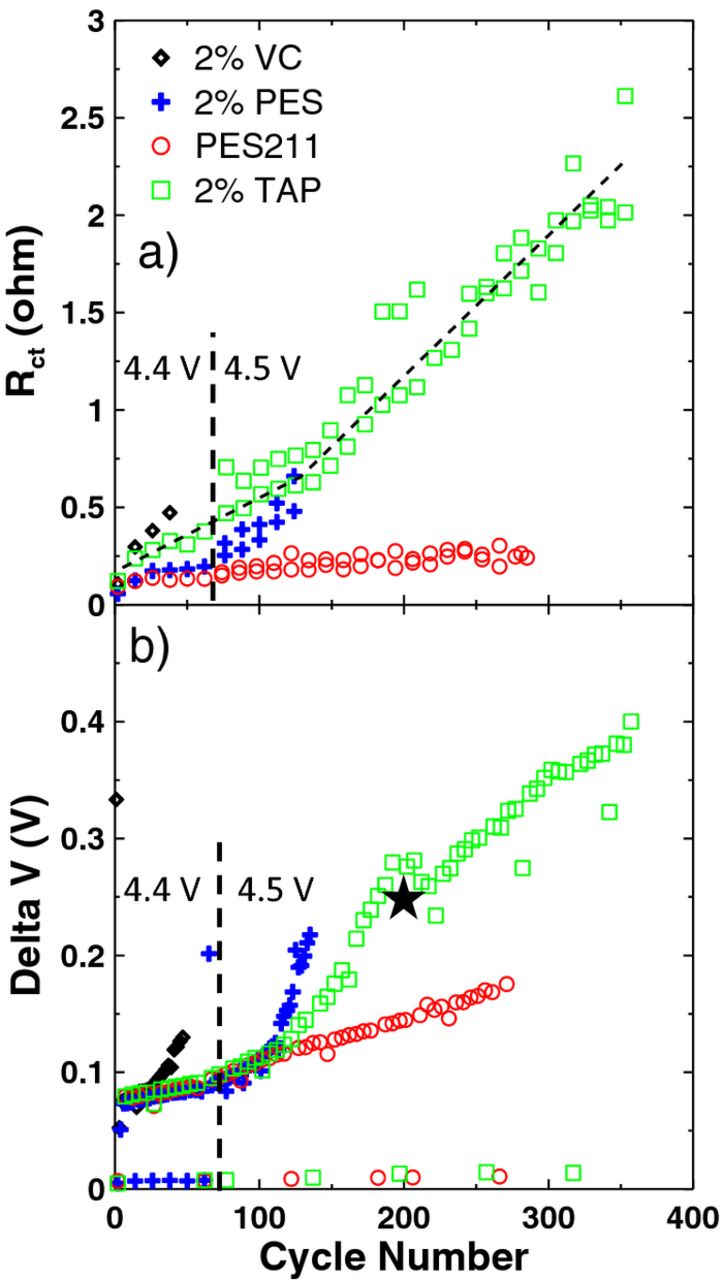
Figure 7. (a) The combination of charge transfer resistance (both positive and negative electrodes) and resistance due to motion of ions through the SEI layers (both positive and negative electrodes), Rct, measured at 4.4 V and (b) the difference between the average charge and discharge voltage, delta V, both as a function of cycle number for cells (indicated in the legend) undergoing method 1 testing. The closed star indicates when the corresponding cell was clamped.
Figure 7b shows the difference between the average charge and discharge voltage (delta V) as a function of cycle number. A smaller value of delta V means there is smaller polarization and thus smaller cell impedance.24 This plot correlates well to the discharge capacity shown in Figure 4. Although the installation of clamping plates, indicated by the closed star in Figure 7b, on the TAP-containing cell did not change the slope of the Rct versus cycle number as shown in Figure 7a, the slope of the delta V versus cycle number was changed. Furthermore, the effect of increasing the upper cutoff voltage, indicated by the dotted line in Figure 7, of the TAP-containing cell can be seen by the change in slope in Figure 7b which is not seen in Figure 7a. Increasing the upper cutoff voltage may increase electrolyte degradation which may cause impedance growth and polarization. The PES211-containing cell did not exhibit any change in slope, in agreement with the discharge capacity and Rct versus cycle number shown in Figure 4 and 7a, respectively.
Figure 8 shows the voltage-capacity curve for the TAP and PES211-containing cells for cycles 10, 160, and 260. This figure emphasizes the difference in delta V between these two cells as shown in Figure 7b. Figure 8a shows that the polarization of the TAP-containing cell increases significantly with cycle number. Figure 8b shows that the polarization of the PES211-containing cell is smaller and increases slightly with cycle number.
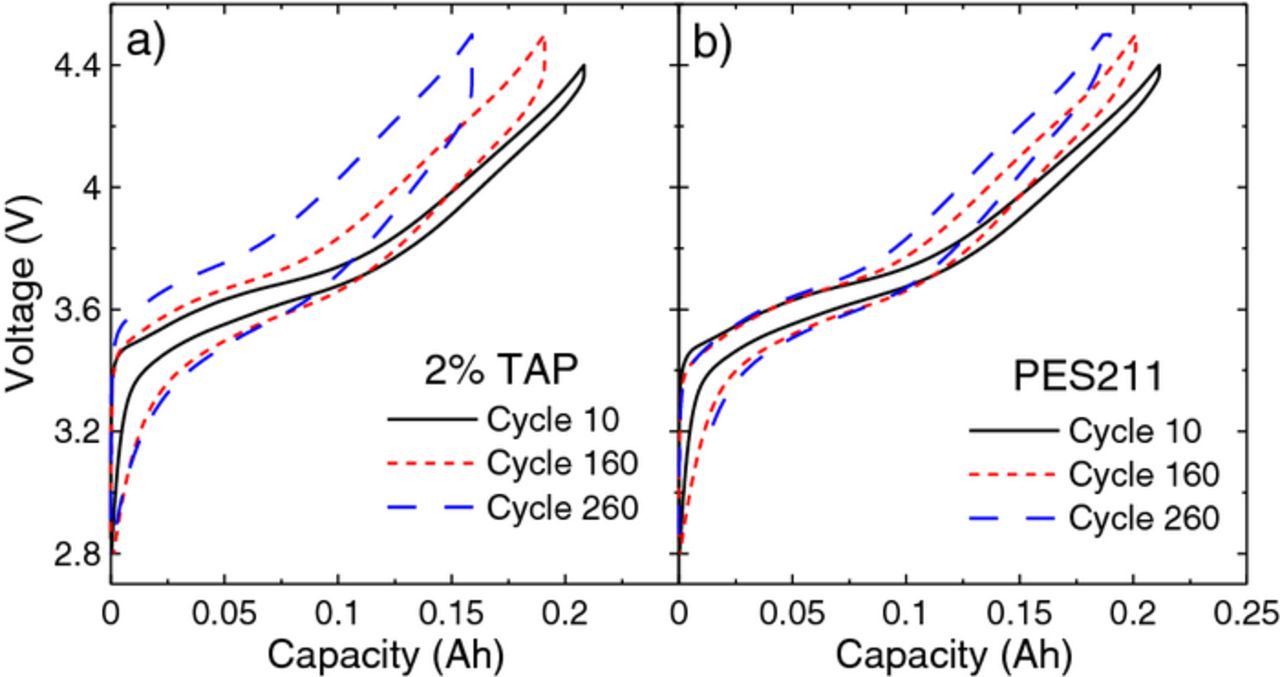
Figure 8. The voltage-capacity curve for cycles 10, 160 and 260 for the 220 mAh cells containing (a) TAP and (b) PES211.
Figure 9 shows a comparison of the discharge capacity (top panels) and Rct as a function of voltage (bottom panels) for NMC442/graphite cells containing PES211. Figure 9a shows the discharge capacity as a function of cycle number for cells containing PES211 undergoing testing using method 1 (continuous cycling) and method 2 (cycling with a 24 hr hold at 4.4 V). Despite the excellent capacity retention of the PES211–containing cell during continuous cycling, the hold at high voltage leads to severe discharge capacity fade. This effect is also seen in Figure 9b, which shows the discharge capacity as a function of time. The discharge capacity of the cell undergoing testing using method 2 exhibited a brief drop in discharge capacity and then recovered at ∼25 cycles in Figure 9a and 1000 hours in Figure 9b. This was caused by a temporary increase in voltage polarization during these cycles presumably due to jelly roll deformation caused by some gas generation. Figure 9c shows Rct as a function of voltage for the PES211–containing cell undergoing method 2 testing. The arrow in panel c) indicates the trend of the data with increasing cycle number for panels c) and d). This cell exhibited severe impedance growth over 50 cycles (∼1700 hours). Interestingly, the impedance was reversible over one cycle, similarly to Figure 6, while the impedance was irreversible over several cycles. Figure 9d shows the Rct as a function of voltage for the PES211–containing cell undergoing method 1. This cell had very low impedance at all voltages and all 285 cycles (∼3000 hours). Figure 9 dramatically demonstrates that holding cells at high potentials for extended periods (as might be expected in real-life charging situations in portable electronics, for example) leads to severe impedance growth issues, at least with PES211 electrolyte and presumably with the other electrolytes described in Figures 4 and 6, which should be worse than PES211.
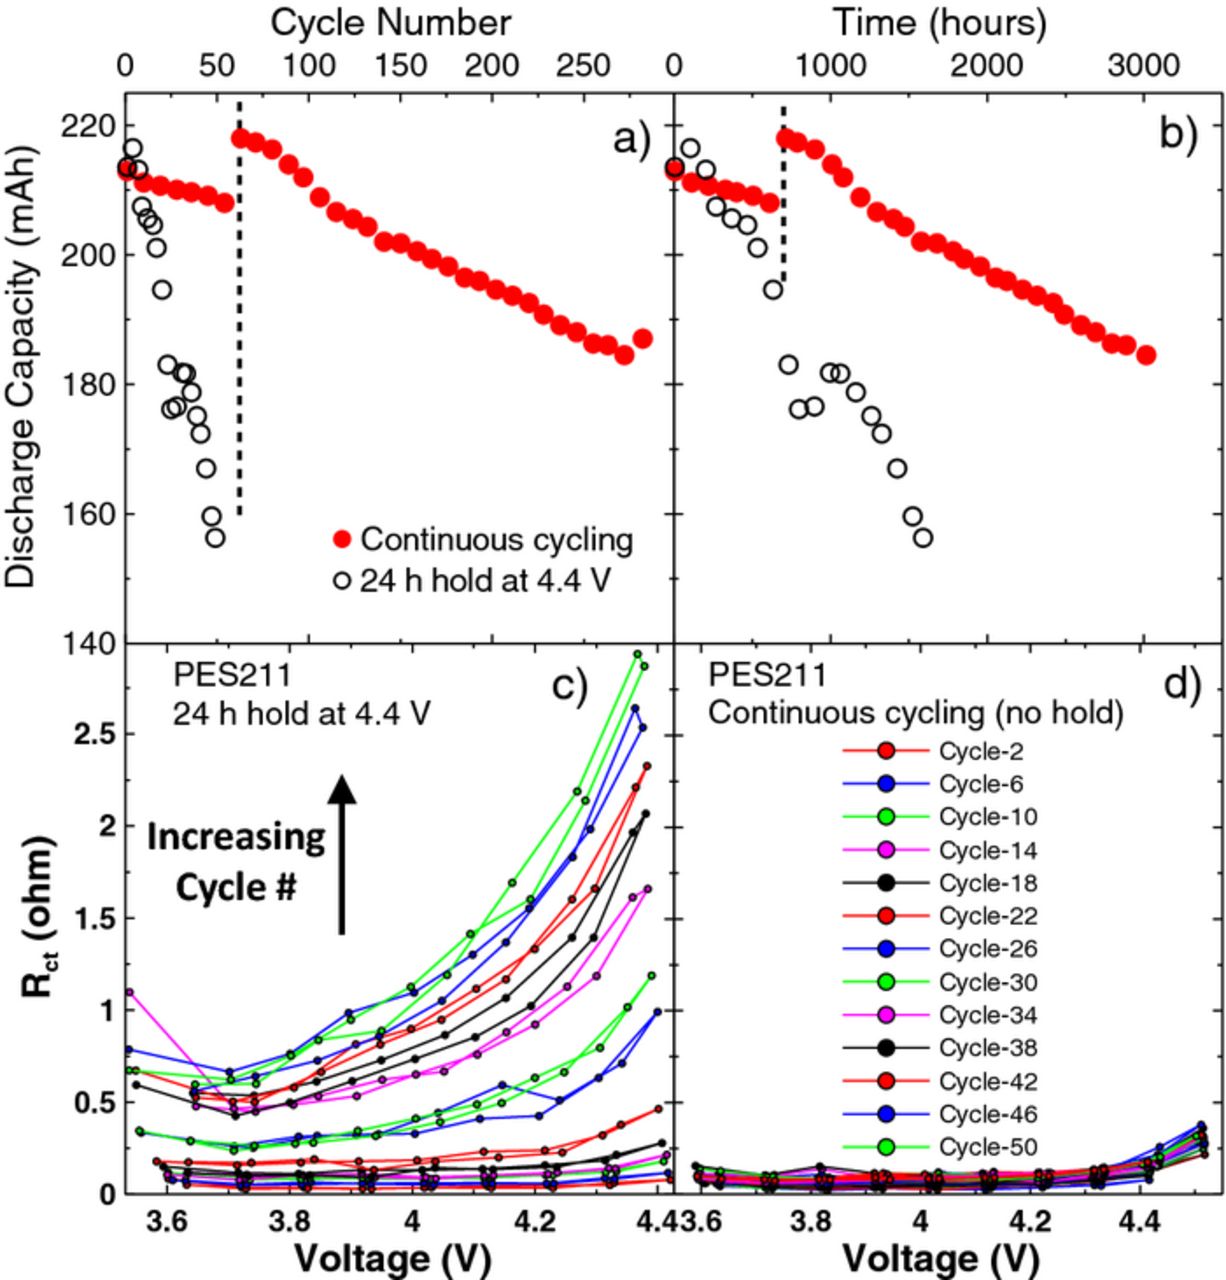
Figure 9. The discharge capacity for cells containing PES211 undergoing cycling tests and FRA measurements according to method 1 and method 2 as a function of (a) cycle number and (b) time. The combination of charge transfer resistance (both positive and negative electrodes) and resistance due to motion of ions through the SEI layers (both positive and negative electrodes), Rct, as a function of voltage measured during every FRA cycle for (c) the cell undergoing method 2 and (d) the cell undergoing method 1 testing. The arrow in panel c) indicates the trend of the data with increasing cycle number for panel c) and d).
The paper by Wang et al.25 shows that the coulombic efficiency of cells with 2% PES + 1% DTD + 1% TTSPi is larger (better) than those of cells with 2% PES + 1% MMDS + 1% TTSPi, so it was decided to try replacing MMDS with DTD in studies of cells cycled according to method 2.
Figure 10 shows the discharge capacity for NMC422/graphite pouch cells with 240 mAh capacity undergoing experimental method 2 as a function of time and cycle number. Every 3 cycles there is a cycle with visibly lower capacity due to the FRA cycle. The cells containing DTD have better capacity retention than the cell containing MMDS in agreement with expectations based on earlier work.25 The clamped cell containing 2% PES + 1% DTD + 1% TTSPi has significantly better capacity retention than the same cell without a clamp. It is our opinion that simply clamping a cell should not significantly change Rct as we have defined it, but may change the overall cell impedance by improving contact resistances.
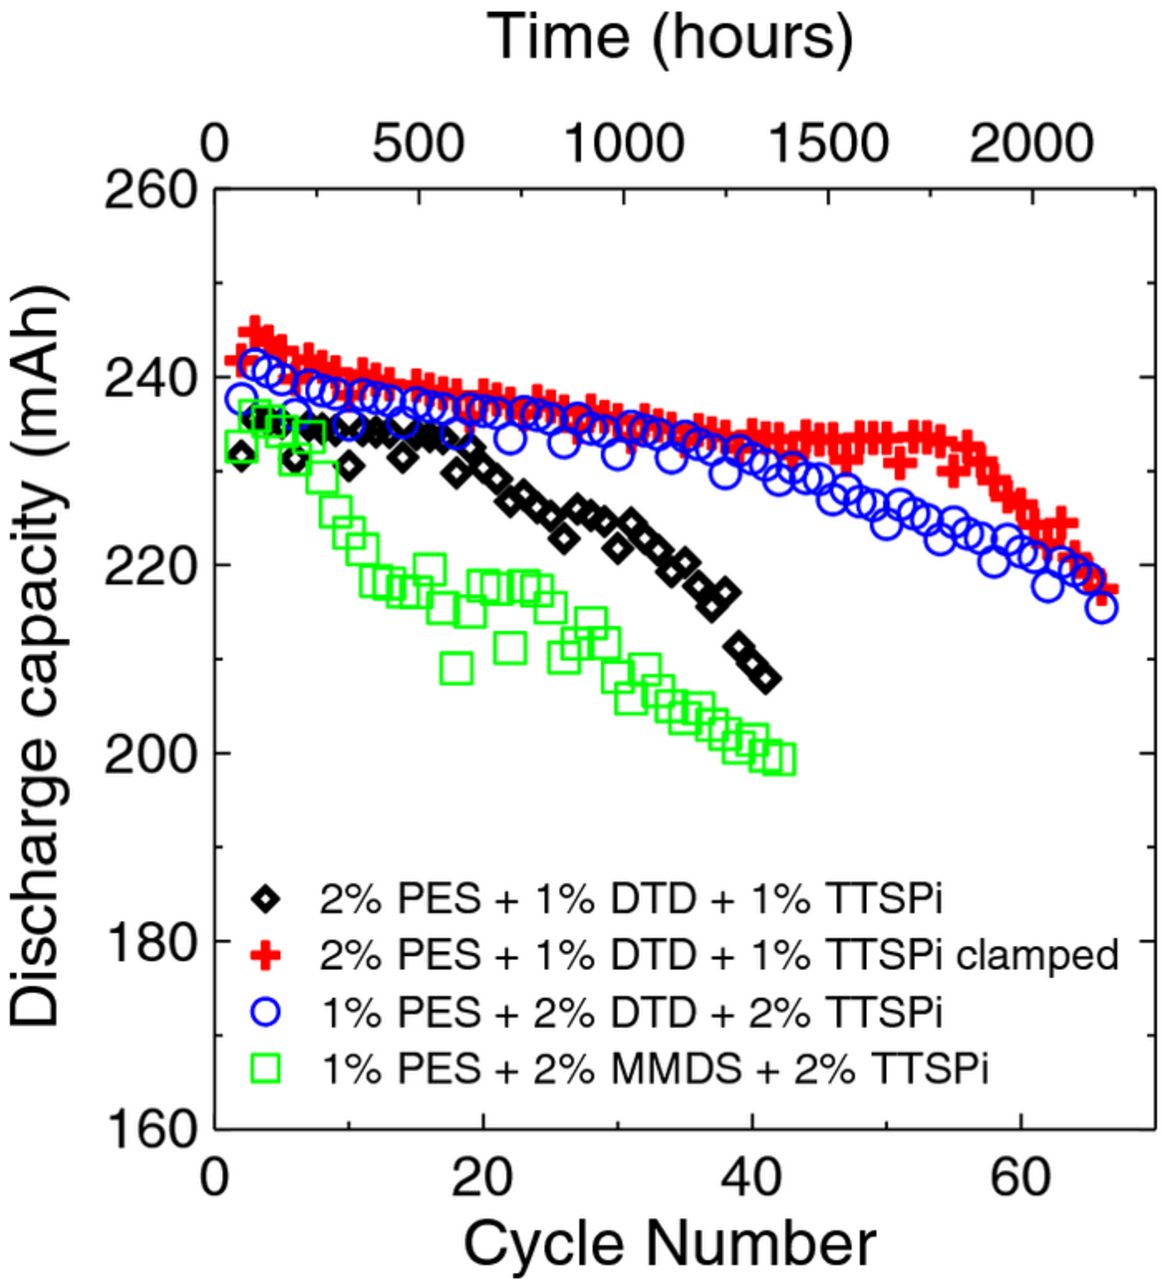
Figure 10. The discharge capacity as a function of cycle number for cells undergoing cycling tests and FRA measurements according to method 2 at 40°C. The legend indicates the electrolyte additive sets incorporated in the cells.
Figure 11 shows Rct as a function of voltage for the cells undergoing method 2. Each panel shows the resistance measured during each charge and discharge of the FRA cycle, every 3 cycles, for the cell containing the electrolyte additives as labelled. The arrow in panel a) indicates the trend of the data with increasing cycle number, and applies to all panels. Each panel has a different number of cycles shown. The DTD–containing cells have smaller impedance than the MMDS–containing cell, which is consistent with the capacity fade results shown in Figure 10. The clamped cell and the unclamped cell containing the same additive combination have almost the same Rct for the same cycle number which is expected. However, the capacity fade in Figure 10 for these two cells is very different. The reasons for this will be addressed in the next paragraph. The cell containing 1% PES + 2% DTD + 2% TTSPi had the smallest impedance at all voltages and at all cycles, suggesting that this additive combination is superior in maintaining stable films on the electrode particle surfaces.
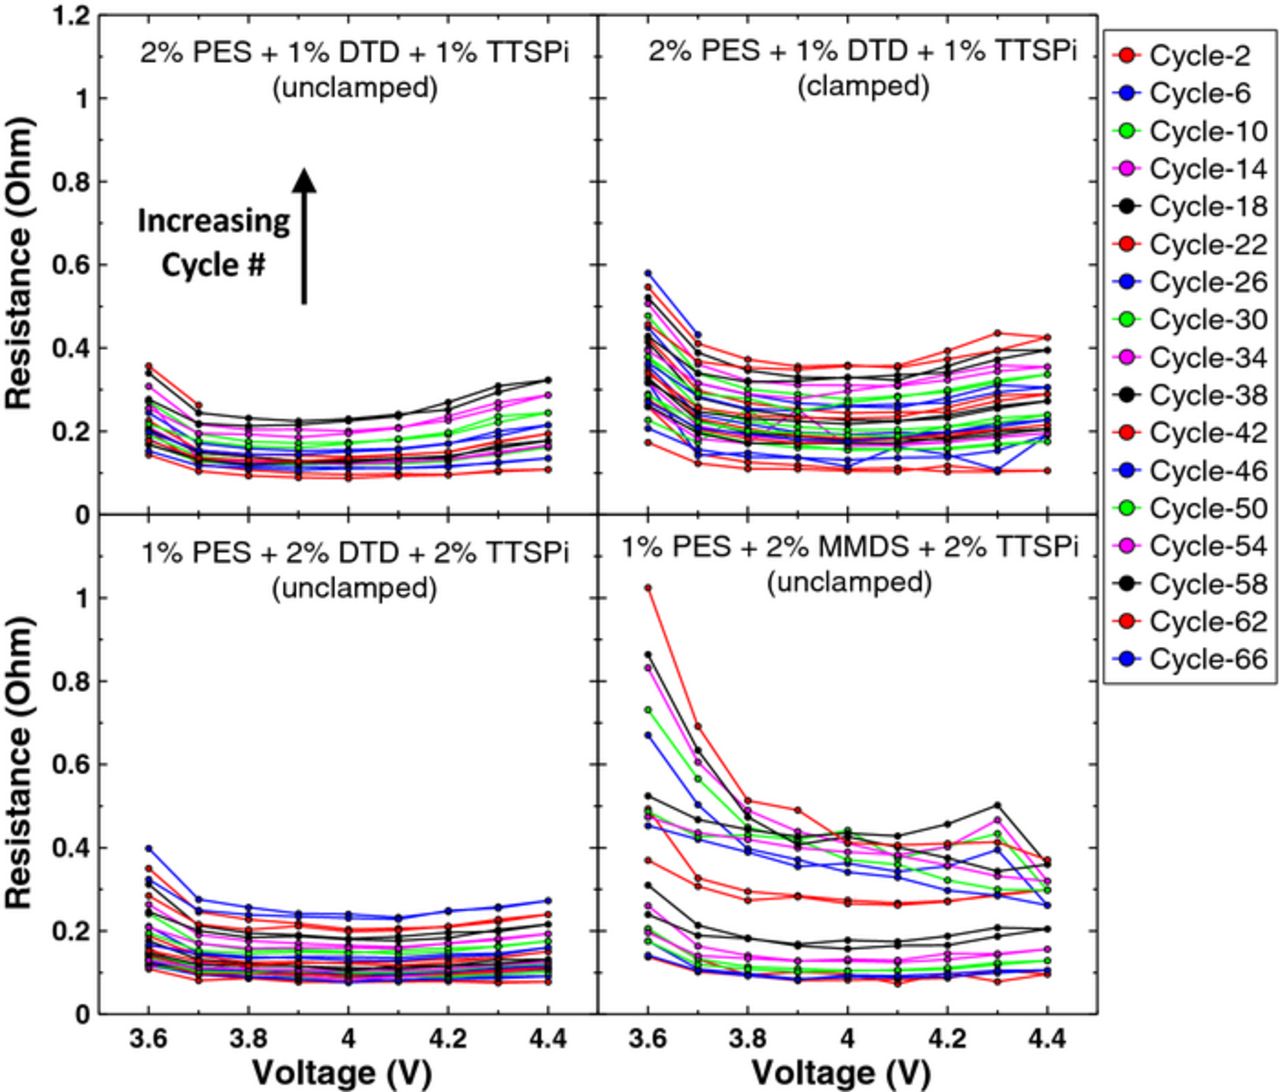
Figure 11. The combination of charge transfer resistance (both positive and negative electrodes) and resistance due to motion of ions through the SEI layers (both positive and negative electrodes), Rct, as a function of voltage measured every 4 cycles. The legend indicates the electrolyte additive sets incorporated in the cells. The arrow in panel a) indicates the trend of the data with increasing cycle number, and applies to all panels.
Figure 12a shows the resistance, Rct, as a function of cycle number for the cells undergoing method 2 as measured at 4.4 V. All cells exhibited impedance growth. The cell containing 1% PES + 2% DTD + 2% TTSPi had low impedance growth until cycle 40 when the slope changed in Figure 12a. This is consistent with the discharge capacity fade shown in Figure 10. Figure 12b shows the difference between the average charge and discharge voltage (delta V) as a function of cycle number. The MMDS-containing cell exhibited a sharp increase in delta V after 20 cycles, while the slope of its Rct versus cycle number stayed constant. The unclamped cell containing 2% PES + 1% DTD + 1% TTSPi exhibited a slight increase in delta V after 35 cycles while the clamped cell did not. This may explain the difference in capacity fade shown in Figure 10. Furthermore, the clamped cell containing 2% PES + 1% DTD + 1% TTSPi and the cell containing 1% PES + 2% DTD + 2% TTSPi show an increase in delta V after 60 cycles, which is consistent with the capacity fade shown in Figure 10 and the increase in Rct at all voltages shown in Figure 11 for these two cells.
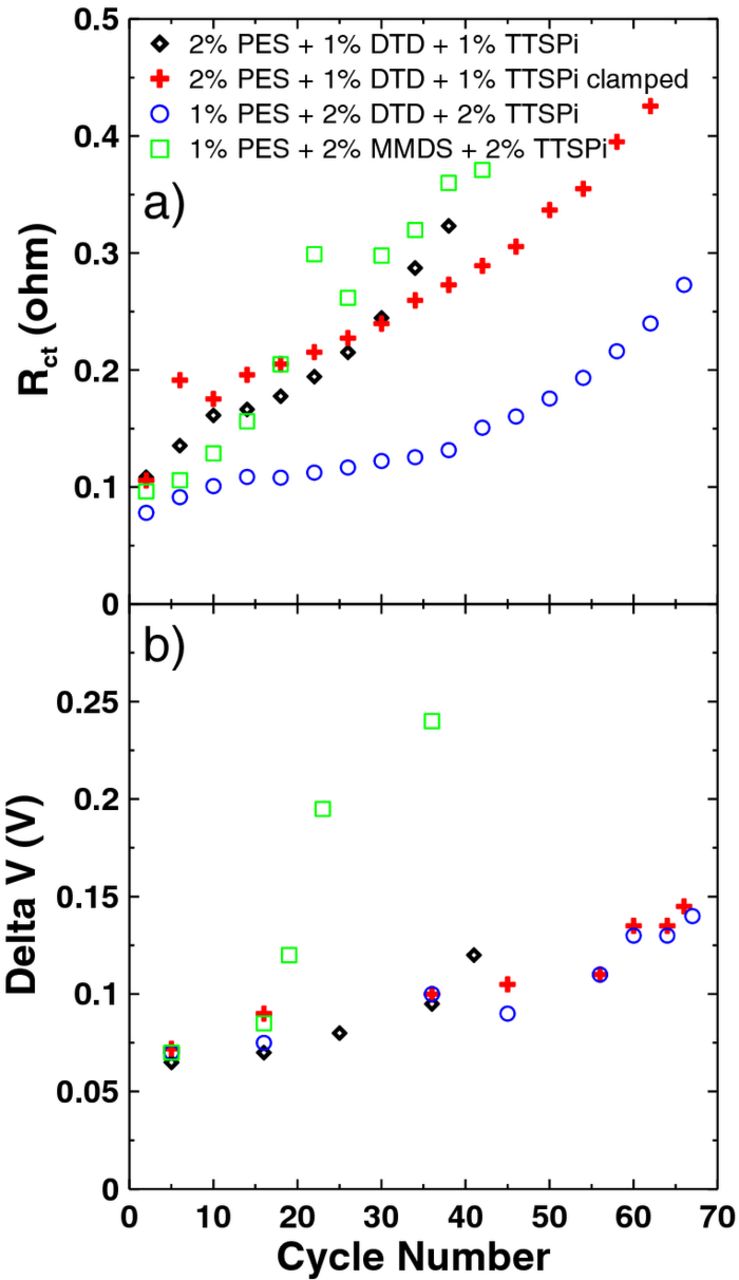
Figure 12. (a) The combination of charge transfer resistance (both positive and negative electrodes) and resistance due to motion of ions through the SEI layers (both positive and negative electrodes), Rct, measured at 4.4 V and (b) the difference between the average charge and discharge voltage, delta V, both as a function of cycle number for the cells undergoing method 2 testing. The legend indicates the electrolyte additive sets incorporated in the cells.
Figure 13 shows the volume of gas evolved in all cells studied during formation (top panel) and during cycling (bottom panel). Cells undergoing method 2 produced more gas during cycling compared to cells undergoing method 1. Figure 14 shows the volume of gas evolved during FRA testing as a function of delta V. The delta V shown is from the last cycle, and the gas was measured when the cell was removed from testing after the last cycle. It appears to us that one must consider several factors in the impedance growth: changes in Rct; changes in solution resistance which were difficult to measure and changes to stack pressure as evidenced by gassing. The cell with 2% PES + 1% MMDS + 1% TTSPi generated significant gas and had large delta V. Perhaps a decrease in stack pressure due to this gassing contributed to the increase in delta V. The cell with 2% VC cycled using method 1 only underwent 47 cycles so did not develop a large delta V nor a large amount of gas, although it did show a significant increase in Rct. The cell with 2% TAP cycled using method 1 underwent 353 cycles and did develop a very large Rct even in the absence of gassing suggesting that for TAP, the increase in Rct is responsible for the capacity fade. The cells with PES + DTD + TTSPi all had delta V near 0.15 V, consistent with similar values of Rct shown in Figure 12, even though some had up to 0.2 ml of gas generated (10% volume expansion). The results of Figure 14 are summarized in Table I, which also lists the number of cycles before the cell was removed. The cycle number given indicates when the gas evolution measurements were taken.
Table I. Summary of the gas evolution and delta V (both measured after the last cycle) for the cells shown in Figure 14.
| Additive Combination * = cell clamped during testing | Method | Maximum upper potential reached during testing (V) | Cycle number when removed from testing | Gas evolution during FRA cycling (ml) | Delta V (V) |
|---|---|---|---|---|---|
| 2% VC | 1 | 4.4 | 47 | 0.01936 | 0.130036 |
| 2% PES | 1 | 4.5 | 135 | 0.13515 | 0.217773 |
| PES211 | 1 | 4.5 | 285 | 0.34912 | 0.25291 |
| 2% TAP | 1 | 4.5 | 361 | 0.07206 | 0.392692 |
| 2% PES + 1% DTD + 1% TTSPi | 2 | 4.4 | 41 | 0.1717 | 0.12 |
| 2% PES + 1% DTD + 1% TTSPi* | 2 | 4.4 | 66 | 0.10249 | 0.145 |
| 1% PES + 2% DTD + 2% TTSPi | 2 | 4.4 | 66 | 0.22898 | 0.14 |
| 1% PES + 2% MMDS + 2% TTSPi | 2 | 4.4 | 42 | 0.36385 | 0.24 |
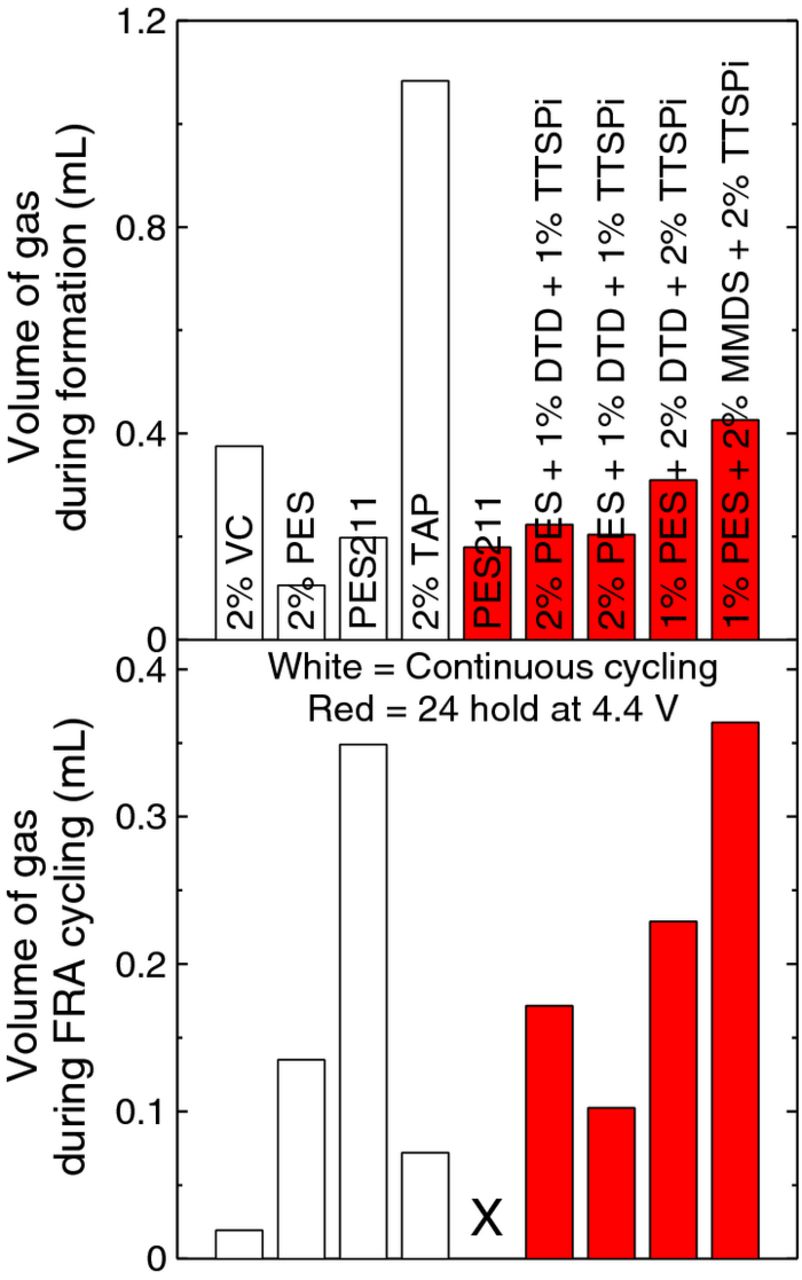
Figure 13. The volume of gas produced in all cells studied (a) during formation and (b) after the completion of charge-discharge cycling.
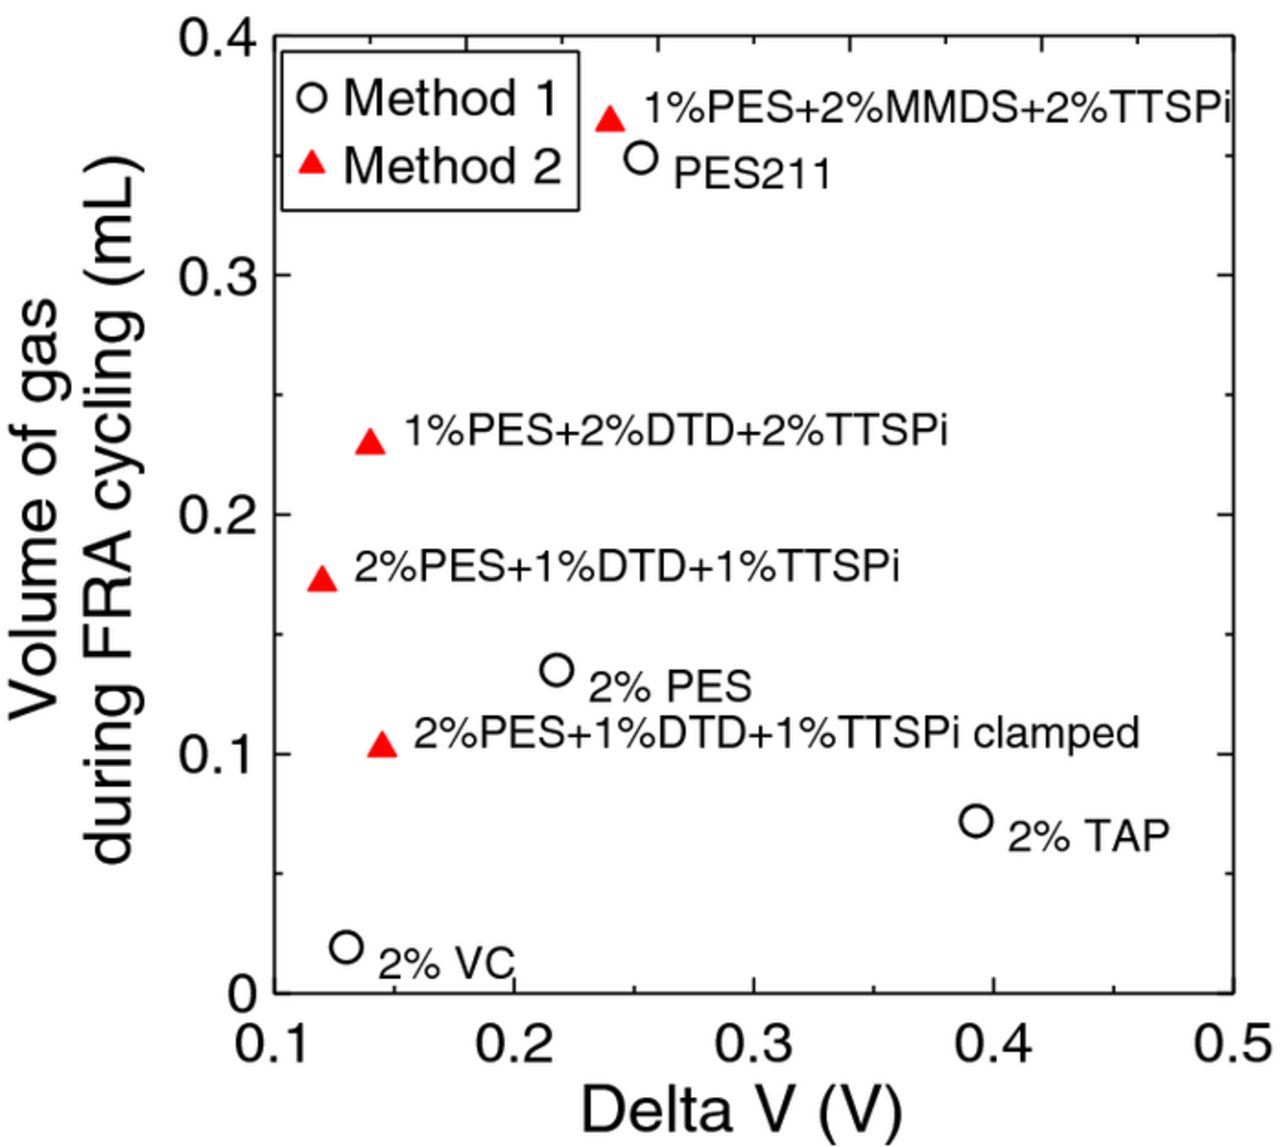
Figure 14. The volume of gas evolved during FRA testing as a function of the difference between the average charge and discharge voltage, delta V, both measured at the end of testing. The reader is cautioned that the cell with 2% VC only underwent 47 cycles in method 1 testing while the cells with TAP and PES211 underwent more than 200 cycles. Details are given in Table I.
Four 240 mAh cells undergoing method 2 testing and one 220 mAh cell undergoing method 1 testing were opened in an argon-filled glove box while at 4.4 V, after they were removed from testing at various cycle numbers. Table II shows photographs of the positive electrode, separator and negative electrode of each cell, as labelled in the first row. The 220 mAh cell undergoing method 1 testing containing PES211 had Li plating on the negative electrode, which is also evidenced by the dark spots on the separator. All 240 mAh cells undergoing method 2 testing showed evidence of Li plating. The cell containing 2% PES + 1% DTD + 1% TTSPi showed a large amount of Li plating on the negative electrode, reflected by dark spots covering the entire separator. The cell containing the same additive combination that was clamped during testing had only a small amount of Li plating and the separator was free of dark spots. However, the entire separator had a brown color, instead of the white color seen in the unclamped cell. Clamping clearly has a significant effect on the amount of Li plating observed in the cells. The cell containing 1% PES + 2% DTD + 2% TTSPi, which exhibited the lowest Rct of all cells, had Li plating on the negative electrode. The separator was also light brown in color. Finally, the cell containing 1% PES + 2% MMDS + 2% TTSPi showed severe Li plating on the negative electrode and the separator was covered with dark spots. This is consistent with the poor capacity retention (shown in Figure 10) and the severe impedance growth in this cell (shown in Figure 11).
Table II. Photos of the positive electrode, separator, and negative electrode for select cells.
| 2% PES + 1% MMDS + 1% TTSPi | 2% PES + 1% DTD + 1% TTSPi | 2% PES + 1% DTD + 1% TTSPi clamped | 1% PES + 2% DTD + 2% TTSPi | 1% PES + 2% MMDS + 2% TTSPi |
|---|---|---|---|---|
| NMC442 220 mAh Method 1 | NMC442 240 mAh Method 2 | NMC442 240 mAh Method 2 | NMC442 240 mAh Method 2 | NMC442 240 mAh Method 2 |
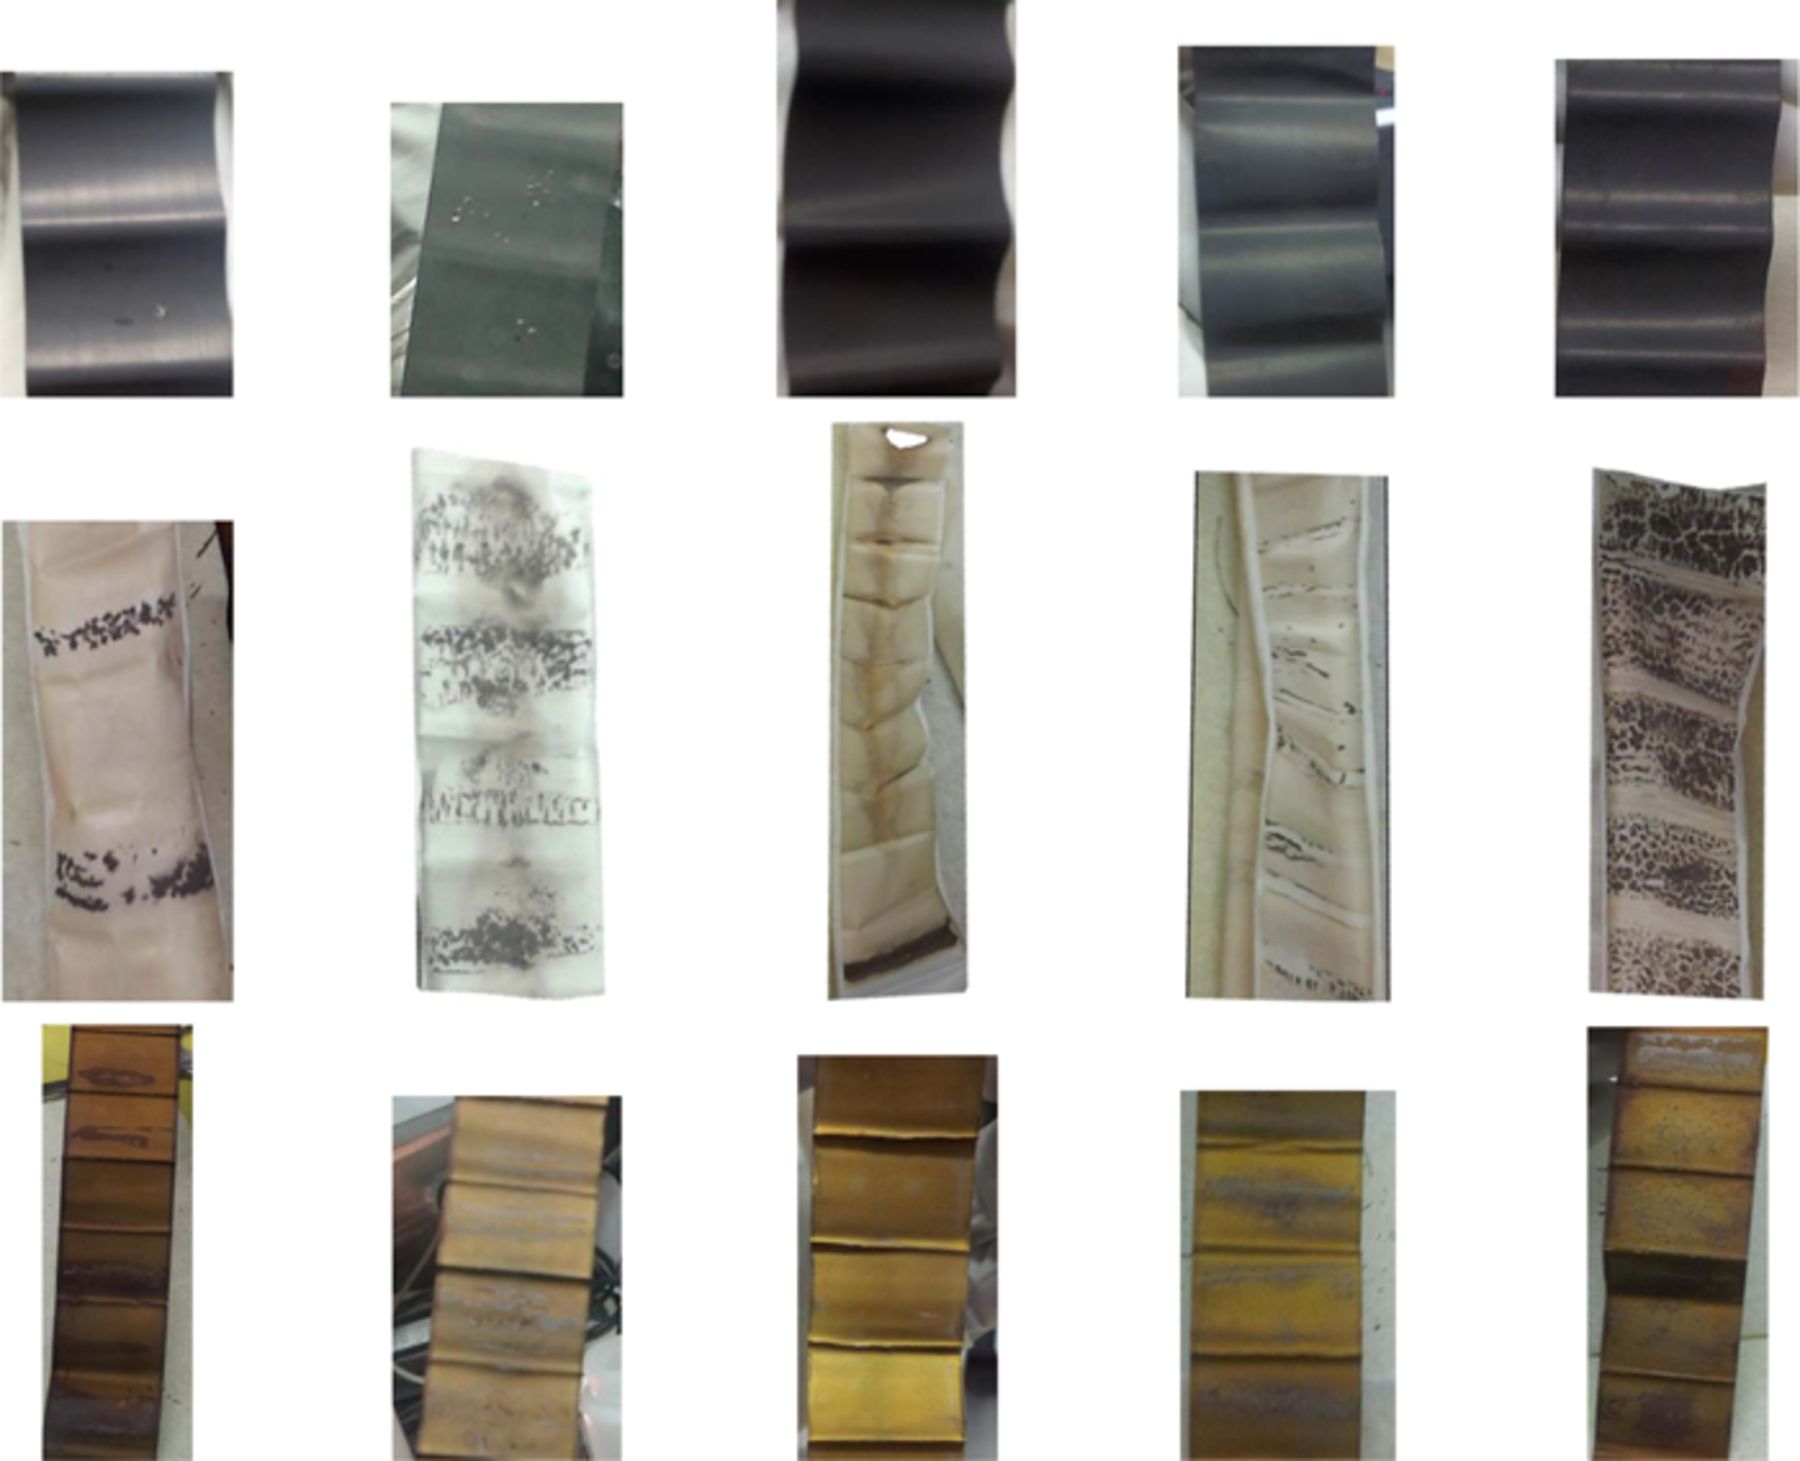 | ||||
It is our opinion that the lithium plating occurs in these cells for two reasons. First, when gassing occurs and stack pressure is lost there may be some regions of the negative electrode with a poor ionic path connecting them to the positive electrode. Those regions will accept less lithium (no plating) and other regions will accept more lithium during charge leading to plating near the top of charge. The cell that was clamped showed little, if any, evidence for Li plating, consistent with this model. Secondly, the impact of electrolyte oxidation during the extended exposure to high potentials is most likely also responsible for lithium plating. Oxidation products migrate to the negative electrode where they form a surface film that eventually blocks the negative electrode porosity and leads to Li plating on the surface during charge.1
Conclusions
The effectiveness of electrolyte additives during high voltage charge-discharge testing of NMC(442)/graphite cells at 40°C was studied through the use of impedance measurements coupled with cycling experiments. The additive combination of 2% PES + 1% MMDS + 1% TTSPi is superior to VC alone and to PES alone when undergoing continuous cycling in terms of capacity retention and impedance growth. However, the effect of a high voltage hold for an extended period of time is detrimental to cell performance due to severe impedance growth. When DTD was used to replace MMDS, severe impedance growth was delayed dramatically and capacity retention was dramatically improved. In particular, cells containing 1% PES + 2% DTD + 2% TTSPi have excellent capacity retention and virtually no impedance change during one cycle and over several cycles. However, some gassing in the cells occurred as did lithium plating. Clamping cells with one of the better additive combinations (2% PES + 1% DTD + 1% TTSPi) eliminated lithium plating but did not dramatically affect the changes in Rct compared to cells with the same additives that were not clamped and that did show lithium plating.
Automated impedance measurements coupled with cycling experiments give valuable information about the effectiveness of additives and additive combinations over a range of voltages and as a function of time and cycle number. One of the most important things learned from this study is that the performance of NMC442/graphite cells tested to 4.4 and 4.5 V can be dramatically improved using electrolyte additives but that the improvements reported here are probably not enough to enable 4.4 and 4.5 V products to be made. Surface science studies are required to learn how these improved additive sets cause the benefits that they do.
Acknowledgments
The authors acknowledge the financial support of NSERC and 3M Canada under the auspices of the Industrial Research Chairs program. KJN, a Nova Scotia Graduate Scholar, thanks NSERC for scholarship support though the CREATE DREAMS program at Dalhousie University. GLd'E thanks NSERC for support under the CREATE DREAMS and USRA programs.