Abstract
Compared to Pt/C, the HOR activity of Pt-Ru alloys in alkaline electrolyte is exceptionally high. Nevertheless, it remains unknown whether this enhancement is due to a bifunctional mechanism involving Pt and Ru as active sites or an electronic effect of Ru on Pt. In this study, we distinguish between those fundamental differences using Ru@Pt core-shell nanoparticles as a model system. Ru@Pt catalysts were prepared from submonolayer to multilayer Pt coverage. The exposure of Ru on the surface of the catalyst was analyzed by cyclic voltammetry, showing that Ru is solely exposed on the surface of Ru@Pt particles with low Pt-coverage. The thickness of the Pt-shell was characterized by CO stripping in H2SO4, allowing to distinguish between single and bilayered Ru@Pt catalysts. Determining the HOR/HER activity of these catalysts in 0.1 M NaOH revealed that fully Pt-covered Ru is more active than partially covered Ru@Pt nanoparticles. Hence, the participation of Ru as active site in a bifunctional mechanism is of minor importance with respect to the HOR/HER activity compared to its influence on the electronic structure of Pt. Similar to Pt-Ru alloys, the most active Ru@Pt core-shell nanoparticles show a 4 to 5-fold enhancement of the surface-normalized HOR/HER activity compared to Pt/C.
Export citation and abstract BibTeX RIS

This is an open access article distributed under the terms of the Creative Commons Attribution 4.0 License (CC BY, http://creativecommons.org/licenses/by/4.0/), which permits unrestricted reuse of the work in any medium, provided the original work is properly cited.
Fuel cells are a promising technology for automotive applications, supplying electricity by converting H2 and O2 to H2O in an electrochemical reaction.1 Whereas the oxidation of H2 on the anode side of proton exchange membrane fuel cells (PEMFCs) is facile on platinum with an exchange current density as high as i0293K ≈ 80 mA cm-2Pt (extrapolated to 293 K based on H2-pump experiments between 313–353 K),2 the reaction rate is sluggish in alkaline environment and the exchange current density decreases by approximately 2 orders of magnitude (i0293K ≈ 0.6 mA cm-2Pt).3,4 The cause of this tremendous difference is still subject of discussion within the field of electrochemistry. Density functional theory (DFT) calculations by Nørskov et al. on the hydrogen evolution reaction (HER) activity of different monometallic surfaces revealed a volcano like relation of the exchange current density and the M-Hads (M = metal) binding energy (BE).5 Of all the investigated monometallic surfaces, Pt exhibits the highest HER activity. According to Nørskov et al., the Pt-Hads binding is slightly stronger compared to the hypothesized theoretical optimum. Further studies indicated a shorter Pt-Hads bond distance in alkaline vs. acid environment, hence a larger Pt-Hads BE.6–8 In accordance with this, several researchers expect the Pt-Hads BE to be responsible for the low hydrogen oxidation/evolution reaction (HOR/HER) activity of common noble metals in base compared to acid.2,4,9–11 In 2015, Sheng et al. reported a monotonic decrease of the HOR/HER activity as a function of pH, determined by RDE in buffered electrolytes. They correlated this trend to the increasing Pt-Hads BE at higher pH, indicated by the potential shift of the Hupd process in cyclic voltammetry (CV).11 It is a known phenomenon in chemistry that bimetallic systems (e.g. alloys) can have different electronic properties than the single metals they are composed of. This may cause a variation of the binding strength toward an adsorbate, termed electronic or ligand effect. Ruban et al. reported a downshift of the platinum d-band center for a Pt overlayer on Ru compared to pure Pt, thus a weaker Pt-Hads BE.12 In fact, the beneficial combination of Pt and Ru as catalytic system for the HOR was reported by various groups in acidic13–15 and alkaline media.14,16–18 In contrast to Pt-Hads as a sole descriptor for the HOR/HER activity of Pt in acidic versus alkaline environment, Ledezma-Yanez et al. recently attributed the pH effect to a reorganization of interfacial water at the catalyst surface, influencing the barrier for hydrogen adsorption.19 However, both effects, a variation of the Pt-Hads BE and the reorganization of interfacial water, are closely related to the electronic properties of the catalyzing metal and are expected to differ between a monometallic and a bimetallic surface. In the further analysis of this manuscript, no disentanglement between those hypothesis is made, and both are termed "electronic effect". Furthermore, with the presented measurements, we are not able to identify the origin of the electronic modification, which could be related to an electronic interaction of ruthenium and platinum or to a strain effect as described by Adzic et al.20
Taking a different view, Strmcnik et al. proposed that a change of the HOR mechanism in alkaline compared to acid is the reason for the high activity of bimetallic Pt-Ru alloys.21 In this case, dissociated H2 is believed to be adsorbed on Pt, whereas the more oxophilic Ru adsorbs hydroxide to form water via a bifunctional mechanism.
![Equation ([1])](https://content.cld.iop.org/journals/1945-7111/165/5/H229/revision1/d0001.gif)
![Equation ([2])](https://content.cld.iop.org/journals/1945-7111/165/5/H229/revision1/d0002.gif)
![Equation ([3])](https://content.cld.iop.org/journals/1945-7111/165/5/H229/revision1/d0003.gif)
To date, it remains unknown whether the experimentally observed HOR/HER activity enhancement of Pt-Ru compared to pure Pt is due to a bifunctional mechanism or an electronic effect. In this study, we seek to identify the cause of the high HOR/HER activity in the bimetallic Pt-Ru system by preparing Ru@Pt core-shell nanoparticles with different Pt shell thickness (Figure 1) and determining their intrinsic HOR/HER activity in 0.1 M NaOH, complementing our previous preliminary study with a detailed microscopic analysis of the synthesized particles and with a more in-depth analysis of the HOR/HER kinetics.22
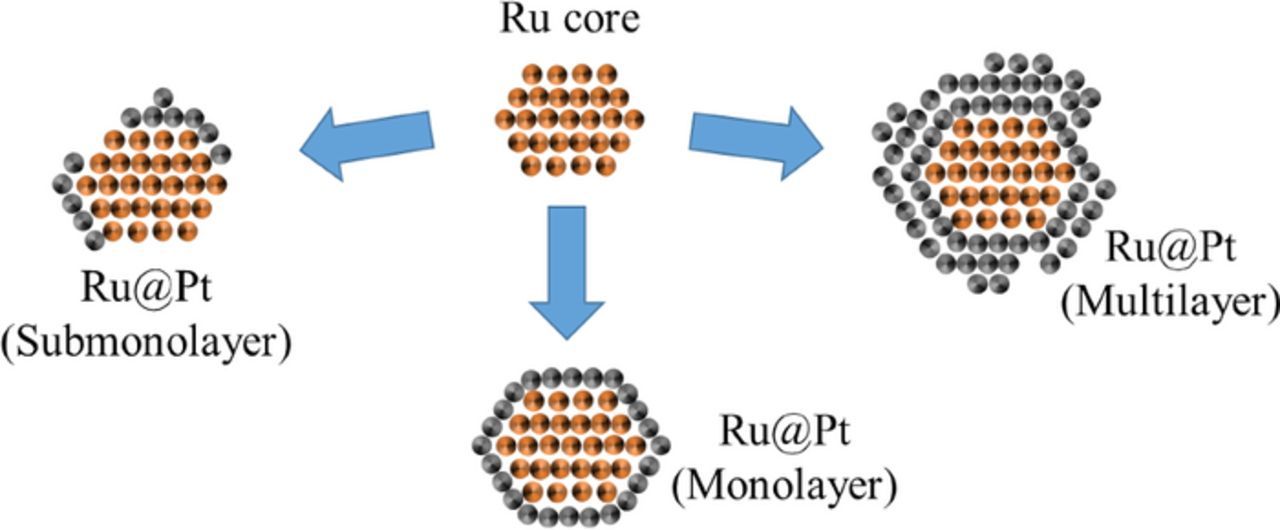
Figure 1. Schematic of Ru@Pt core-shell nanoparticles with different Pt-shell thickness on a Ru nanoparticle. Reproduced from Schwämmlein et al. with permission of The Electrochemical Society.22
With respect to a bifunctional mechanism, Ru atoms are thought to actively participate in the oxidation of hydrogen by adsorbing hydroxide, and thus would need to be present on the surface of the catalytic material in the vicinity of the Pt atoms. In accordance with this, Ru@Pt core-shell nanoparticles with submonolayer Pt coverage would be expected to be highly active compared to pure Pt. The activity normalized by the noble metal surface area (in units of mA cm-2NM, with NM being Pt + Ru) is expected to increase with the Pt coverage within the submonolayer coverage of Pt on Ru (Ru@Pt) up to an optimized surface composition of Pt and Ru (Figure 2). In other words, the activity of each Pt atom stays constant, while the contribution of Pt to the total noble metal surface area increases when more Ru sites are covered by Pt, i.e., the activity normalized by the total noble metal surface area (Pt + Ru) increases. Depositing more Pt on the core would eventually cover more and more Ru sites, which then no longer could contribute to the reaction by supplying hydroxide. As a consequence, the expected activity of a fully Pt encapsulated Ru particle would be similar to that of pure Pt, since this is the only active site remaining on the surface of the particle.
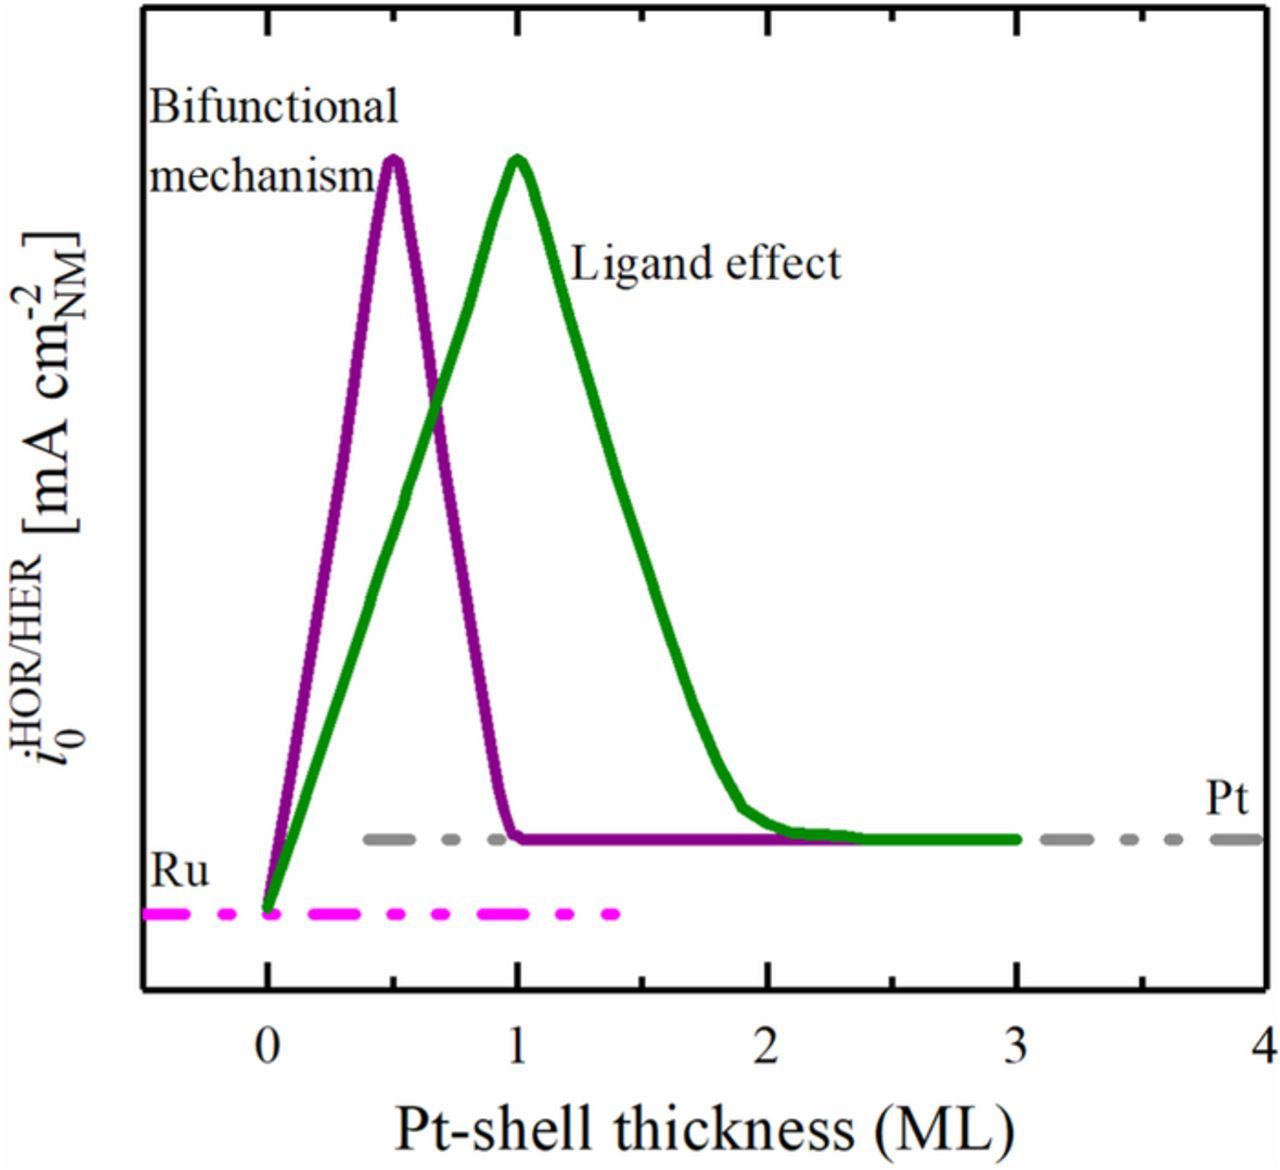
Figure 2. Theoretical trend of the HOR/HER activity (in mA cm-2NM) vs. Pt coverage of Ru@Pt core-shell catalysts in alkaline media for a purely bifunctional mechanism (purple line) compared to a purely electronic effect (green line). Reproduced from Schwämmlein et al. with permission of The Electrochemical Society.22
In the case that an electronic effect were to be the main cause of the high HOR/HER activity of the Pt-Ru system, Ru@Pt particles with submonolayer Pt coverage would also show high activity compared to pure Ru. However, the total noble metal surface area normalized HOR/HER exchange current density of the catalyst would be expected to increase with increasing Pt coverage, and the HOR/HER activity maximum should occur only once at least all of the Ru core is fully encapsulated by Pt (i.e., once the Pt monolayer coverage is ≥1). This assumes that the HOR/HER kinetics on pure Ru are substantially smaller than on pure Pt,23,24 which indeed is the case and will be shown also in the following. Whether the hypothesized electronic effect of Ru on the Pt-Hads BE is most beneficial for the first, the second, or any subsequent Pt overlayer would determine if a mono-, bi- or multi-layered Ru@Pt particle were to show the HOR/HER activity maximum. The optimum with respect to the amount of Pt overlayers depends mainly on the nature and range of the electronic effect of the Ru core and is not known so far. Nevertheless, Schlapka et al. showed by deposition of Pt on Ru(0001) that the electronic effect of Ru on the Pt-COads BE is strongest in the first Pt monolayer (ML) and that it vanishes for ca. 3 monolayers and beyond.25 If the same were true for the HOR/HER, we would expect an activity maximum anywhere between 1 and maximum 3 monolayers of Pt on Ru. Increasing the Pt shell thickness beyond this coverage would then have to lead to an activity decay, eventually approaching the activity of pure Pt.
In the following we will first describe briefly how the Ru@Pt catalysts with (sub-)monolayers of Pt were prepared as well as the design of the experiments. Secondly, the catalyst itself will be characterized by various physical-chemical (TEM) and electrochemical methods (CV, CO stripping) to finally determine the HOR/HER activity of all prepared Ru@Pt, Pt, and Ru catalysts via the rotating disk electrode (RDE) method in alkaline media.
Experimental
The synthesis of Ru@Pt core-shell nanoparticles, electrode, and ink preparation, as well as the setup and measurement procedure were already reported in a previous publication.22
Synthesis of Ru@Pt core-shell nanoparticles
Ru was prepared from 4.2 mg RuCl3 (45–55% Ru content, Sigma Aldrich Corp., Germany) and 2.1 mg Polyvinylpyrrolidone (PVP) (average Mw ≈ 55000 g mol−1, Sigma Aldrich Corp., Germany) dissolved in 40 mL of water-free ethylene glycol (99.8%, anhydrous, Sigma Aldrich Corp., Germany), deaereated by argon (6.0-grade, Westfalen AG, Germany) and heated from room temperature to 155°C at a constant rate of 4°C min−1. The temperature of the heating ramp was controlled by an automatic temperature control device (Model 310, J-KEM, Inc., USA). After keeping the temperature constant at 155°C for 90 min, the suspension was left to cool down to room temperature. Meanwhile, the respective amount (calculated according to Equation 4, using the desired monolayer equivalents of Pt and the mass of Ru, added during the synthesis) of high purity K2PtCl4 (99.99% [metals basis], Sigma Aldrich Corp., Germany) was dissolved in 40 mL of deaerated ethylene glycol, added at once to the Ru containing suspension at room temperature and stirred for 10 min. To deposit Pt on Ru, the mixture was heated another time to 155°C at the same rate as before and held at this temperature for 90 min. After the mixture has cooled down to room temperature, the Ru@Pt nanoparticles were added to Vulcan carbon (Tanaka Kikinzoku International K. K., Japan) dispersed in 80 mL ethylene glycol and stirred for 14 h. The amount of carbon used as support for core-shell nanoparticles was chosen to achieve a loading of 8%wt Ru@Pt. Subsequently, the suspension was mixed with acetone and centrifuged at 11500 rpm (10 min, 5°C) in an ultra-centrifuge (5810 R, Eppendorf GmbH, Germany) to separate the catalyst and the solvent. Then, the catalyst was washed three times with acetone, once in 2-propanol (Chromasolv Plus, 99.9%, Sigma Aldrich Corp., Germany) and finally dried at 70°C in air. For each Pt:Ru ratio to obtain various Pt shell thicknesses, the Ru core was synthesized freshly.
Electrode and ink preparation
Glassy carbon (GC) electrodes (5 mm diameter, Pine Research Instrumentation, USA), supported by a PTFE-body (Pine Research Instrumentation, USA) were polished with 0.05 μm Al2O3 polishing suspension (Bühler AG, Germany), sonicated various times in ultrapure water (18.2 MΩ cm, Merck Millipore KGaA, Germany) and cleaned by subsequent dipping in 5 M KOH (99.99% purity, Semiconductor grade, Sigma Aldrich Corp., Germany), 2M HClO4 (60%, Cica Reagent, Kanto Chemical Co., INC., Japan) and ultrapure water. Inks were prepared by adding ultrapure water to the dry catalyst followed by high purity 2-propanol (Chromasolv Plus, 99.9%, Sigma Aldrich Corp., Germany). The solvent mixture consisted of 80%v 2-propanol and 20%v H2O. The catalyst content of the ink was adjusted to achieve a very thin catalyst layer thickness of only ≈0.6 μm by choosing noble metal loadings of ≈2 μgNM cm-2geo (corresponding to 0.022 mgVulcan cm-2geo, which at a packing density of ≈28 μm (mgVulcan cm-2geo)−1 yields a thickness of ≈0.6 μm26) for HOR/HER kinetic measurements in alkaline electrolyte. For solely cyclic voltammetric measurements in acid electrolytes, higher loadings of ≈4.7 μgNM cm-2geo were used, corresponding to film thickness of ≈1.5 μm. The catalyst suspension was sonicated for 30 min in a sonication bath (Elmasonic S 30 H, Elma Schmidbauer GmbH, Germany) to achieve a homogeneous dispersion. The temperature of the bath was maintained at less than 25°C to avoid evaporation of the solvent. Subsequently, Nafion (5%wt in lower aliphatic alcohols, 15–20% H2O, Sigma Aldrich Corp., Germany) was added to the suspension resulting in an ionomer to carbon ratio of 0.15/1 gI gC−1. Prior to coating, the ink was sonicated in a lower energy sonication bath (USC100T, VWR International GmbH, Germany) for at least 15 min. Finally, 7 μL of ink were dropped on a GC, covered with a small glass vial and left to dry at room temperature.
Setup and measurement procedure
Electrolyte solutions were prepared from high purity NaOH · H2O (99.9995% [metals basis], TraceSELECT, Sigma Aldrich Corp., Germany) or H2SO4 (Ultrapur, 96%, Merck Millipore KGaA, Germany) by addition of ultrapure water. Argon and hydrogen used for purging of the electrolyte were of high purity (6.0-grade, Westfalen AG, Germany); carbon monoxide (4.7-grade, Westfalen AG, Germany) was used for CO stripping voltammetry. The single-cell PTFE setup including the cleaning procedure prior to electrochemical measurements in alkaline environment was already described in an earlier work.3 A home-made Ag/AgCl reference electrode, saturated with KCl (99.999% purity, Sigma Aldrich Corp., Germany) was used for measurements in alkaline electrolyte. For experiments in sulfuric acid, a glass cell was used with a reversible hydrogen electrode (RHE) as reference. The reference potential was calibrated in H2-saturated electrolyte prior to every experiment using the platinum ring of the electrode. Independent of the reference electrode used during the measurement, all potentials in this publication are given with respect to RHE.
Electrochemical measurements were performed using an Autolab potentiostat (PGSTAT302N, Metrohm AG, Switzerland) and a rotator (Pine Research Instrumentation, USA) with a polyether ether ketone shaft. Prior to any activity determination measurements, catalysts were cleaned by cycling the potential 15 times between 0.05 and 0.8 VRHE at 50 mV s−1. Afterwards, the electrolyte solution was replaced by fresh 0.1 M NaOH and saturated with H2. The resistance was determined by electrochemical impedance spectroscopy (EIS) from 100 kHz to 100 Hz at open circuit potential (OCP) with an amplitude of 10 mV. After fully saturating the electrolyte with H2, polarization curves were recorded from −0.025 VRHE to 0.800 VRHE at 10 mV s−1 and 1600 rpm while the gas was set to blanketing. To calculate the exchange current density, i0, the cathodic-going scans of the polarization curves in H2-saturated electrolyte were evaluated. To determine the electrochemical surface area (ECSA), CO stripping was performed by applying a constant potential of 0.06 VRHE and purging CO for 3 min. Subsequently, CO was removed from solution by Ar-purging for 20 min while the potential was kept constant. The adsorbed CO was oxidized in a CV from 0.05 to 1.00 VRHE at a scan rate of 10 mV s−1, starting at 0.06 VRHE. The second CV was used as baseline to correct for the capacitance and the roughness factors (rf) were calculated from the resulting integral, using a specific charge of 420 μC cm-2NM (NM = noble metal).
TEM imaging
Samples for TEM analysis were prepared by dispersing a very small amount of the catalyst in Milli-Q water and/or 2-propanol and then depositing a few drops of the dispersion on Formvar-supported carbon-coated Cu400 TEM grids (Science Services GmbH, Germany). Imaging was performed using a Philips CM100 EM operated at 100 kV and a resolution of 0.5 nm. TEM images taken with this device were used to establish a particle size distribution profile of each individual catalyst. Further high spatial resolution TEM experiments were performed on a FEI Scanning/Transmission Electron microscope equipped with a high brightness electron gun and a four segmented electron energy dispersive spectrometer (Super-X detector). Data using the high angle annular dark field (HAADF) detector in STEM mode were acquired at 300 kV with a low beam current of ≈60 pA to minimize damage/contamination effects.
Results and Discussion
Catalyst loading and TEM images
In the course of this study, several Ru@Pt core-shell nanoparticles with varying Pt:Ru ratio were prepared via a polyol process and directly supported on Vulcan carbon. The Ru and Pt content of all samples was determined by elemental analysis via inductively coupled plasma mass spectroscopy based on two individual measurements of each element, including reference samples for Pt, Ru, and a mixture of Pt and Ru. Additionally, the carbon content of the catalysts was measured by oxidizing it to CO2 at elevated temperatures in air. The resulting catalyst composition of all prepared Ru@Pt core-shell nanoparticles with respect to carbon, Pt and Ru content, as well as that for the plain Ru core and pure Pt, are given in Table I. The target Pt coverage or shell thickness in monolayers, termed monolayer equivalents (MLE), was achieved by controlling the molar ratio of the two noble metals in the Ru@Pt catalysts. The Pt-MLE on the Ru core was calculated according to the following equation. The derivation of this formula can be found in the appendix.
![Equation ([4])](https://content.cld.iop.org/journals/1945-7111/165/5/H229/revision1/d0004.gif)
where n is the molar quantity of either Pt or Ru determined via elemental analysis, ρ is the density of the metal (ρRu = 12.45 g cm−3, ρPt = 21.45 g cm−3), rRu,particle is the radius of the Ru core formed in the synthesis, rPt,atom is the radius of a single Pt atom (0.135 nm), and M is the molar mass of the respective metal (MRu = 101.1 g mol−1, MPt = 195.1 g mol−1). To determine the MLE of the Ru@Pt catalysts, a fully spherical Ru core with a diameter of rRu,particle = 1.9 nm (corresponding to  in Table I) and no particle agglomeration were assumed. We would like to emphasize that the term MLE is merely a conceptual number. On the one hand, a catalyst with e.g., one MLE of Pt on Ru could consist of Ru particles with an exact diameter of 1.9 nm, covered with a single monolayer of Pt. On the other hand, the catalyst could be composed of a mixture of monolayered and bilayered Pt on Ru particles with different size, where the residual Ru surface remains uncovered. The Ru surface exposure, as well as the Pt shell composition are analyzed in more detail in a latter section of this manuscript.
Table I. Monolayer-equivalents (MLEs) for Ru@Pt catalysts calculated via the molar fraction of Pt and Ru in the catalyst by assuming a fully spherical Ru core with a diameter of 1.9 nm and a homogeneous Pt shell. The number-averaged ( , see Equation 5) and the size-averaged (
 ; see Equation 6) diameters were obtained from the TEM-based particle size distributions in Figure 4.
| MLE | Pt:Ru | Pt content | Ru content | C content |  |
 |
|
|---|---|---|---|---|---|---|---|
| Catalyst | [#] | molar ratio | %wt | %wt | %wt | nm | nm |
| Pt | - | - | 9.4 | 0 | 90.6 | 4.1 | 4.3 |
| Ru | 0 | - | 0 | 8.1 | 91.9 | 1.8 | 1.9 |
| Ru@Pt | 0.3 | 0.2 | 2.5 | 6.0 | 91.5 | 2.0 | 2.1 |
| Ru@Pt | 0.5 | 0.4 | 3.2 | 4.3 | 92.5 | 2.5 | 2.6 |
| Ru@Pt | 0.9 | 0.9 | 5.0 | 3.0 | 92.0 | 2.9 | 3.1 |
| Ru@Pt | 1.4 | 1.5 | 6.0 | 2.1 | 91.9 | 3.0 | 3.3 |
| Ru@Pt | 1.8 | 2.3 | 7.0 | 1.6 | 91.4 | 3.5 | 3.7 |
| Ru@Pt | 2.1 | 2.8 | 7.1 | 1.3 | 91.6 | 3.1 | 3.3 |
| Ru@Pt | 2.3 | 3.8 | 7.4 | 1.2 | 91.4 | 4.2 | 4.4 |
Table I shows the series of prepared catalysts with increasing MLEs for Ru@Pt from 0.3 to 2.3 MLE, hence ranging from partially covered Ru nanoparticles all the way to catalysts with a sufficiently high Pt content to fully encapsulate the Ru core. The total metal content in all samples was determined to be between 7.5 and 8.6%wt with little deviation between the individual catalysts (see Table I). Furthermore, TEM images reveal that the catalyst is homogeneously distributed over the whole carbon support with a low degree of agglomeration between the individual catalyst particles (Figure 3a), as was observed for all of the prepared catalysts (data not shown). Based on measuring the size of more than 100 individual particles, the particle size distribution of all prepared samples was determined (Figure 4). The number-averaged ( ) and size-averaged (
 ) diameters were calculated according to Equations 5 and 6:
![Equation ([5])](https://content.cld.iop.org/journals/1945-7111/165/5/H229/revision1/d0005.gif)
![Equation ([6])](https://content.cld.iop.org/journals/1945-7111/165/5/H229/revision1/d0006.gif)
where di is the measured diameter of the respective particle and li is the number of particles that have this diameter. The resulting diameters are listed in Table I. The TEM analysis shows that the Ru core has an average diameter of  = 1.9 nm with a size distribution ranging from 1.2 to 2.6 nm (see upper panel of Figure 4). By depositing Pt on the Ru nanoparticles, the particle size distribution broadens (see Figure 4) and shifts toward larger diameters (see Table I).
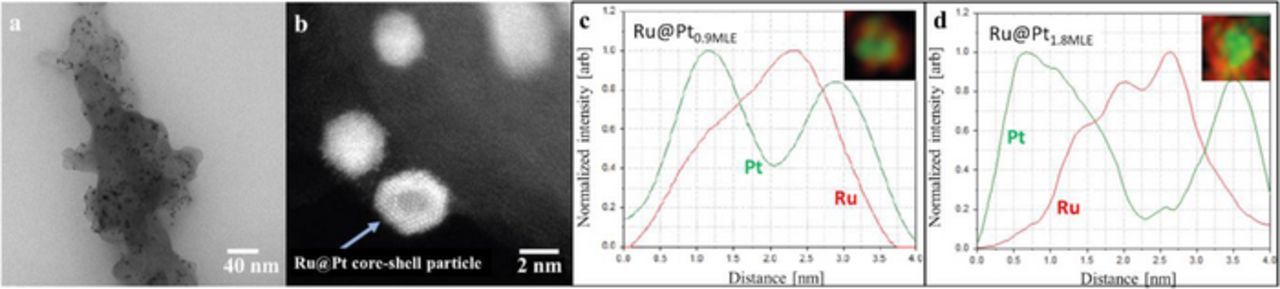
Figure 3. a) Representative TEM image of Ru@Pt, showing a catalyst with a Pt:Ru ratio of 0.9 (corresponding to the 0.9 MLE catalyst; see Table I) at a magnification of 73000x. Similar images were taken of all prepared catalysts and used to evaluate the particle size distribution of the samples. b) High resolution STEM image of a Ru@Pt catalyst with the same MLE of 0.9, showing a faceted core-shell structure. Results of an energy-dispersive X-ray spectroscopy (EDS) scan of individual catalyst particles are shown for c) Ru@Pt0.9MLE and d) Ru@Pt1.8MLE.
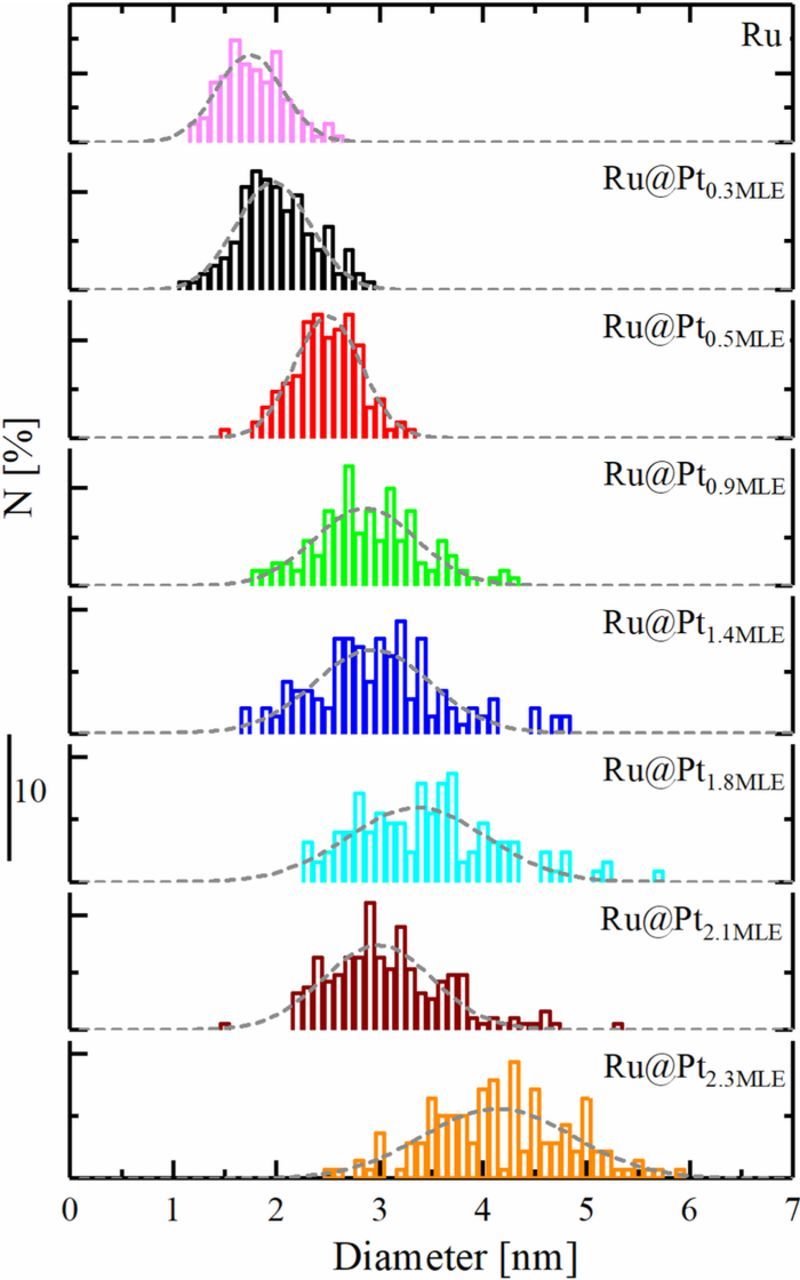
Figure 4. Particle size distribution in % of all measured particles for all prepared Ru@Pt/C catalysts, including pure Ru. The particle size distribution closely resembles a Gaussian distribution (gray dashed lines). For each catalyst, at least 100 particles were counted.
A quantitative estimate of the Pt shell thickness on the basis of the particle size distribution is rather delicate due to various reasons. First, every synthesis of Ru@Pt was based on synthesizing a fresh batch of Ru nanoparticles on which Pt was deposited directly. Therefore, the exact particle size distribution of the Ru core might be slightly different from batch to batch, and the average diameter can also be slightly different from that given in Table I. Second, the resolution of the TEM instrument used to obtain the particle size distribution is in the order of an atomic monolayer (0.5 nm). Third, it is not known in which form Pt grows on Ru and if the Pt in the shell is already oxidized when the TEM measurement is performed. For these reasons, while the particle size distribution indicates the change in the Pt coverage/shell thickness with increasing Pt content, it is not sufficiently precise to determine the exact Pt shell thickness. Thus, in order to obtain further insight into the morphology of the prepared catalysts, high-resolution scanning transmission electron microscopy (STEM) images were taken. Figure 3b shows an image of a faceted core-shell nanoparticle of the Ru@Pt0.9MLE catalyst. It can be clearly observed that the particle in the focus of the STEM image shows two separate domains, a core and a shell with different brightness. Furthermore, spatially resolved energy-dispersive X-ray spectroscopy (EDS) of individual particles were collected on several samples. A comparison of the EDS profile of a Ru@Pt particle with a nominal coverage of 0.9 MLE (Figure 3c) with that with a nominal coverage of 1.8 MLE (Figure 3d) provides further evidence for an increase of the Pt content in the shell as the MLE value increases. Based on this consistency check, it is reasonable to assume that Figure 3c shows a Ru core, at least partially covered by a single Pt overlayer while Figure 3d shows a fully covered core-shell nanoparticle.
Electrochemical characterization by cyclic voltammetry
As mentioned earlier, the determination of the surface composition of the prepared Ru@Pt core-shell nanoparticles is crucial to obtain an insight into the origin of the superior HOR/HER activity of bimetallic Pt-Ru catalysts. To distinguish between a bifunctional mechanism and an electronic effect, it has to be clarified whether Ru is exposed on the surface of the prepared particles or if it is fully encapsulated within a mono- or multilayered Pt shell. The formation and reduction of the oxide layer on the Ru metal in a CV in liquid electrolyte was used before by El-Sawy et al. to qualitatively describe the presence of Ru on the surface of partially covered Ru@Pt core-shell nanoparticles as well as fully Pt covered Ru nanoparticles.27 Due to its oxophilicity, Ru is covered with an ad-layer of oxygenated species at potentials cathodic to those of platinum in aqueous electrolyte and no interference of the Pt oxide and Ru oxide reduction peaks is expected in a CV in base or acid electrolyte. Nevertheless, Ru oxidation and reduction in alkaline solution does not occur at a well-defined potential (see dash-dotted line in Figure 5a), distinct from the Hupd process on pure Pt or the Pt shell of Ru@Pt particles (Figures 5b and 5c). In contrast to this, a well-defined cathodic peak correlates with the reduction of the Ru oxide in dilute sulfuric acid at a potential of ≈280 mVRHE (see solid line in Figure 5a).
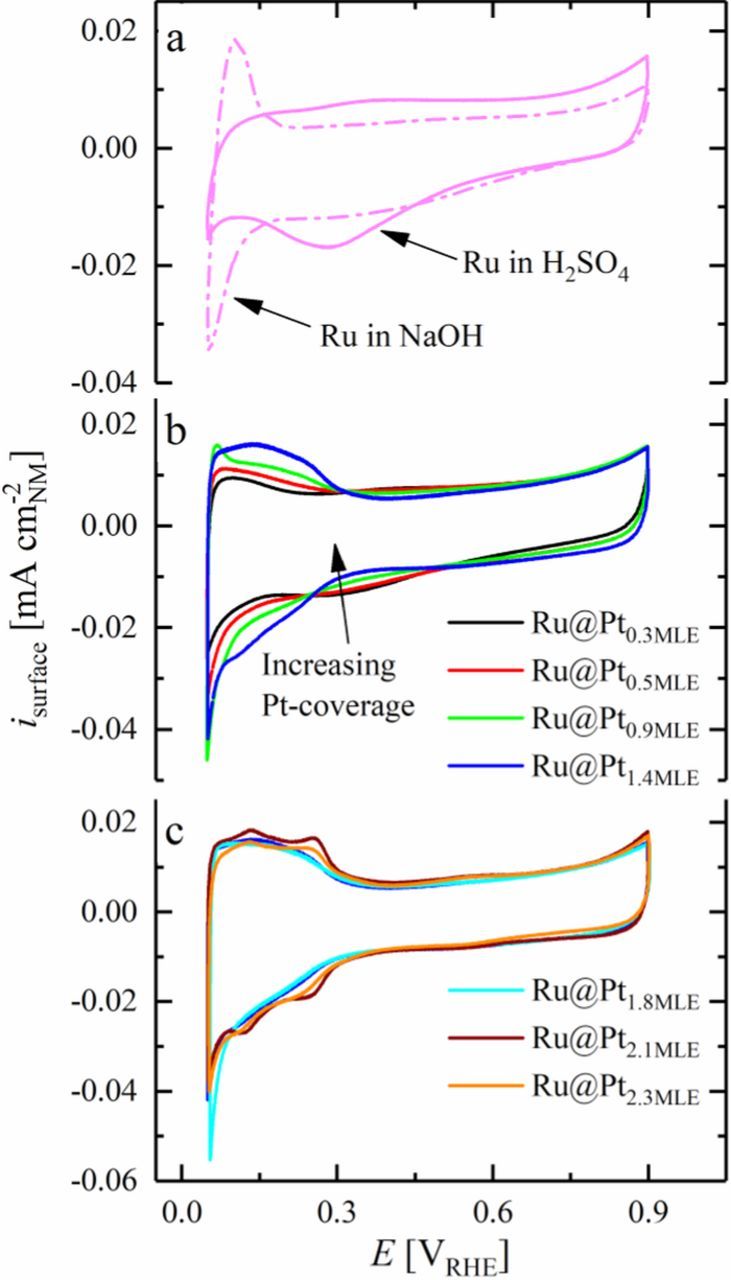
Figure 5. Cyclic voltammogram of a) Ru/C at 20 mV s−1 in Ar-saturated 0.1 M H2SO4 (solid line) and 0.1 M NaOH (dash-dotted line), respectively and of Ru@Pt/C core-shell nanoparticles with b) submonolayer and c) multilayer Pt shell in Ar-saturated 0.1 M H2SO4 at 20 mV s−1 (Pt coverages are given in the Figure in terms of their MLE values). All measurements were done at room temperature in stagnant electrolyte. The current obtained in the CV was normalized to the surface area of the catalyst, as determined by CO stripping voltammetry at the end of the CV measurements. Reproduced from Schwämmlein et al. with permission of The Electrochemical Society.22
Covering the Ru core with a small amount of Pt, e.g., at a level of 0.3 MLE in Ru@Pt0.3MLE, causes a slight potential shift of the Ru oxide reduction peak to ≈320 mVRHE (see black line in Figure 5b). This potential shift is tentatively assigned to the varied electronic structure of Ru nanoparticles covered with a small amount of Pt with respect to pure Ru. The absence of a shoulder (at ≈280 mVRHE) in the cathodic peak at 320 mVRHE supports our initial assumption that Ru@Pt core-shell nanoparticles are free of pure Ru nanoparticles even for low Pt:Ru ratios. As the Ru core gets covered with larger amounts of Pt by increasing the Pt MLE value (i.e., the Pt:Ru ratio) of the catalysts, the surface normalized peak current density for the Ru oxide reduction decreases significantly (see Figure 5b), indicating the loss of Ru surface sites. At a Pt MLE value of 1.4 (blue line in Figure 5b), the Ru oxide reduction peak disappears entirely. The current in the cathodic scan of the CVs for Ru@Pt nanoparticles with higher Pt MLE values (Ru@Pt1.8MLE, Ru@Pt2.1MLE and Ru@Pt2.3MLE; see Figure 5c) matches well with that obtained for Ru@Pt1.4MLE at potentials more anodic than 390 mVRHE. In accordance with this, for Ru@Pt particles with Pt MLE values of ≥1.4, no Ru surface sites can be detected any more. The threshold for completely covering the Ru core with Pt is theoretically expected to be at exactly 1 MLE for monodisperse Ru nanoparticles with a diameter of 1.9 nm, whereas 1.4 MLE was observed experimentally. This minor discrepancy, however, is likely related to the relatively broad particle size distribution of the Ru cores (from 1.2 to 2.6 nm, see Figure 4), as explained in the following. During Ru@Pt synthesis, the Pt ions, as well as the Ru nanoparticles are homogeneously distributed over the entire ethylene glycol solution. Therefore, the availability of PtCl42− ions to reductively deposit on the Ru particle surface is equal for all Ru nanoparticles. Nevertheless, the amount of Pt needed to fully cover a Ru nanoparticle depends strongly on its diameter. A small Ru particle can be easily covered by Pt, whereas the Pt precursor in the vicinity of a larger Ru particle is readily consumed when the reduction process is initiated without closing the monolayered Pt shell. Some of the excess Pt ions next to the small Ru nanoparticle can start to form a second Pt overlayer on it, since the distance to neighboring Ru particles is in some cases larger than that to the already covered nanoparticle. Hence, a Pt precursor concentration sufficient to form 1 MLE on a 1.9 nm Ru core, is not sufficient to cover larger Ru particles completely due to local starvation of Pt ions. Especially for higher Pt ion concentrations in the electrolyte which are required to prepare fully covered Ru nanoparticles, the final catalyst is expected to be a mixture of mono- and multilayered Ru@Pt core-shell nanoparticles. Despite these minor imperfections in the synthesis of Ru@Pt core-shell catalysts, we would like to emphasize that the difference between the ideally expected complete encapsulation of the Ru cores at 1 MLE of Pt and the observed complete encapsulation at 1.4 MLE of Pt is actually reasonably small considering all the experimental uncertainties. Moreover, all CVs provided in Figure 5 correspond to steady-state measurements. The fact that the reductive peak remains absent in all CVs of fully Pt-covered Ru@Pt catalysts is a clear evidence that the core-shell structure remains intact upon potential application in the considered potential window.
With increasing Pt MLE values (i.e., increasing Pt:Ru ratios), anodic and cathodic peaks appear in the potential range from 80 to 250 mVRHE, corresponding to the Hupd process on the Pt shell of Ru@Pt particles. Since the steep increase of the negative current at the most cathodic potential (50 mVRHE) is due to the evolution of hydrogen, the maximum cathodic current at the lower potential limit in the Ar-saturated electrolyte can be used as a first indicator for the activity of the prepared Ru@Pt core-shell nanoparticles toward the HER. As shown in Figure 5c, the cathodic current at the lower potential limit increases with increasing Pt coverage, reaching a maximum at Ru@Pt1.8MLE. At higher Pt:Ru ratios (Ru@Pt2.1MLE and Ru@Pt2.3MLE), the cathodic current at the lower potential limit decreases again, thus indicating that these catalysts are less active towards the HER.
Pt shell composition by CO stripping voltammetry
The thickness of the Pt shell of Ru@Pt core-shell nanoparticles can be determined by oxidation of COads in deaerated liquid electrolyte, as will be outlined below, followed by a discussion of the past findings with regards to the CO stripping behavior on Pt-Ru surfaces. Bimetallic Pt-Ru alloys were used for CO oxidation by various researchers due to their high activity toward this reaction.28–32 Studies on well-characterized alloy surfaces by Gasteiger et al. revealed that the overpotential necessary for the oxidation of COads on Pt-Ru in 0.5 M H2SO4 is more than 200 mV lower compared to pure Pt, depending on the composition of the alloy.28 Similar to others,31,32 Gasteiger et al. attributed this effect to a bifunctional mechanism requiring the participation of both Pt and Ru surface sites in the oxidation process of CO.28 According to the authors, the low overpotential necessary to oxidize CO on Ru frees these surface sites from COads at comparably cathodic potentials. As mentioned earlier, Ru is oxidized at a moderate potential, thus covered by an oxide ad-layer right after the removal of CO from the surface. In the bifunctional mechanism that was proposed by the authors, the oxygen species on Ru aid the oxidation of COads on neighboring Pt sites, hence promote the overall CO oxidation activity. Nevertheless, it remains unclear why the COads oxidation potential on Pt-Ru alloys shifts even more cathodic with respect to that on pure Ru. In an intent to clarify this, Gasteiger et al. proposed that surface-bound oxygen species may cause a lowered overpotential for the oxidation of CO on Pt compared to a pure Ru surface.
Later on, other researchers showed that Ru@Pt core-shell nanoparticles are capable of oxidizing CO at potentials comparable to those found for Pt-Ru alloys in acid electrolyte.13,27,33–35 For example, Ochal et al. reported a significant cathodic shift of the CO stripping peak from 0.8 VRHE on pure Pt to 0.58 VRHE on Ru@Pt in 0.5 M HClO4.33 Similar to Pt-Ru alloys, CO can be oxidized on Ru@Pt core-shell nanoparticles at a lower overpotential compared to pure Ru. The results of these groups indicate that the enhancement of the CO oxidation in the bimetallic Pt-Ru system is due to a modification of platinum's electronic structure by Ru rather than a bifunctional mechanism that involves both metals in the reaction mechanism. This fact also explains the finding by Gasteiger et al. that a low percentage of Ru atoms is sufficient to significantly enhance the oxidation of COads on Pt-Ru alloys compared to pure Pt.28 Furthermore, Ochal et al. reported a second peak in the CO stripping voltammogram at a significantly more anodic potential of 0.76 VRHE and attributed it to small Pt impurities in their Ru@Pt catalyst, even though the potential is different from the COads oxidation potential on pure Pt.33 In 2014, El-Sawy et al. prepared a series of Ru@Pt catalysts with different Pt coverage/Pt shell thickness and utilized CO stripping voltammetry to qualitatively distinguish between Ru@Pt1ML and Ru@Pt2ML.27 They found two peaks related to the oxidation of COads, viz., at 0.62 and 0.78 VRHE in 0.5 M H2SO4, depending on the Pt shell composition of the Ru@Pt particles. In contrast to Ochal et al., El-Sawy et al. identified the two peaks to be associated with CO adsorbed on the first (referred to as COadsA, with a peak potential at 0.62 VRHE) and on the second (referred to as COadsB, with a peak potential at 0.78 VRHE) Pt overlayer of Ru@Pt particles. The different peak potentials for the oxidation of COadsA and COadsB on Ru@Pt can be explained by a different Pt-COads BE on the first compared to that on the second Pt overlayer on Ru. These results are in accordance with those of Schlapka et al., who prepared a series of Pt layers on Ru(0001) with different thickness and determined their respective COads desorption temperatures.25 They reported the lowest COads-desorption temperature for the first Pt overlayer on Ru and ascribed it to the electronic effect of the Ru substrate on Pt. Supported by DFT calculations, they showed that the Pt-COads BE in subsequent Pt overlayers increases significantly, quickly approaching that of pure Pt as its coverage exceeds 2 monolayers.
In the present study, the method developed by El-Sawy et al. is used to determine the thickness of the Pt shell in Ru@Pt particles in 0.1 M H2SO4 and to compare it to the bare Ru core and Pt nanoparticles prepared by the same method (Figure 6a). Ru@Pt particles with a low Pt coverage of 0.3 MLE (black line in Figure 6b) show only a single anodic peak for the oxidation of COadsA on the first Pt layer on Ru. Similar to Pt-Ru alloys,28 no additional peak is found for the oxidation of COads on surface Ru sites for partially Pt covered Ru@Pt particles. Furthermore, no oxidation peak occurs in any of the Ru@Pt catalysts at the oxidation potential of CO adsorbed on pure Pt at 0.81 VRHE (Figure 6a), confirming once more that the synthesis did not yield pure Pt particles in detectable quantities. Increasing the Pt:Ru ratio in the synthesis process towards a full Pt-MLE (Ru@Pt0.5MLE and Ru@Pt0.9MLE) causes the emergence of a second peak at 0.77 VRHE. According to the work of El-Sawy et al.,27 this anodic current is assigned to the oxidation of COadsB on the second Pt overlayer. Catalysts with higher Pt:Ru ratio (Figure 6c) show an increasing COadsB:COadsA ratio, as expected due to the increasing coverage of the first Pt layer (1st monolayer) with an additional Pt overlayer (2nd monolayer). However, here it should be noted that the occurrence of COadsB on Ru@Pt0.9MLE particles which nominally should not yet have a fully Pt covered Ru core is due to the above discussed issue that a nominally 0.9 MLE coverage for not perfectly mono-dispersed Ru cores will lead to the partial formation of a second Pt overlayer on the smaller Ru core particles. The catalyst with the largest Pt:Ru ratio (Ru@Pt2.3MLE) consists nearly exclusively of COadsB, indicated by the very small current in the CO stripping voltammogram which is ascribed to COadsA (i.e., at 0.6 VRHE). While this minor discrepancy between nominal/average and actual Pt coverage will have to be kept in mind in our further analysis, the overall agreement between the expected nominal Pt coverage and the observed Pt coverage distribution (on the order of several tenths of a monolayer) is quite reasonable. The difference of the peak positions for COadsA (≈0.60 vs 0.62 VRHE) and COadsB (0.77 vs 0.78 VRHE) between this study and that of El-Sawy et al.27 may originate in parts from the accuracy of the reference electrode calibration and from slightly varied synthesis routes used to prepare the Ru core. Furthermore, since the differences in the Pt-COads BE becomes smaller as the amount of Pt layers on Ru increases,25 it might be experimentally difficult to resolve a difference between the second vs. the third Pt layer by CO stripping voltammetry.
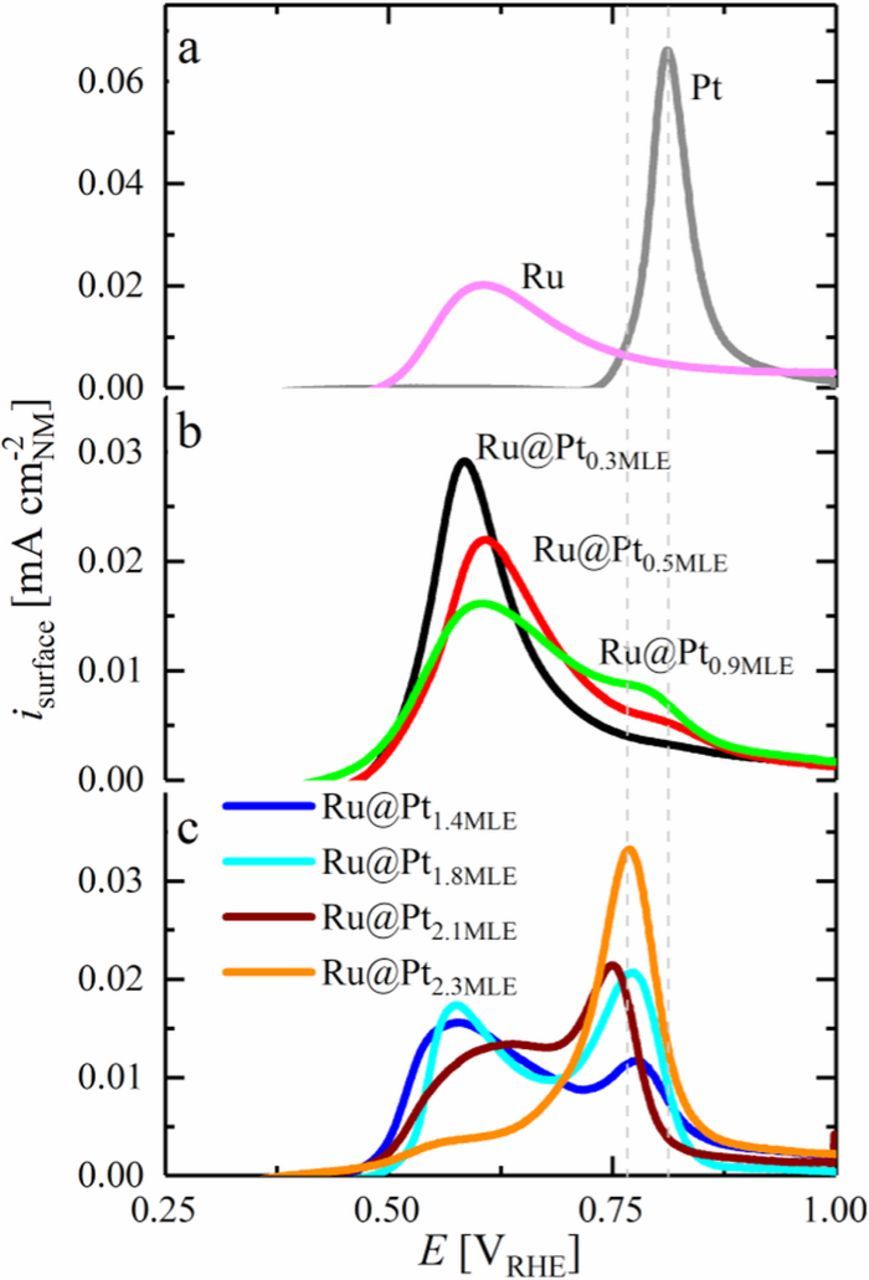
Figure 6. Baseline-corrected, surface normalized CO stripping voltammograms of different Ru@Pt/C, Ru/C and Pt/C catalysts in Ar-saturated 0.1 M H2SO4 at 10 mV s−1. Prior to CO-stripping, CO was adsorbed at 0.06 VRHE for 3 min, followed by purging the solution with Ar for 20 min. Reproduced from Schwämmlein et al. with permission of The Electrochemical Society.22 The dashed gray lines indicate the peak potential for the oxidation of CO on pure Pt (0.81 VRHE) versus the peak oxidation potential for COadsB (0.77 VRHE).
HOR/HER activity in alkaline electrolyte
The kinetics of Ru@Pt core-shell nanoparticles toward the HOR/HER were determined via the well-established RDE method in H2-saturated 0.1 M NaOH, as described in an earlier publication.22 While this technique does not allow the determination of the exchange current density of catalysts with intrinsically high HOR/HER kinetics (e.g., Pt in acid electrolyte) due to limitations by H2 mass-transport resistances,2 it was nevertheless shown that the HOR/HER exchange current densities in the low mA cm-2NM range can be accurately extracted using this technique.3,9 To evaluate the kinetics of Ru@Pt catalysts precisely and reliably, the roughness factor of the used electrodes needs to be as low as possible in order to increase the ratio of kinetic/mass-transport resistance contributions to the observed voltage losses.2 To obtain a low total noble metal content on the electrode, all samples were supported on carbon with a comparably low loading of roughly 8%wt and the film thickness was chosen to be ≈0.6 μm. Accordingly, the prepared coatings had an overall noble metal content of approximately 2 μgNM cm-2geo, corresponding to roughness factors on the order of 1–2 cm2NM cm-2geo as determined by CO stripping. Despite the small film thickness, the quality of the films was sufficient for activity measurements and we did not observe limitations or artifacts due to film quality. Figure 7 shows a representative RDE data set for the HOR/HER in 0.1 M NaOH under pure H2 at 25°C for the Ru@Pt0.3MLE catalyst at 1600 rpm, with a limiting current of ≈2.5 mA cm-2geo, as expected for these conditions3 (essentially identical limiting current densities were obtained for all catalysts). It shall be mentioned at this point, that no difference was observed between subsequent cycles in CVs to determine the HOR/HER activity. This again underlines the previously stated stability of the prepared Ru@Pt core-shell under operating conditions.
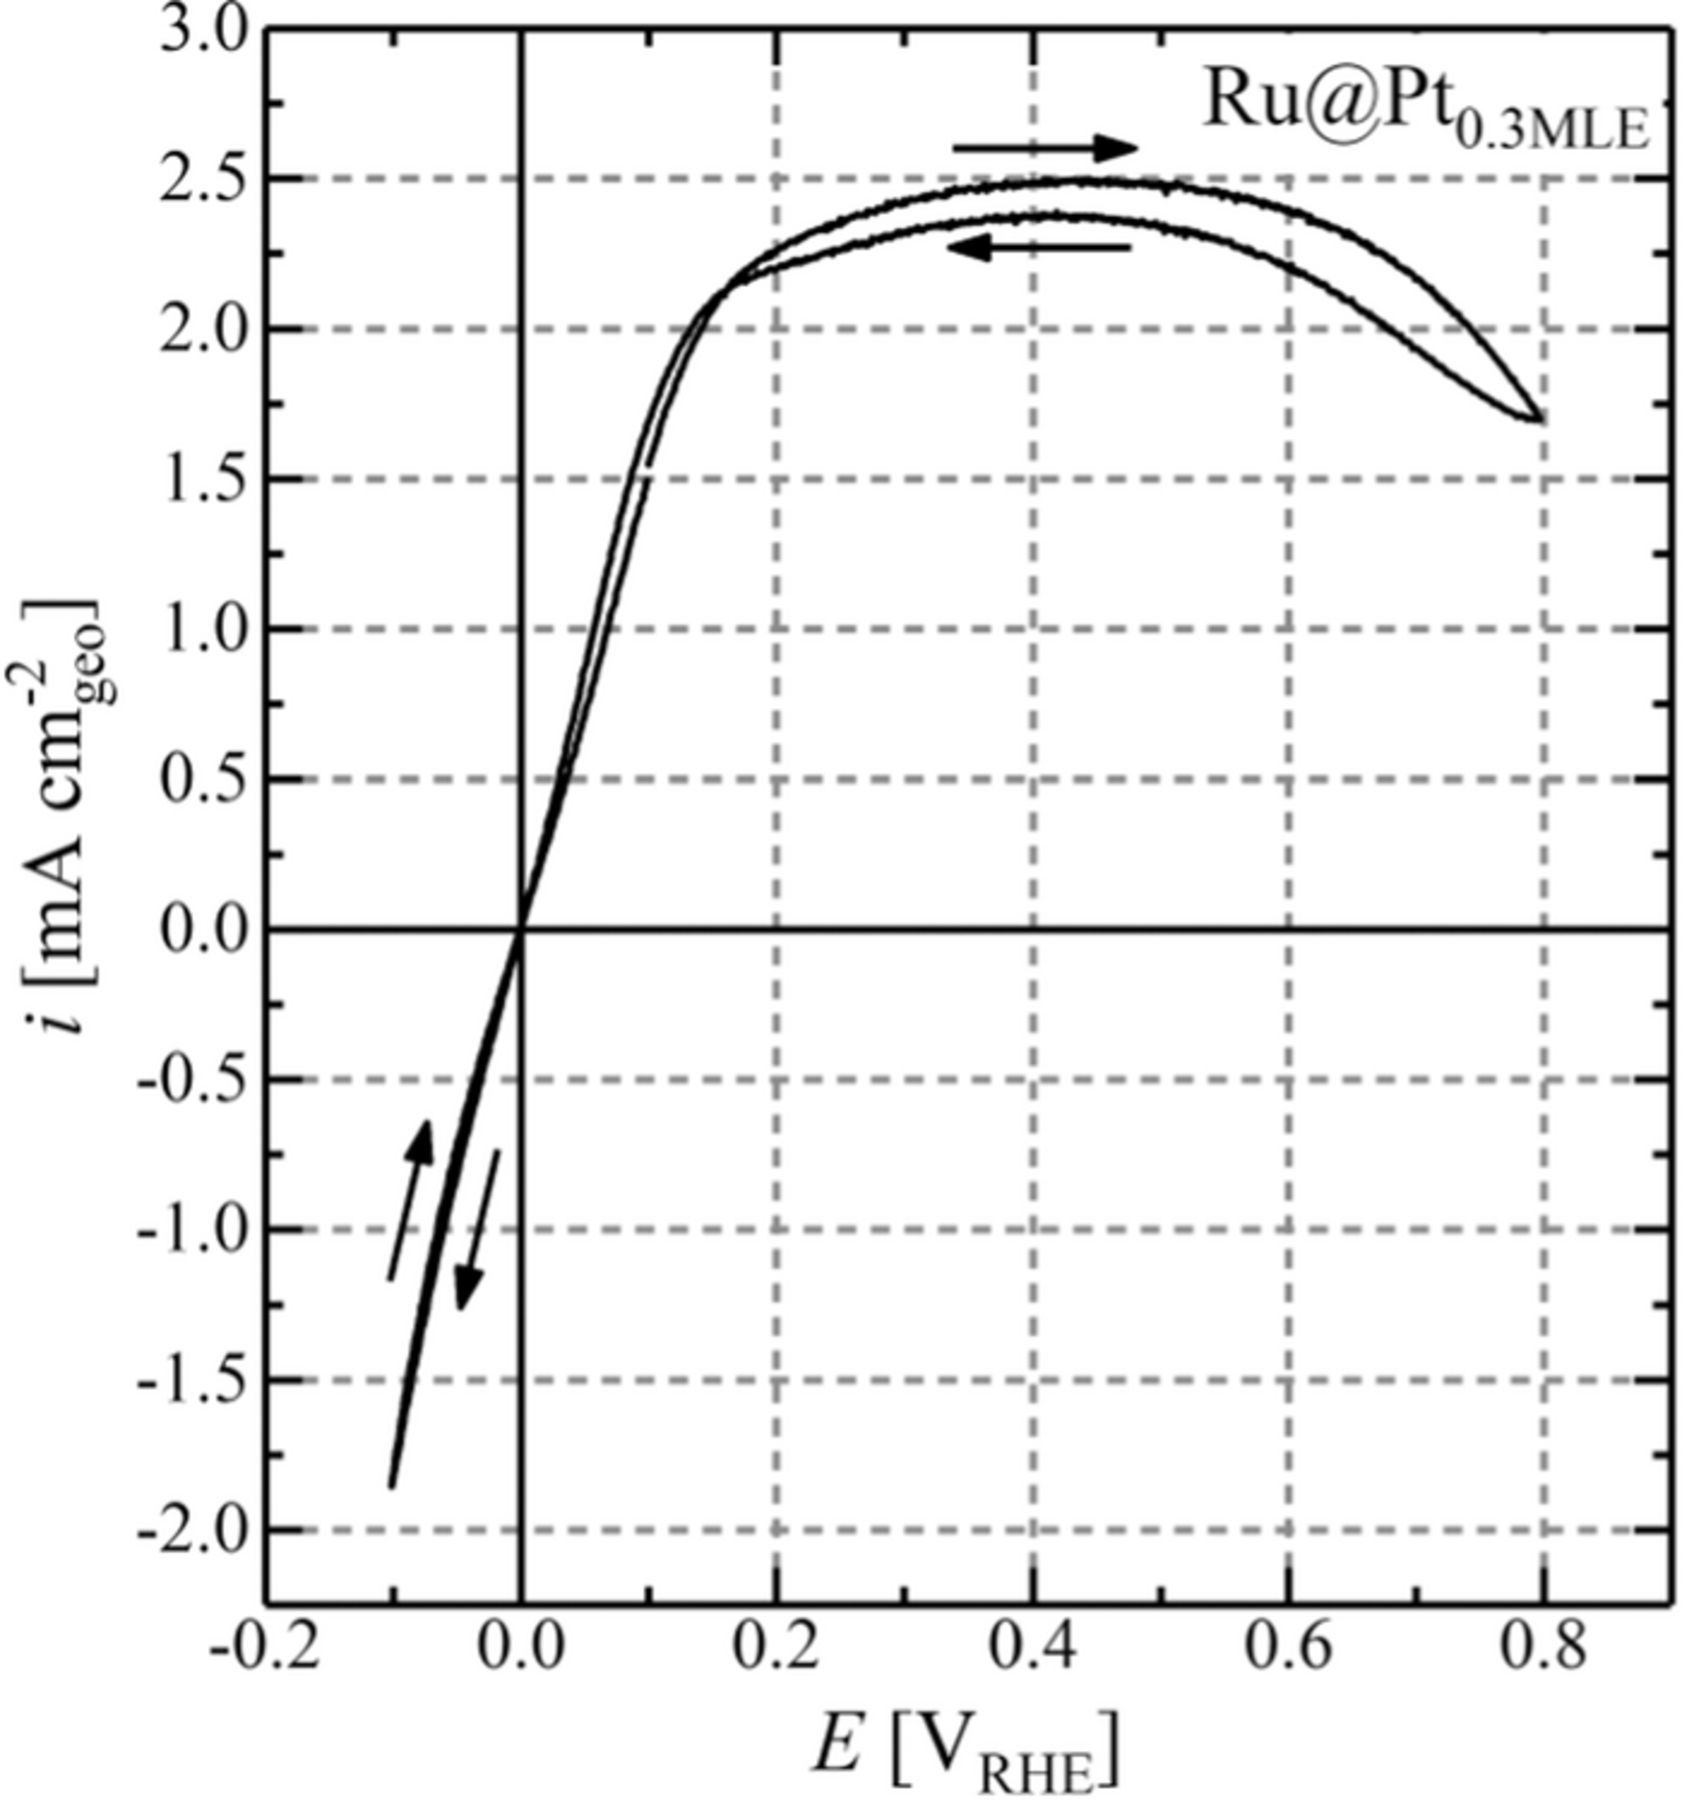
Figure 7. Anodic and cathodic scan (scan direction indicated by arrows in the graph) of a steady-state CV for Ru@Pt0.3MLE/C in H2-saturated 0.1 M NaOH at a scan rate of 10 mV s−1 and a rotation rate of 1600 rpm (25°C). The total metal (Pt+Ru) loading on the disk was 1.28 mgNM cm-2geo. The obtained raw data was solely corrected for the reference electrode potential. The HFR determined via EIS was 40.2 Ω.
For the determination of the exchange current density, we followed the same approach as Rheinländer et al.,3 assuming that the HOR/HER kinetics on Ru@Pt follow the Butler-Volmer relation:
![Equation ([7])](https://content.cld.iop.org/journals/1945-7111/165/5/H229/revision1/d0007.gif)
with the kinetic current ikin, the exchange current density i0 (in A cm-2NM), the roughness factor rf, the Faraday Constant F, the reaction overpotential η, the ideal gas constant R, the temperature T, and the anodic/cathodic transfer coefficients αa and αc, respectively. For small overpotentials, in the so-called micro-polarization region, the Butler-Volmer equation can be simplified using the mathematical approximation ex ≈ 1 + x to obtain the following equation:
![Equation ([8])](https://content.cld.iop.org/journals/1945-7111/165/5/H229/revision1/d0008.gif)
This linearized form of the Butler-Volmer equation can be helpful to determine the exchange current density, whereby it is also here essential that contributions from mass-transport and ohmic resistances to the measured current density have been accounted for, i.e., that the modeled current truly represents the kinetic current. The disadvantage of the kinetic analysis in the micro-polarization region (i.e., using Equation 8) is, however, that i0 can only be extracted this way if the sum of alphas (i.e., αa + αc) is known. Quantification of the α-values, on the other hand, requires determination of the Tafel slope (b) at large anodic or cathodic overpotentials, where the exponential term for the reverse reaction can be neglected.
![Equation ([9])](https://content.cld.iop.org/journals/1945-7111/165/5/H229/revision1/d0009.gif)
For HOR/HER on carbon-supported Pt in a PEMFC, anodic and cathodic transfer coefficients of 0.5 were determined by Durst et al.2 (between 313 and 353 K), corresponding to αa + αc = 1. These α-values suggest that the HOR/HER on Pt in acidic media follows the simplest possible electrochemical case of a single-electron transfer process as rate-limiting step. This assumption holds also true for the HOR/HER in alkaline electrolyte according to Sheng et al.4 and Rheinländer et al.3 who determined αa = αc = 0.5 on Pt by the RDE technique. However, depending on the catalytic material, the electrolyte, and the respective reaction, a variety of different Tafel slopes have been reported in literature, e.g., ≈60 mV dec−1 for the ORR on Pt and Pt based alloys in acid.36 For this reason, the value of the transfer coefficients or at least of αa + αc must be determined for a given reaction system (catalyst, electrolyte, reaction) in order to be able to extract exchange current densities from an analysis of the kinetics in the micro-polarization region.
In the following, the sum of alphas for the HOR/HER on Ru@Pt core-shell nanoparticles in alkaline media is identified by fitting the experimentally obtained polarization curve, after the appropriate mass-transport and ohmic resistance corrections, to the Butler-Volmer equation. The Ru@Pt0.3MLE catalyst is used as a model for the series of prepared Ru@Pt catalysts, since its moderate activity enables fitting of the HOR/HER polarization curve to sufficiently high overpotentials, so that Tafel slopes (and thus αa and αc values) can be obtained. Fitting the corrected data of more active Ru@Pt catalysts (e.g., Ru@Pt1.8MLE) to the Butler-Volmer equation cannot be carried out in a trustworthy fashion, since their high activity, even at low rf values, yields high current densities at already small overpotentials, so that mass-transport resistance free, kinetic currents cannot be extracted at overpotentials which would be high enough to obtain a meaningful transfer coefficient. Here it should be noted that due to the approximate nature of the RDE transport corrections, it is not sensible to extract kinetic data in a region where the measured and the transport-limited current are very similar; therefore, our kinetic data were only extracted for measured currents which are not larger than 80% of the transport-limited current, as suggested by Rheinländer et al.3 To obtain the true HOR/HER kinetic currents from the raw data shown in Figure 7, several mass-transport and ohmic resistance corrections must be applied. Here, we will follow the approach taken by Rheinländer et al.,3 which will be outlined briefly below.
To account for the effects of concentration gradients on the HOR/HER kinetics, the measured current needs to be modified according to Equation 10.3
![Equation ([10])](https://content.cld.iop.org/journals/1945-7111/165/5/H229/revision1/d0010.gif)
where the measured current is imeas, where the diffusion limited current is ilim, and where the reaction order of the HOR/HER is m. This equation assumes the presence of a concentration gradient, which in the case of the HOR branch of the polarization curve is caused by the depletion of dissolved H2 near the electrode surface. However, in the case of the HER branch, this correction would only be valid, if supersaturation of H2 in the electrolyte would occur (OH- or H2O transport are not limiting at the typically used current densities in RDE experiments), which was shown to not be the case;3 therefore, currents in the HER branch are corrected by Equation 10. For poly-crystalline Pt, the dependency of the exchange current density on the H2 concentration was reported by Rheinländer et al.3 and in accordance with their results, m = 0.5 was used for all calculations in this study. To obtain the potential at the electrode/electrolyte interface, the resistance of the electrolyte solution in the respective setup needs to be accounted for according to Equation 11:
![Equation ([11])](https://content.cld.iop.org/journals/1945-7111/165/5/H229/revision1/d0011.gif)
The high frequency resistance RHFR used for this calculation was determined individually for every experiment by electrochemical impedance spectroscopy (the value of RHFR was on the order of ≈45 Ω). Lastly, the measured potential needs to be corrected for the shift of the reversible potential for the HOR/HER caused by the current-dependent depletion of the H2 concentration in the vicinity of the electrode (again, this correction will only be applied to the HOR branch, as we assume that there is no supersaturation of dissolved H2 in the HER branch3).
![Equation ([12])](https://content.cld.iop.org/journals/1945-7111/165/5/H229/revision1/d0012.gif)
The cathodic-going scan of the steady-state polarization curve collected for Ru@Pt0.3MLE in H2-saturated alkaline electrolyte was treated accordingly and the absolute value of the HOR/HER current density was plotted on a logarithmic current scale (black crosses in Figure 8) versus Eηdiff − freeiR − free. As mentioned above, this analysis performed for Ru@Pt0.3MLE serves as a model for all prepared Ru@Pt catalysts in this study, since its moderate activity compared to the other Ru@Pt catalysts simplifies the fitting up to larger overpotentials with small error.
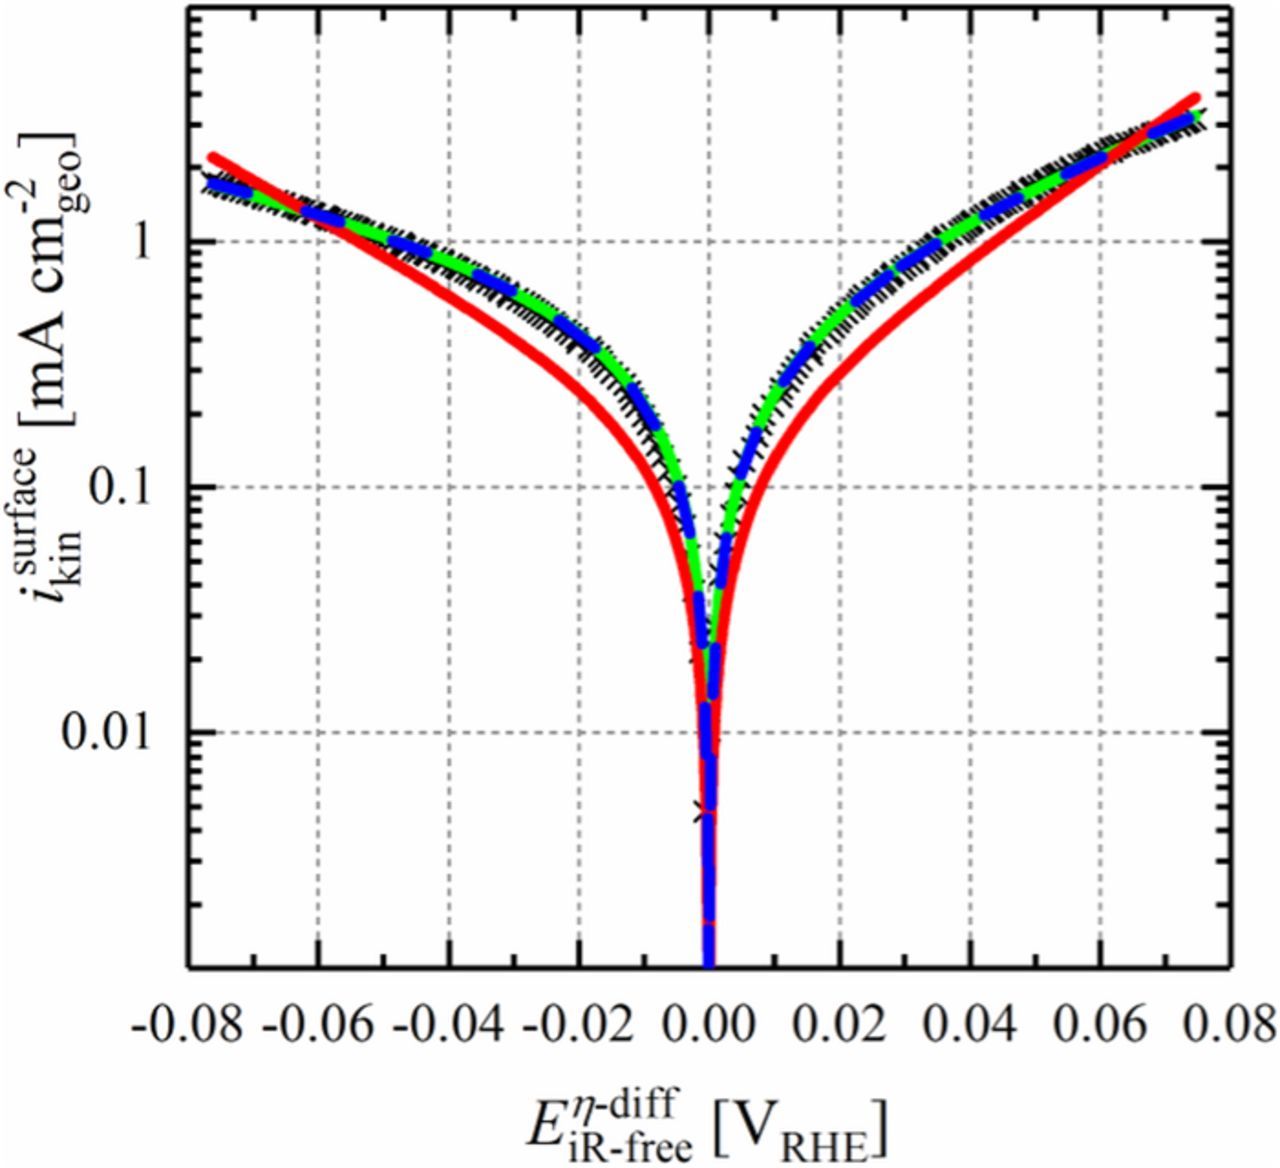
Figure 8. Tafel plot showing the kinetic currents in the cathodic-going scan (black crosses) for the HOR/HER on Ru@Pt0.3MLE core-shell nanoparticles in H2-saturated 0.1 M NaOH at a scan rate of 10 mV s−1 and a rotation rate of 1600 rpm. All experiments were conducted at 298 K and ambient pressure. The potential was corrected for the solution resistance determined by electrochemical impedance spectroscopy (see Eq. 11), as well as for the potential shift due to the diffusion overpotential with respect to the applied current (see Eq. 12). The measured current in the HOR branch was corrected according to Equation 10. The experimentally obtained data were fitted to the Butler-Volmer equation (Equation 7) by: a) fixing the sum of alphas to 1 (green line); b) fixing the sum of alphas to 2 (red line); and, c) treating αa and αc as freely variable individual parameters (blue dashed line).
These kinetic data were then fitted to the Butler-Volmer equation (fitting as logarithm of the current vs. the corrected potential) in three different ways by fixing a) αa + αc = 1 (green line), b) αa + αc = 2 (red), and, c) treating αa and αc as individual free parameters without constraints (blue). For Ru@Pt0.3MLE, fixing αa + αc = 1 resulted in an excellent fit of the measured data (green line in Figure 8) with r2 = 0.983 and α-values of αa ≈ 0.6 and αc ≈ 0.4, indicating that the HOR possibly proceeds at a slightly faster rate than the HER on the tested catalyst. Nevertheless, these values represent a more or less symmetric HOR/HER reaction similar to pure poly-crystalline Pt.3 No meaningful fit was obtained for αa + αc = 2 (red line), suggesting that the HOR/HER does not occur by a simultaneous two-electron transfer on Ru@Pt. As a proof of concept, αa and αc were also fitted as individual independent parameters (blue dashed line), yielding a fit which superimposes with that for which αa + αc = 1 was pre-defined, and also yielding values of αa ≈ 0.6 and αc ≈ 0.4. A HOR/HER exchange current density of i0298K = 0.57 mA cm-2NM was obtained by the fit where the sum of alphas was fixed to 1, hence comparable to that of pure Pt (i0313K = 1.0 mA cm-2Pt;10 i0293K = 0.55 mA cm-2Pt;3 i0294K = 0.57 mA cm-2Pt;4 i0313K = 1.78 mA cm-2Pt;9). Summarizing the above analysis, we can state that the sum of alphas for the Ru@Pt core-shell nanoparticles is clearly 1, which enables an extraction of the exchange current density also from the micro-polarization region according to Equation 13.
![Equation ([13])](https://content.cld.iop.org/journals/1945-7111/165/5/H229/revision1/d0013.gif)
Thus, the exchange current density can be obtained directly by plotting the kinetic current versus the ηdiff and iR-corrected potential between -5 and 5 mVRHE. The linear fit of the data crosses the y-axis at i = 0 and the slope yields i0 for the HOR/HER, since all other parameters in Equation 13 are known. Again, for the analysis of the measured data, we did not correct the HER-branch for ηdiff.3
The evaluation of the micropolarization region yielded a HOR/HER exchange current density of i0298K = 0.47 ± 0.01 mA cm-2Pt for pure Pt (Figure 9a), which is in reasonable agreement with those reported by other groups.3,4,9,10,38,39 It was also reported before, that the HOR/HER activity of pure Ru in alkaline environment is rather poor and the current ceases quickly as the oxide is formed on the metallic surface.17 Covering Ru with a fraction of a Pt-ML (Ru@Pt0.3MLE) increases the HOR/HER current significantly compared to pure Ru (Figure 9b), and a decrease of the HOR current density due to oxide formation is not noted until >0.4 V (see Figure 7). Similar to the exchange current density obtained by fitting the data to the Butler-Volmer equation, evaluation of the micro-polarization region yields an exchange current density of i0298K = 0.54 ± 0.12 mA cm-2NM (using Equation 13), consistent with the above presented fitting procedure. The HOR/HER exchange current densities obtained from the micro-polarization region for all of the here tested materials as well as for some comparable materials from the literature are summarized in Figure 10 (normalized to the total metal surface area (a), the total mass of noble metal (b), or the mass of Pt (c)). The high HOR/HER activity of Ru@Pt0.3MLE despite the small amount of Pt in this catalyst confirms reports on the beneficial effect of Pt adatoms on a Ru surface with respect to the HOR/HER activity.16 Furthermore, the high activity of the Ru@Pt0.3MLE catalyst is similar to that reported for both partially covered Ru@Pt core-shell nanoparticles and Pt-Ru alloys.17,18,37 It is especially noteworthy that the total surface area normalized exchange current density for the Ru@Pt0.3MLE catalyst with only ≈30% Pt coverage (the absence of bi-layered Pt is supported by the above CO stripping analysis) is essentially the same as that of pure Pt (solid black square vs. solid gray asterisk is Figure 10a), demonstrating that each Pt surface atom in the Ru@Pt0.3MLE catalyst is ≈3-4 times more active than Pt surface atoms in pure Pt.
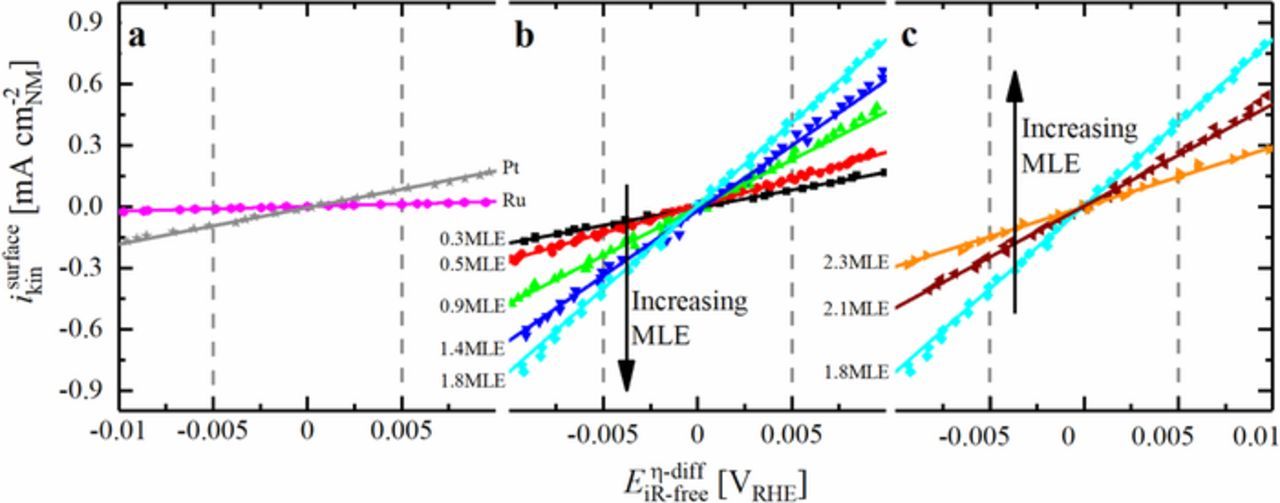
Figure 9. Cathodic-going scans (points), including linear fits (lines) in the micro-polarization region for different Ru@Pt/C, Ru/C and Pt/C catalysts at 10 mV s−1 in H2-saturated 0.1 M NaOH at 1600 rpm. All measurements were carried out at 298 K, corrected for the ohmic drop and normalized to the total noble metal surface obtained from CO stripping voltammetry in NaOH. a) Reference catalysts, b) catalysts with increasing and c) decreasing HOR/HER activity. The most active catalyst (Ru@Pt1.8MLE) is shown in b) and c). Reproduced from Schwämmlein et al. with permission of The Electrochemical Society.22
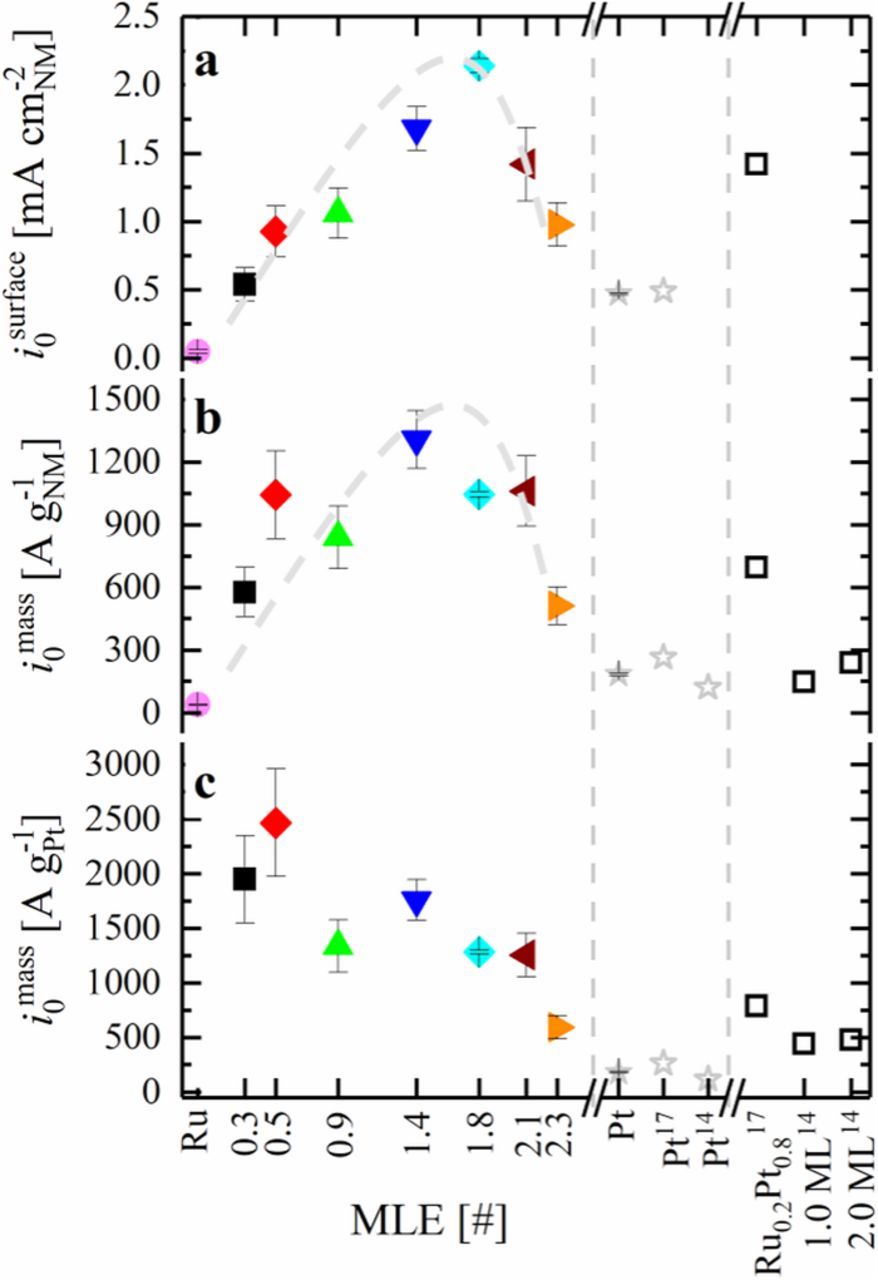
Figure 10. HOR/HER activity, obtained by linear fitting in the micro-polarization region (Eq. 13) for Ru@Pt/C with varying Pt-shell thickness, Ru/C and Pt/C catalysts in 0.1 M NaOH with respect to a) surface area of noble metals obtained by CO stripping, b) total mass of noble metals and c) mass of Pt. Hollow symbols show data published in the literature (the respective article references are marked by the superscripts). All values are based on at least three independent measurements of different coatings of the same catalyst, while error bars indicate the standard deviation of the individual values. The gray dashed line in a) is simply a guide-to-the-eye line.
Increasing the Pt:Ru ratio leads to an increase of the surface normalized HOR/HER activity of Ru@Pt catalysts, with a maximum exchange current density of 2.14 ± 0.05 mA cm-2NM for Ru@Pt1.8MLE (light blue diamond in Figure 10a), that has a fully closed Pt shell. This is in good agreement with the statement that Pt is roughly 4 times more active if it is deposited on Ru compared to a pure Pt particle (i0298K = 0.47 ± 0.01 mA cm-2Pt; solid gray asterisk in Figure 10a). The HOR/HER activity of catalysts with larger Pt:Ru ratio (Ru@Pt2.1MLE and Ru@Pt2.3MLE) decreases with respect to the most active Ru@Pt catalysts (see Figure 1a). The fact that a fully Pt covered Ru core, where Ru is not exposed to the surface of the particle, has the highest HOR/HER exchange current density if normalized to the total metal surface area in conjunction with the absence of a HOR/HER activity drop after the completion of the first Pt overlayer (i.e., for Ru@Pt catalysts with Pt-MLE ≥ 1.4) clearly proves that the participation of Ru as active surface site in the catalysis of the HOR/HER is not the major reason for the high activity of the bimetallic Pt-Ru system. Hence, the presented data reveal that the HOR/HER on bimetallic Pt-Ru catalysts does not follow a bifunctional mechanism and that the activity enhancement with respect to Pt must be caused by an electronic effect of Ru on Pt.
In addition to this finding, it is of great interest to identify whether the first or the second Pt overlayer on Ru is most active towards the HOR/HER. However, CO stripping showed that the most active catalyst of this study (Ru@Pt1.8MLE) is composed of a mixture of mono- and multilayered Pt on Ru. Nevertheless, the low activity of Ru@Pt2.1MLE (i0 = 1.4 ± 0.3 mA cm-2NM) and Ru@Pt2.3MLE (i0 = 1.0 ± 0.2 mA cm-2NM) compared to Ru@Pt1.8MLE (2.1 ± 0.1 mA cm-2NM) indicates that the first Pt overlayer on Ru is more active than subsequent ones, since especially Ru@Pt2.3MLE is basically exclusively composed of multilayered Pt on Ru with a very small fraction of monolayered Pt. Also Schlapka et al. reported that the electronic effect of Ru on a Pt overlayer is strongest for the first layer, followed by the second one and largely vanishes for more than three layers.25 While they studied the temperature dependent desorption of COads from the Pt surface, a very different process compared to the HOR/HER reactions studied in this publication, the lower overpotential needed for both processes on Pt-Ru compared to Pt seems to be caused by a downshift of the platinum d-band center by nearby Ru atoms and an associated lower binding energy toward the adsorbate. In comparison with the HOR/HER exchange current density of Pt-Ru alloys in alkaline media, e.g., an Ru0.2Pt0.8 alloy prepared by St. John et al., Ru@Pt1.8MLE core-shell nanoparticles exhibit slightly superior activity, while both systems are within a similar range (Figure 10a).17 This provides further evidence that the activity enhancement of Pt-Ru alloys towards the HOR/HER in alkaline media is due to an electronic effect of Ru on Pt, similar to that hypothesized above for our Ru@Pt core-shell nanoparticles. The fact that the HOR/HER surface area normalized activity of Ru@Pt is slightly superior to that of an alloy may originate from the missing Ru surface sites in a core-shell nanoparticles since Ru contributes to the total noble metal surface area while having a low HOR/HER activity. All in all, this shows the advantage of a core-shell configuration compared to a bimetallic alloy with respect to the catalytic activity.
Normalizing the measured HOR/HER activity to the mass of Pt or to the total mass of noble metal can provide further insights into the catalysts properties and the distinction between a bifunctional mechanism and an electronic effect, whereas the analysis of this data is somewhat more complex. In an idealized scenario, Pt would grow homogeneously on perfectly monodispersed Ru cores and a second Pt layer would form only after the first Pt monolayer is completed. For such idealized surfaces and for a reaction mechanism based on an electronic effect, the HOR/HER activity normalized to the mass of platinum of the Ru@Pt core-shell particles (in A g-1Pt) would be expected to be identical for all catalysts composed of a partial up to a full Pt monolayer on Ru, since the activity per Pt surface atom in the first monolayer would be constant. Upon formation of a second Pt layer, the Pt mass activity would have to decrease, since the Pt atoms in the first monolayer, which are covered, cannot contribute to the HOR/HER, whereas their mass is taken into account for the normalization. In addition, based on the low HOR/HER activity of Ru@Pt2.1MLE (i0 = 1.4 ± 0.3 mA cm-2NM) and Ru@Pt2.3MLE (i0 = 1.0 ± 0.2 mA cm-2NM) shown in Figure 10a, Pt atoms in the second layer are significantly less active compared to those in the first layer, enhancing the activity decrease when a second Pt overlayer is being formed on the first one. Assuming that the electronic effect decreases further in the third Pt layer, an additional activity decrease with respect to the mass of Pt is expected for multilayered Ru@Pt catalysts. Comparing this idealized scenario to the data shown in Figure 10c, the two catalysts with the lowest Pt coverage (Ru@Pt0.3MLE and Ru@Pt0.5MLE) show the highest Pt mass activity for the HOR/HER in this study (i0 = 1950 ± 400 A g-1Pt and i0 = 2470 ± 490 A g-1Pt). Furthermore, the activity of these catalysts is reasonably similar with respect to the error of the measurement, as expected for submonolayer Ru@Pt catalysts. In contrast to this, the activity of Ru@Pt0.9MLE is considerably lower (i0 = 1340 ± 240 A g-1Pt), even though for a purely electronic effect an equally high Pt mass activity would have been expected for this catalyst with a nominal MLE of less than 1. At this point, however, the imperfection of the synthesis process needs to be taken into account, i.e., the polydisperse particle size distribution of the Ru core causes a partial growth of the second Pt layer on the Ru@Pt0.9MLE catalyst before the first overlayer is completed (refer to green lines in Figures 5b and 6b). According to the above given rationale, the growth of a second Pt layer leads to a significant decrease of the Pt mass activity, which we believe is the reason for the observed low Pt mass activity of the Ru@Pt0.9MLE. catalyst. Since the Ru core is not fully covered by Pt in the Ru@Pt0.9MLE catalyst, the overall Pt mass activity can be increased by covering the remaining uncovered Ru sites, hence increasing the amount of monolayered Pt atoms in the catalyst compared to bilayered Pt atoms. Accordingly, a slightly larger exchange current density normalized to the mass of Pt was found for Ru@Pt1.4MLE (i0 = 1760 ± 190 A g-1Pt), which is the first catalyst in the series that does not expose Ru on its surface (blue line in Figure 5b). As the MLE increases further, the first Pt layer gets gradually covered, leading to a decrease of the Pt mass activity.
In a similar fashion, an idealized scenario can be developed with respect to a normalization of the HOR/HER activity by the total mass of noble metal (A g-1NM), i.e., Pt + Ru. On the one hand, the activity is expected to increase with the amount of Pt deposited on Ru for (sub-)monolayer Ru@Pt catalysts, since the fraction of active Pt compared to inactive Ru increases. Hence, the maximum activity with respect to the total noble metal content should be found for a Ru particle which is fully encapsulated by a Pt monolayer. On the other hand, an activity decay takes places when the growth continues and bilayered Ru@Pt forms, according to the same reasoning described earlier: the second layer is less active and covers the first one, thus hindering its participation in the HOR/HER while contributing to the total weight of the catalyst. Compared to a normalization to the Pt mass alone, the activity decrease due to the formation of the second overlayer is expected to be less pronounced when normalizing to the total mass of noble metal, since the constant weight of the Ru core is also taken into account. As a consequence, the activity trend is expected to be similar to that in Figure 10a, where the exchange current density is normalized to the total surface area of the catalyst. We essentially find this, when looking at Figure 10b (i0 in A g-1NM), with the difference that the maximum is found for Ru@Pt1.4MLE (1309 ± 138 A g-1NM) instead of Ru@Pt1.8MLE (1045 ± 14 A g-1NM), what we tentatively ascribe to a minor fraction of multilayered Pt in Ru@Pt1.8MLE. Similar to the emergence of the second Pt overlayer on the first one, the third layer renders the Pt that it covers inactive since it is not exposed on the surface, eventually causing a slight decrease of the overall activity. It is stated here as a reminder, that the "hidden" Pt layers are not taken into account when normalizing the activity to the total surface of the catalyst, as Ru and Pt atoms that are not exposed will not participate in the CO stripping.
To summarize, the presented data conclusively shows that the actual origin of the high HOR/HER activity in the bimetallic Pt-Ru system is mainly due to an electronic effect rather than a bifunctional mechanism, rationalized by the observation that the most active catalysts (Figure 10a, blue triangle and turquoise diamond) with respect to the surface area (mA cm-2NM) do not expose Ru on their surface (Figure 5b, blue and turquoise lines). Compared to the only other study on the HOR/HER activity of Ru@Pt core-shell nanoparticles in alkaline media by Elbert et al. (Figures 10b and 10c, hollow, black squares), the most active catalyst in this study shows a more than fivefold higher activity with respect to the total mass of noble metal (1309 ± 138 A g-1NM for Ru@Pt1.4MLE compared to 240 A g-1NM for Ru@Pt2ML) as well as with respect to the mass of Pt (2466 ± 493 A g-1Pt for Ru@Pt0.5MLE compared to 480 A g-1Pt for Ru@Pt2ML) in Ru@Pt catalysts, while the activity of the Pt reference reported by Elbert et al. (Figure 10c, hollow, gray asterisk) is only 30% lower (120 A g-1Pt vs. 182 ± 7 A g-1Pt) than that reported here (Figure 10c, filled, gray asterisk).14
Conclusions
The evaluation of the HOR/HER activity of Ru@Pt core-shell catalysts with varying Pt shell thickness in H2-saturated 0.1 M NaOH by RDE voltammetry provided fundamental insights into the HOR/HER in alkaline media. By comparing the surface normalized HOR/HER activity of partially covered Ru@Pt particles with fully Pt encapsulated Ru, the bifunctional mechanism involving Ru as active site in the HOR/HER mechanism was found to be of minor importance compared to the modification of the electronic properties of Pt by Ru. A comparison of the Ru@Pt core-shell nanoparticles prepared in this study with the HOR/HER activity Pt-Ru alloys from the literature revealed the transferability of this concept to the bimetallic Pt-Ru system. Even though, we cannot disentangle between a variation of the Pt-Hads BE and other electronic effects that influence the catalytic properties of Pt, the results presented here clearly show that a bifunctional mechanism cannot explain the high HOR/HER activity of the bimetallic Pt-Ru system. Recent results by Li et al. indeed suggest that a variation of the Pt-Hads BE may not be the governing effect with respect to the HOR/HER reactivity in alkaline media.40 Nevertheless, the so-called "experimental prove" for a bifunctional mechanism given by this group, that Ru sites on the surface of Pt-Ru alloys are at least partially covered with oxidic species in the potential range relevant for HOR/HER must not intrinsically be related to a bifunctional mechanism, since the role of these species in the actual catalytic mechanism remains unclear. In conclusion, and based on the presented results, we suggest that the close vicinity of Ru and Pt promotes the HOR/HER in alkaline due to a variation of the electronic structure of Pt, which can e.g., relate to the lowering of the hydrogen adsorption barrier, proposed by Ledezma-Yanez et al.19
Acknowledgment
At first, the work of the micro-analytical laboratory at TUM is acknowledged for the spent effort to obtain the desired elemental analysis quickly and reliably, especially by Ulrike Ammari. The work on TEM images and SED patterns by Marianne Hanzlik is also appreciated, as well as the work of Anqi Li to synthesize an early stage of the catalyst. Financial support in the frame of the CATAPULT project (FCH JU, GA 325268) is acknowledged.
ORCID
Jan N. Schwämmlein 0000-0001-8902-4508
: Appendix
The calculation of the MLE of Pt on the Ru core is based solely on the basic physical properties of the two metals. First of all, the radius of the Ru@Pt core-shell particle (rRu@Pt) is the radius of the Ru core (rRu,particle) plus the radius of the Pt shell composed of twice the radius of a Pt atom (rPt,atom) per MLE.
![Equation ([A1])](https://content.cld.iop.org/journals/1945-7111/165/5/H229/revision1/d0014.gif)
The volumes of Ru (VRu) and Ru@Pt (VRu@Pt) can be calculated assuming spherical particles.
![Equation ([A2])](https://content.cld.iop.org/journals/1945-7111/165/5/H229/revision1/d0015.gif)
![Equation ([A3])](https://content.cld.iop.org/journals/1945-7111/165/5/H229/revision1/d0016.gif)
The volume of Pt (VPt) is simply the difference between the two volumes.
![Equation ([A4])](https://content.cld.iop.org/journals/1945-7111/165/5/H229/revision1/d0017.gif)
Furthermore, the amount of substance of Ru (nRu) and Pt (nPt) can be calculated from the respective volumes, densities (ρRu, ρPt) and molar masses (MRu, MPt).
![Equation ([A5])](https://content.cld.iop.org/journals/1945-7111/165/5/H229/revision1/d0018.gif)
![Equation ([A6])](https://content.cld.iop.org/journals/1945-7111/165/5/H229/revision1/d0019.gif)
The ratio of the molar masses yields the following equation:
![Equation ([A7])](https://content.cld.iop.org/journals/1945-7111/165/5/H229/revision1/d0020.gif)
Inserting Equations A1–A4 into Equation A7 and solving for MLE finally yields Equation 4.