
Abstract
The influence of the amount of Pt deposited onto Rh and Ru nanoparticles on the oxidation of methanol and ethanol has been compared in H2SO4(aq) at ambient temperature and in a proton exchange membrane (PEM) cell at 80 °C. In H2SO4(aq), Rh@Pt and Ru@Pt show similar enhancements in activities over Pt for both methanol and ethanol oxidation. However, differences in the optimum Pt coverage indicate that compression of the Pt lattice by Rh plays a dominate role, while ligand effects are more important for Ru@Pt. In the PEM cell, the Ru core enhanced activities significantly for both methanol and ethanol, while activities were suppressed by the Rh core. This may arise from dominance of ligand and/or bifunctional effects for the Ru@Pt catalyst at 80 °C. Data from the PEM cell showed that the stoichiometry for ethanol oxidation at Ru@Pt was higher than for Rh@Pt, indicating a higher selectivity for the complete oxidation to CO2.
Export citation and abstract BibTeX RIS

This is an open access article distributed under the terms of the Creative Commons Attribution 4.0 License (CC BY, http://creativecommons.org/licenses/by/4.0/), which permits unrestricted reuse of the work in any medium, provided the original work is properly cited.
Catalysts based on deposition of a catalytic metal such as Pt onto nanoparticles of a 2nd metal (M@Pt) are becoming increasingly important in electrocatalysis because they provide control and flexibility in surface composition and structure, while allowing modulation of ligand and strain effects.1 Structures with Pt rich surfaces have been found to be most active for the electrochemical oxidation of organic fuels, with the use of PtRu alloys being well-developed (and commercialized) and Ru@Pt structures attracting increasing attention.2,3 More recently, PtRh alloys have become important in studies of the oxidation of ethanol in particular, since Rh has been found to promote cleavage of the C–C bond and increase selectivity for complete oxidation to CO2.4,5 The development of catalysts with high selectivity for the complete oxidation of ethanol is crucial for the development of direct ethanol fuel cells (DEFC),6,7 and production of hydrogen via ethanol electrolysis (electrochemical reforming).8–10
Ru@Pt catalysts are more active than Pt alone, at lower potentials, for the oxidation of methanol,11–17 ethanol,15,17–19 and formic acid.19,20 This has been attributed to a combination of electronic (ligand) effects, lattice strain,11,13 and the bifunctional (Langmuir–Hinshelwood) effect14 of surface oxides.16,18–21 Ru@Pt nanoparticles can provide enhanced performances in anode catalysts for fuel cells relative to Pt12,22 and alloyed PtRu.23
Rh@Pt catalysts have been shown to provide higher activities than Pt for CO,18,24,25 formic acid,25,26 and ethanol18,27–29 oxidation. It has been shown by X-ray absorption spectroscopy (XANES)18 and X-ray photoelectron spectroscopy26 that the Rh core lowers the d-band center, and this has been attributed to both ligand (electron transfer from Pt to Rh) and lattice compression (strain) effects. This decreases the strength of CO adsorption, allowing its oxidation at lower potentials. Since adsorbed CO (COad), is an intermediate in both formic acid and ethanol oxidation, this facilitates their oxidation at lower potentials. A similar effect would be expected for methanol oxidation.
The primary purpose of the work reported here was a systematic study of the effects of shell thickness on the oxidation of ethanol at Rh@Pt and Ru@Pt nanoparticle catalysts. Varying the shell thickness modulates the strength of ligand, strain, and bifunctional effects,11,16,20,24–26,30 while comparisons with data for methanol at Rh@Pt are included to provide further information on how these effects influence adsorption, C-C bond breaking, and the role of COad. Data for methanol oxidation under similar conditions at Ru@Pt/C catalysts prepared in the same way have been previously reported.16 Previous reports20,25 have also documented CO and formic oxidation at the catalysts employed in this work, and provide a guide for understanding the roles of the Ru and Rh cores in the oxidation of methanol and ethanol.
In addition to these fundamental studies, selected catalysts were evaluated in a proton exchange membrane (PEM) electrolysis cell at 80 °C. This provides crucial information on the suitability of Ru@Pt and Rh@Pt catalysts for use in fuel and electrolysis cells, and insight into how the influences of ligand, strain, and bifunctional effects differ at elevated temperature with a PEM electrolyte. For ethanol oxidation, it also provides crucial information on the selectivity of catalysts for breaking the C–C bond.31
Experimental
Materials
Carbon supported Ru@Pt/C and Rh@Pt/C catalysts were prepared and characterised as previously described.20,25 The same batches were employed in this work. Their characteristics are summarized in Table I. The measured compositions of the Ru@Pt and Rh@Pt nanoparticles (Rux@Pty and Rux@Pty) are given in the first column, where x and y are the mole fractions of Ru or Rh and Pt, respectively. Together with the measured sizes of the Ru and Rh cores, this allows calculation of the thickness of the Pt shell,24 which is given in monolayers of Pt (ML). In all cases the metal loading on the Vulcan XC-72 carbon (Cabot Corp.) support was 40 mass%.
Table I. Measured M:Pt atomic ratios, particles sizes, and estimated Pt coverages (in Pt monolayers) for carbon-supported M/C, M@Pt/C and Pt/C catalysts (M = Ru or Rh).20,25
| Measured composition | Particle diameter (nm) | ||
|---|---|---|---|
| Calculated | Measured by TEM | Thickness of the Pt shell (ML) | |
| Ru | 2.1 ± 0.30 | ||
| Ru72@Pt28 | 2.31 | — | 0.4 |
| Ru62@Pt38 | 2.44 | 2.45 ± 0.30 | 0.6 |
| Ru54@Pt46 | 2.58 | 2.65 ± 0.25 | 0.9 |
| Ru41@Pt59 | 2.72 | 2.91 ± 0.25 | 1.3 |
| Ru30@Pt70 | 3.05 | — | 1.9 |
| Rh | 4.5 ± 0.9 | ||
| Rh72@Pt28 | 4.7 | 4.0 ± 1.4 | 0.9 |
| Rh60@Pt40 | 5.0 | 5.3 ± 2.1 | 1.4 |
| Rh54@Pt46 | 5.2 | 4.6 ± 1.9 | 1.8 |
| Rh46@Pt54 | 5.4 | 5.5 ± 1.8 | 2.4 |
| Rh40@Pt60 | 5.7 | 5.6 ± 1.9 | 2.7 |
| Pt | 4.1 ± 0.7 | ||
—not measured.
Methanol (99.8%; ACP Chemicals Inc.), anhydrous ethanol (99.9%; Commercial Alcohols Inc.), sulfuric acid (Fisher Scientific) and a commercial 20% Pt/C catalyst (Etek) were used as received. All solutions were prepared using distilled and deionized water.
Electrochemistry at ambient temperature in aqueous H2SO4
Catalyst (2.5 μg) coated glassy carbon (GC) working electrodes (3 mm diameter) were prepared by suspending 1.5 mg of catalyst powder in 5 mL of water with sonication, applying 8.3 μL of the resulting "ink" onto the GC surface, and drying at ambient temperature. A glass cell with a saturated calomel electrode (SCE) and a Pt wire counter electrode in a separate compartment was used with a RDE4 potentiostat (Pine Instruments), operated by custom software. All solutions were purged with N2 and measurements were made at ambient temperature (22 °C ± 1 °C). Voltammetric measurements were conducted in triplicate (3 electrodes), and uncertainties in peak currents were <±5%.
Methanol and ethanol oxidation in a PEM electrolysis cell
A commercial (ElectroChem Inc.) PEM fuel cell, with a 5 cm2 Pt black cathode and a Nafion 117 proton conducting membrane electrolyte, was modified to accommodate nine separate 0.236 cm2 anodes as previously described.31 Anodes were prepared by spreading the catalyst, suspended in 1-propanol containing Nafion solution (DuPont), onto Toray carbon fiber paper (TGP-H-090). Anodes contained 3 mg cm−2 of Rh@Pt or 4 mg cm−2 of Ru@Pt, with 20% Nafion as a binder.
The PEM cell was operated as an electrolysis cell, in crossover mode,31 by pumping the liquid fuel solution through the cathode flow field at 0.5 mL min−1 while the anode flow field was purged with nitrogen gas (10 mL min−1). A series of constant potential steps from 0.9 to 0 V were applied with a MSTAT potentiostat from Arbin Instruments. In this mode, the fuel diffuses through the cathode and membrane and is oxidized at the anodes, while the cathode produces hydrogen and therefore acts as a dynamic hydrogen electrode (DHE). The cell was operated at 80 °C in all experiments. Polarization curves show the average current over 120 s, following a 60 s delay at each potential. Prior to collection of the reported data, the cell was operated with 1 M methanol for 8 h with periodic measurement of polarization curves, to activate the membrane and electrodes. The performances of the electrodes showed no deterioration over a week of periodic operation.
Results and Discussion
Characteristics of the catalysts
Previously reported X-ray diffraction (XRD), transmission electron microscopy, and cyclic voltammetry data provide strong evidence that the Ru@Pt20 and Rh@Pt25 nanoparticles employed in this work had structures with Pt layers covering Ru and Rh cores (i.e. core–shell structures). TEM images, shown in the Supplementary Material as Figs. S1 and S2 (available online at stacks.iop.org/JES/167/106507/mmedia), show an increase in the average diameter (d) of the metal particles as the Pt content was increased (Table I). The increases in size correlate well with the expected increases (Table I) calculated by using Eq. 1,32

where dc is the diameter of the core, nc is the number of atoms in the core, and nPt is the number of Pt atoms in the shell. Equation 1 has previously been shown to be accurate for Rh@Pt particles over the range of sizes employed here.24 The correlation between the measured and calculated diameters provides strong evidence that the Pt was deposited without significant dissolution of the Ru or Rh cores, and that the calculated Pt coverages are reasonable as average values. However, it should be noted that the variations in particle shapes, sizes, and aggregation seen in the TEM images would presumably have produced a range of Pt coverages for each sample. If all of the particles in each sample had the same Ru:Pt or Rh:Pt ratio, then the smaller particles would have thinner Pt shells, and there could be some exposure of the Ru or Rh core at ≥1 ML of Pt.
XRD of the Ru@Pt nanoparticles20 shows a transition from a distorted hexagonal close packed structure of the Ru core to a Pt-like face centered cubic (fcc) structure as the Pt coverage was increased. This is consistent with previous reports on similar Ru@Pt nanoparticles,16,33 and inconsistent with alloy formation.33 It demonstrates that core–shell particles were formed. Since Rh and Pt both have a fcc structure, changes in the XRD of Rh@Pt with Pt coverage25 were more subtle than for Ru@Pt. However, increasing shoulders seen on the main peaks as the Pt coverage was increased show the formation of a distinct Pt shell, and are inconsistent with alloy formation.26
XRD shows that there was significant compression of the Pt shells, as documented by other groups.16,26 Figure 1 compares the compressive strains of the two series of nanoparticles employed in this work, calculated as described in Ref. 20. The Pt lattice strain for Ru@Pt decreased gradually (from −2.5% to −1.4%) for Pt coverages up to 1.3 ML (Ru41@Pt59) then abruptly decreased to −0.6% at 1.9 ML. A previous report has shown lattice compressions ranging from −0.6 to −2.2% for similar Ru@Pt nanoparticles.16 The Rh@Pt nanoparticles show a similar trend (Fig. 1), although the strain was higher at low Pt coverages due to the larger core.
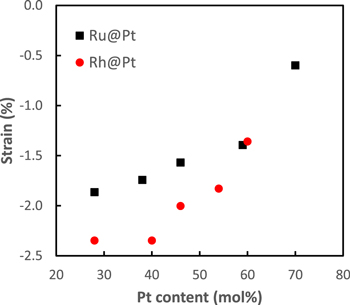
Figure 1. Compressive strain of the Pt lattice from XRD20,25 vs Pt content for the Ru@Pt and Rh@Pt nanoparticles employed in this work.
Download figure:
Standard image High-resolution imageCyclic voltammetry is more surface selective than XRD, TEM, and even X-ray photoelectron spectroscopy, and therefore provides the best experimental indication ("electrochemical fingerprinting") of the surface coverage of Pt.30 Cyclic voltammograms of the Ru@Pt/C catalysts in aqueous H2SO4 showed decreasing currents due to the faradaic pseudo capacitance of surface Ru oxide as the Pt coverage was increased.20 The change in the Ru oxide pseudo capacitance with the calculated Pt coverage was in close agreement with that reported in Ref. 30, as shown in Fig. S3. At 1.9 ML, the voltammetric profile was very similar to that of Pt/C,20 indicating that there was complete coverage of the Ru core.
Similar changes with Pt coverage were seen in voltammograms of the Rh@Pt/C catalysts in aqueous H2SO4.25 The voltammogram for the Rh40@Pt60/C sample (2.7 ML of Pt) was very similar to that for Pt/C, indicating that the Rh core had been completely covered and that the electronic and lattice compression effects of the Rh core were minor. Currents in the oxide region increased as the Pt coverage was decreased (Fig. S3), with an abrupt change at ca. 1 ML. These changes were attributed25 to the growing electronic and strain effects of the Rh core,26 with a more pronounced electronic effect at 1 ML Pt coverage,16 and partial exposure of the Rh core. They indicate that the Pt coverages estimated from the Rh particle size and Rh:Pt ratio are reasonable.
Methanol oxidation in aqueous H2SO4
Figure 2 shows voltammograms for the oxidation of methanol at Rh/C, Pt/C, and Rh@Pt/C catalysts. Rh is much less active than Pt for methanol oxidation. However, deposition of Pt onto the Rh nanoparticles increased their activity greatly, and when the Pt coverage exceeded 1 ML, higher mass normalized peak currents were obtained for the Rh@Pt catalysts than for Pt/C. This is despite the mass fractions of Pt being lower, and the particle sizes being higher than for the Pt/C catalyst.
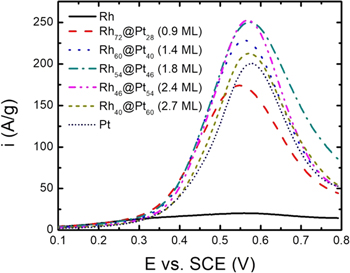
Figure 2. Cyclic voltammetry (20 mV s−1) of Rh/C, Rh@Pt/C, and Pt/C coated GC electrodes in 0.1 M H2SO4 + 1 M methanol at ambient temperature, with the current normalized to the total mass of Rh+Pt.
Download figure:
Standard image High-resolution imageAn understanding of the role of the Rh core in increasing the rate of methanol oxidation at the Pt shell can be obtained by analysis of the effects of increasing the shell thickness. The "activity" of each catalyst is quantified here by the peak current on the first anodic scan, which results primarily from an increase in the rate of oxidation of the COad intermediate with increasing potential, followed by inhibition of methanol adsorption as the coverage of surface oxide increases at higher potentials.34 The maximum peak current in Fig. 2 corresponds to 4.5 mA cm−2, which is well below the theoretical diffusion controlled peak current density of ca. 760 mA cm−2, and so not influenced significantly by mass transport.
It can be seen from the data in Fig. 2 that the peak current increased to a maximum at ca. 2 ML, indicating that there was an optimum level of the d-band center. Since the peak potential for CO stripping (ECO) increases with increasing d-band level, plotting the peak methanol oxidation current (iMeOH) against ECO is useful for visualizing the role of shell thickness, as shown in Fig. 3.

Figure 3. Peak current for methanol and ethanol oxidation at Rh@Pt catalysts vs the peak potential for electrochemical stripping of adsorbed CO from Ref. 25.
Download figure:
Standard image High-resolution imageFor all of the Rh@Pt catalysts, CO oxidation occurred at lower potentials than at Pt/C (0.615 V in Fig. 3) due weakening of CO adsorption by the ligand and strain effects of the core on the Pt shell.18,24–26,35,36 This becomes more pronounced as the thickness of the Pt shell is decreased, causing the CO coverage to decrease and iMeOH to increase. However, the increasing ligand and strain effects also weaken the adsorption of methanol,16 causing its oxidation current to decrease at Pt coverages below 1.8 ML (ECO < 0.58 V). A similar balance of these effects on formic acid oxidation has previously been discussed.25
It is notable in Fig. 3 that both ECO (0.613 V) and iMeOH for the Rh40@Pt60 nanoparticles are close to the values for Pt/C, indicating that the ligand and strain effects were small. Consequently, the voltammogram for the Rh40@Pt60/C electrode in Fig. 2 is most similar to that for Pt/C.
The voltammogram for the Rh72@Pt28/C electrode in Fig. 2 is anomalous in that it is shifted to lower potentials and the peak current is lower than for Pt/C. This catalyst had an average Pt coverage of less than one monolayer, meaning that there would have been exposed Rh at the surface. The lower fraction of surface Pt than for the Pt/C and the other Rh@Pt catalysts can account for the lower peak current, while the oxidation of exposed Rh sites to Rh–OH can account for the negative shift. Since Rh is oxidized at a lower potential than Pt, adsorbed CO can be oxidized at lower potentials through the bifunctional mechanism.25
Data for methanol oxidation under similar conditions at Ru@Pt/C catalysts prepared in the same way have been previously reported.16 Increasing the coverage of Pt on the Ru core from 0.1 ML to 1.1 ML was found to increase the activity substantially, and this was attributed primarily to the increasing size of islands of Pt. A bifunctional effect of Ru at the surface was considered to be minor or insignificant, while compressive strain was shown to decrease the activity at low potentials. This was attributed to weaker methanol adsorption and/or slower dehydrogenation. A continued increase in activity from 1.1 ML to 1.9 ML was attributed to enhancement of the methanol adsorption/dehydrogenation step, due to the weakening ligand effect.
Ethanol oxidation in aqueous H2SO4
Figure 4 shows linear sweep voltammograms for the oxidation of ethanol at Rh/C, Pt/C, and Rh@Pt/C catalysts. As previously reported,4 Rh is much less active than Pt for ethanol oxidation. However, deposition of Pt onto the Rh nanoparticles increased their activity greatly, producing specific currents that were higher than for Pt/C for all of the Rh@Pt/C catalysts at all potentials. The peak potential was slightly lower for the sub-monolayer Rh72@Pt28/C catalyst than for Pt/C and the other Rh@Pt/C catalysts, suggesting a small bifunctional effect. However, currents at all potentials increased with increasing shell thickness, up to ca. 1.8 ML, indicating that the dominant effects were ligand and/or strain. Increasing the Pt coverage above 2 ML, resulted in a sharp decrease in activity at all potentials, and at 2.7 ML the mass normalized voltammogram was close to that for Pt/C. However, it should be noted that the Rh40@Pt60/C catalyst still outperformed Pt/C on a metal mass basis, and that the Rh40@Pt60 nanoparticles were significantly larger than the Pt nanoparticles. Clearly, the differences would be more pronounced on a Pt mass or area basis.
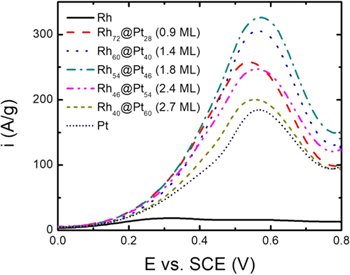
Figure 4. Cyclic voltammetry (20 mV s−1) of Rh/C, Rh@Pt/C, and Pt/C coated GC electrodes in 0.1 M H2SO4 + 1 M ethanol at ambient temperature, with the current normalized to the total mass of Rh+Pt.
Download figure:
Standard image High-resolution imageThe highest ethanol oxidation activity occurred at 1.8 ML of Pt, which is close to the optimum coverage for methanol oxidation in Fig. 2, between 1.8 and 2.4 ML. In both cases, it occurred when the CO oxidation potential was closer to that of Pt/C (ECO = 0.615 V) than Rh72@Pt28/C (ECO = 0.484 V) (Fig. 3), indicating that the effects on CO adsorption strength were of secondary importance. As for methanol oxidation, the increase in activity as the Pt coverage was increased can be attributed to to strengthening of ethanol adsorption, while the decrease at higher coverages is due to CO becoming too strongly adsorbed. The slight difference in the optimum coverage (Fig. 3) would then reflect the difference in the adsorption strength of methanol vs ethanol.37
The role of the Rh core in controlling adsorbate binding to the surface of the Pt shell is still not entirely clear. Lima and Gonzalez18 suggested that both an electronic interaction (ligand effect) and Pt lattice contraction lower the Pt d-band center, which decreases adsorption strength. However, Harak et al.26 state that the smaller work function of Rh relative to Pt causes electron density transfer to the Pt shell, resulting in a higher d-band center, while lattice compression would lower the Pt d-band center. For Pt on a Rh(111) surface, Friebel et el.38 have reported that both effects lower the Pt d-band center, and that the strain effect persists as the Pt thickness is increased to 2−4 ML while the ligand effect becomes insignificant. This is consistent with other reports that the ligand effect occurs over only a few ML, while lattice compression is longer range.35,36 In light of these observations, the results in Figs. 2 and 4 strongly suggest that lattice compression is the dominant effect for methanol and ethanol oxidation at the Rh@Pt nanoparticles employed in this work.
The similarity between the effects of shell thickness on methanol and ethanol oxidation is consistent with the proposal that activity is controlled by the balance of reactant and CO adsorption, and not by other processes that would be more specific. In particular, the oxidation of methanol and ethanol differ considerably in completeness, with methanol being oxidized mainly to CO2,34 while the main products for ethanol oxidation are acetaldehyde and acetic acid.39
Figure 5 shows linear sweep voltammograms for the oxidation of ethanol at Pt/C, and Ru@Pt/C catalysts. Although the results are broadly similar to those seen for the Rh@Pt/C catalysts in Fig. 4, there are some notable differences, attributable mainly to the different ranges of Pt coverage employed. The Ru72@Pt28 nanoparticles with 0.4 ML of Pt, provided significantly higher activities than Pt at low potentials, which can be attributed to weakening of CO adsorption due to ligand and strain effects. At higher potentials, activity was lower than Pt because only ca. 40% of the surface was Pt. Increasing the Pt coverage to 0.9 ML did not significantly influence the low potential activity (the differences in this region contain significant contributions from changes in the electrode pseudocapacitance30), but greatly increased the peak current at ca. 0.6 V. The peak current increased slightly at 1.3 ML, with a decrease at 1.9 ML.
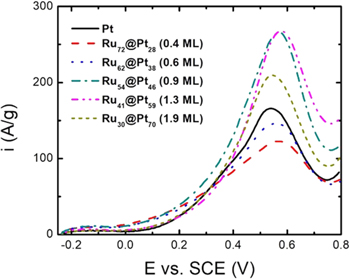
Figure 5. Cyclic voltammetry (20 mV s−1) of Ru@Pt/C, and Pt/C coated GC electrodes in 0.1 M H2SO4 + 1 M ethanol at ambient temperature, with the current normalized to the total mass of Ru+Pt.
Download figure:
Standard image High-resolution imageThe peak in ethanol oxidation activity for Ru@Pt occurred at approximately the same Pt shell thickness as for Rh@Pt, despite the significant difference in compressive strain (−1.4% for Ru41@Pt59 vs −2.0% for Rh54@Pt46). This is illustrated in Fig. S4, which shows peak currents for oxidation of ethanol vs strain. It is consistent with the stronger ligand effect of Ru, which adds to the strain effect in controlling adsorbate binding. This difference in ligand effect is clear from previously reported CO stripping data, where the peak potentials were 0.42 V (vs SCE) for Ru41@Pt59 (1.3 ML),20 0.50 V for Rh60@Pt40 (1.4 ML), and 0.57 V for Rh54@Pt46 (1.8 ML).25
Zou et al.19 have recently reported that the strain in the Pt shell of Ru@Pt nanoparticles can be increased by increasing the crystallinity of the Ru core, and that this increases activity for formic acid and ethanol oxidation. For 2.5 nm Ru cores, the optimum Pt coverage for ethanol oxidation was ca. 2.5 ML for both ordered and disordered cores. The strain in the Pt layer was −0.798% for the ordered core and −0.543% for the disordered core, while the strain for the best catalysts in Fig. 5 was −1.6% at 0.9 ML and −1.4% at 1.3 ML. These differences suggest that the ligand effect of the Ru core also plays a significant role in the activity of Ru@Pt for ethanol oxidation. Also, differences in the binding strength of –OH resulting from differences in surface structure (determined by size, shape, the presence of low coordination sites, and degree of equilibration), may also play a significant role here.21
The most significant differences between Ru@Pt and Rh@Pt occurred at potentials between 0 V and 0.4 V at Pt coverages close to 1 ML. Specifically, the Ru core had a much stronger activating effect in this region relative to Rh. This again implies that Ru exerts a stronger ligand effect than Rh, as also suggested in several other studies.24,40
Methanol and ethanol oxidation in a PEM electrolysis cell
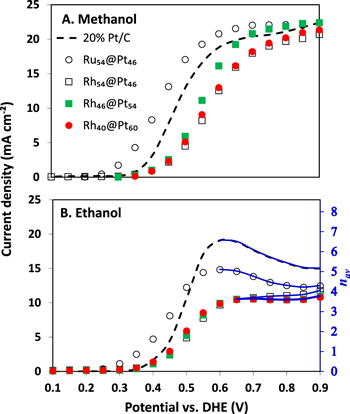
Figure 6 shows polarization curves for oxidation of 0.1 M methanol and 0.1 M ethanol at a commercial Pt/C catalyst and selected Ru@Pt/C and Rh@Pt/C catalysts. For methanol oxidation, the current densities at the Pt/C, Ru54@Pt46 and Rh46@Pt54 anodes reached a mass transport limited31 value (jlim) of ca. 22 mA cm−2 at high potentials, while the current densities at the other Rh@Pt anodes approached this limit. The limiting current density is given by Eq. 2,31

where n is the number of electrons transferred (n = 6 for methanol oxidation), m is the mass transport coefficient, and C is the concentration of methanol. Substitution of jlim from Fig. 6A into Eq. 2 provides m = 3.8 × 10⁻⁴ cm s−1, which is in good agreement with the value previously reported for these conditions.31 The failure of the Rh54@Pt46 and Rh40@Pt60 anodes to reach the mass transport limit most likely indicates that their kinetic currents (activities) were lower, which would be roughly consistent with the peak in activity observed for the Rh54@Pt46 and Rh46@Pt54/C catalysts in Fig. 2.
Figure 6. Polarization curves for the oxidation of 0.1 M methanol (A) and 0.1 M ethanol (B) at 80 °C at a Ru54@Pt46 (○), Rh54@Pt46 (□), Rh46@Pt54 ( ), Rh40@Pt60 (
 ) and 20% Pt/C (Etek) anodes in a PEM cell. The blue lines show the range over which the nav scale is valid.
Download figure:
Standard image High-resolution image
The kinetic activities of the catalysts are more clearly seen at potentials below the mass transport limited region, where currents become kinetically controlled when below ca. 10% of the mass transport limit (i.e. <2 mA cm−2).31 In this region, it can be seen that the Ru54@Pt46/C catalyst was much more active than Pt/C, which was significantly more active than the Rh@Pt/C catalysts, which all gave similar kinetic currents. Some difference can be seen between the Rh@Pt/C catalysts at the half-wave potentials (E = E½ at 50% of the limiting current), with the activity decreasing (E½ increasing) in the order Rh46@Pt54/C > Rh40@Pt60 > Rh54@Pt46 which is consistent with the trend in limiting currents. The smaller particle size, and slightly higher loading, of the Ru54@Pt46/C catalyst may have contributed to its superiority over the Rh@Pt/C catalysts, but only by a factor of two or less. It could not account for the factor of 10 or more difference observed from 0.3 to 0.4 V.
The enhanced activity of the Ru54@Pt46/C catalyst over Pt/C is consistent with the many reports showing that Ru@Pt catalysts are more active for methanol oxidation than Pt alone. The data in Fig. 6A show that this enhancement is also substantial in a PEM cell at 80 °C and provides convincing evidence that Ru@Pt catalysts are suitable for use in direct methanol fuel cells (DMFC). On the other hand, the results for the Rh@Pt/C catalysts in Fig. 6A do not show the enhancement over Pt/C seen in aqueous H2SO4 (Fig. 2), and instead there was a significant loss of activity. This suggests that Rh@Pt/C catalysts are unlikely to be useful for DMFC.
The dramatic difference between the activities of Ru@Pt and Rh@Pt in aqueous H2SO4 at ambient temperature vs the PEM cell at 80 °C may be due to differences in the relative binding energies of methanol and intermediates such as CO. Since the formation of adsorbed CO is less of a problem at elevated temperatures, the effects of lattice stain may become less important, while electronic and bifunctional effects may be more significant.16 In addition, sulphate adsorption can play a significant role in aqueous H2SO441 and this would have different impacts for Ru@Pt vs Rh@Pt. Furthermore, the role of the Pt surface structure in controlling –OH adsorption may be also be important.21
The data for ethanol oxidation in Fig. 6B show stark differences relative to the data for methanol oxidation. Most notably, this is seen in the mass transport limited region from ca. 0.6 to 0.9 V. Rather than rising to a plateau, the current density at Pt/C peaked at ca. 0.6 V and then decreased. This is due to a potential dependence of n in Eq. 2, that arises from changes in the product distribution.7 The main products are acetaldehyde (n = 2), acetic acid (n = 4), and CO2 (n = 12), and the observed value of n is a weighted average (n = nav) based on their yields according to Eq. 3.

where ni is the number of electrons transferred to form product i and fi is the fraction of ethanol converted to product i. For Pt/C, there is little production of acetaldehyde at potentials above 0.45 V and the acetic acid to CO2 ratio increases with potential.7 The resulting decrease in nav causes the mass transport limited current to decrease with increasing potential, as seen in Fig. 6B.31
Clearly, Eq. 2 can be used to determine nav as a function of potential. This is shown in Fig. 6B by the scale on the right, which was obtained by using m = 3.0 × 10⁻⁴ cm s−1 for ethanol.31 The blue lines show the approximate range over which the nav scale is valid (i.e. the mass transport controlled region). It can be seen from the data for Pt/C that nav deceased from 6.6 at 0.6 V to 5.2 at 0.9 V. These values are similar to those obtained by product analysis for a 70% Pt/C catalyst under the same conditions (e.g. 7.4 at 0.6 V and 6.0 at 0.7 V).7
Determination of nav is essential for measuring the efficiency of the anode of a DEFC since the faradaic efficiency (εF) is proportional to nav (εF = nav/12). It is strongly dependent on the selectivity (fcarbon dioxide) of the catalyst for the complete oxidation of ethanol to CO2. Although the selectivity (or chemical yield of CO2 = fcarbon dioxide × 100%), cannot be obtained exactly from nav alone, it can be estimated from Eq. 3 by averaging values calculated for facetic acid = 0 and facetaldehyde = 0, with the range of these possible values providing a measure of the uncertainty. Thus, for nav = 6.6 at 0.6 V for the Pt/C catalyst in Fig. 6B, the chemical yield of CO2 must have been within the range of 39 ± 7%.
Based in this discussion, the data for the Ru@Pt and Rh@Pt anodes in Fig. 6B can now be assessed. The polarization curve for the Ru54@Pt46 anode is similar to that for Pt/C, although the currents in the kinetic region (< 0.4 V) were much higher, while those in the mass transport limited region (> 0.5 V) were somewhat lower. The high catalytic activity of the Ru54@Pt46/C catalyst is consistent with the results in aqueous in H2SO4 (Fig. 5), although more pronounced. However, the lower currents in the mass transport limited region, and the corresponding lower nav values, show that the stoichiometry was lower. At 0.6 V, nav was 5.1, indicating that less CO2 (22 ± 9%) was produced than at the Pt/C catalyst. Product analysis for ethanol oxidation at a PtRu/C alloy catalyst under the same condition has shown that the main product was acetic acid (e.g. 93.9% acetic acid, 4.6% CO2, and 1.5% acetaldehyde at 0.6 V) and nav was 4.3 (13 ± 10% CO2) at 0.6 V.7 This indicates that the Ru54@Pt46/C catalyst was more efficient for oxidation of ethanol to CO2 than PtRu/C, but less efficient than Pt/C.
The data for the Rh@Pt anodes in Fig. 6b is very curious. They were all less active than Pt/C, contrary to the results in aqueous H2SO4 (Fig. 4), gave much lower stoichiometries with an almost constant nav ∼ 4 (10 ± 10% CO2), and showed no significant changes as the thickness of the Pt shell was varied from 1.8 to 2.7 ML. The lower activity parallels that seen for methanol oxidation in Fig. 6A, and so can similarly be attributed to differences in the relative binding energies of ethanol and intermediates such as CO, as well as the effects of sulfate adsorption.
The low stoichiometry and its lack of dependence on potential and shell thickness shows that all of the Rh@Pt/C catalysts produced acetic acid (n = 4) almost exclusively at potentials above 0.6 V. It is inconceivable that the CO2 and acetaldehyde yields could have balanced to produce nav ∼ 4 at all potentials in the mass transport region, at all three Rh:Pt ratios, unless they were both very low.
The almost exclusive production of acetic acid at the Rh@Pt/C catalysts can be explained in part by the observation that they all have higher –OH coverages than Pt/C at low potentials.25 This would promote oxidation of the adsorbed –C(CH3)O intermediate to acetic acid.42 In addition, the strain and/or electronic effects of the Rh core must inhibit C–C bond breaking, which is contrary to the effect of alloyed PtRh.4,5 This implies that PtRh alloy catalysts are superior for use in direct ethanol fuel cells than Rh@Pt catalysts with >1 ML of Pt. However, it is possible that Rh@Pt catalysts with sub-monolayer coverages of Pt will provided competitive performances. The attraction then, would be the economic benefit of lower Pt requirements.
Conclusions
In aqueous H2SO4, the Ru and Rh cores of Rh@Pt and Ru@Pt nanoparticles show similar activating effects on methanol and ethanol oxidation. Activities peak at between ca. 1 and 2 monolayers of Pt, indicating that lattice compression (strain) is the dominant effect. At lower coverages, the combined ligand and strain effects are too strong, and adsorption of methanol and ethanol is too weak. Weakening of CO adsorption is of secondary importance. At higher Pt coverages, the activities of both Rh@Pt and Ru@Pt decrease, and approach those of Pt alone, due to the increasing strength of CO adsorption. Differences between Rh@Pt vs Ru@Pt and methanol vs ethanol are seen primarily in the optimum coverage, which reflects the optimum balance between reactant and intermediate (primarily CO) adsorption. Lower Pt coverages are required for Ru@Pt than Rh@Pt, indicating that ligand effects are more important. Lower coverages are required for ethanol vs methanol, which is consistent with the expectation at that ethanol would be more strongly adsorbed.37
In contrast to the similarities between the activities of the Rh@Pt and Ru@Pt core–shell nanoparticles in aqueous H2SO4, stark differences were observed at 80 °C in a PEM cell. The Ru core enhanced activities significantly, relative to a commercial Pt/C catalyst, for both methanol and ethanol, while activities were suppressed by the Rh core. These differences appear to arise from dominance of electronic and/or bifunctional effects for the Ru@Pt catalyst at 80 °C, although the effect of sulphate adsorption may also be a significant factor in aqueous H2SO4.
It is clear that Ru@Pt catalysts show strong potential for use in methanol and ethanol fuel cells while the Rh@Pt catalysts tested here have not shown any benefits over Pt/C. This is a conclusion that could not have been reached based on measurements in aqueous H2SO4 at ambient temperature, and demonstrates the importance of measurements in a PEM cell.
Acknowledgments
This work was supported by the Natural Sciences and Engineering Research Council of Canada and Memorial University.