Abstract
The electrolyte for Cu superfilling generally consists of copper sulfate, sulfuric acid, a chloride ion, an accelerator, and a suppressor. In this study, the characteristics of citric acid-based electrolytes and the interaction between citrate species and accelerators are investigated, with the ultimate goal being the replacement of both sulfuric acid and the suppressor with citric acid. Electrochemical impedance measurements were adopted to measure the changes in solution and charge transfer resistances with respect to citric acid and accelerator concentrations. In addition to a decrease in solution resistance resulting from the addition of citric acid, charge transfer inhibition was observed during Cu electrodeposition, which is likely the result of adsorption of citrate species onto Cu surface. A competitive adsorption between the citrate species and the accelerator was also observed and the new additive system was applied to the feature filling in the absence of the conventional polyethylene glycol suppressor. Using this new copper sulfate, citric acid, chloride ion, and accelerator system, trenches were successfully bottom-up filled, resulting in no internal defects.
Export citation and abstract BibTeX RIS

This is an open access article distributed under the terms of the Creative Commons Attribution Non-Commercial No Derivatives 4.0 License (CC BY-NC-ND, http://creativecommons.org/licenses/by-nc-nd/4.0/), which permits non-commercial reuse, distribution, and reproduction in any medium, provided the original work is not changed in any way and is properly cited. For permission for commercial reuse, please email: oa@electrochem.org.
The damascene process, using Cu electrodeposition, is an effective method for fabricating highly conductive and reliable Cu interconnects in various semiconductor devices.1–4 In addition, Cu electrodeposition is widely utilized to realize 3-dimensional packaging through the formation of through-silicon vias (TSVs).5–11 Cu electrodeposition is used to fill features while preventing defect formation, allowing for interconnects that exhibit excellent reliability and high performance. Superconformal electrodeposition, also known as superfilling or bottom-up filling, allows for this defect-free filling in nano- and micro-sized features.12–15
The electrolyte used for Cu electrodeposition typically includes a Cu ion source, a supporting electrolyte, and organic additives. The organic additives, which strongly interact with both the Cu surface and each other, preferentially promote the electrodeposition rate at the bottom of the feature being filled, leading to superfilling.14–18 Different additives elicit different effects on the reduction rate of Cu, and can therefore be categorized as either suppressors or accelerators. The particular combination of accelerators and suppressors generally preferred for Cu superfilling consists of bis(3-sulfopropyl) disulfide (SPS) and polyethylene glycol (PEG) in the presence of chloride ion (Cl−).14–22
Cu superfilling mainly results from the competitive adsorption between SPS and PEG-Cl− and the accumulation of SPS with the area reduction.14–18 This process has been explained by the curvature enhanced accelerator coverage (CEAC) model.3,23–25 As electrodeposition progresses, the area at the bottom of the feature being filled converges; this process is accompanied by accumulation of SPS, which induces local enhancement of Cu electrodeposition at the bottom of the feature. Meanwhile, the suppressor, PEG-Cl−, interrupts charge transfer between Cu ions and the electrode by forming a blocking layer. It also competitively adsorbs with SPS, reducing the surface coverage of SPS. In addition, the concentration gradient of polymeric suppressor plays an important role when the feature dimension is larger than several micrometers like TSVs or when the features have a high aspect ratio. Since the diffusivity of polymeric additive was lower than that of SPS, more SPS reaches the bottom of filling features compared to polymeric suppressor, enhancing the bottom-up characteristics.6,26–28
Sulfuric acid is widely used as a supporting electrolyte for Cu electrodeposition. Sulfuric acid lowers the solution resistance of the electrolyte through dissociation into substantial amounts of protons and sulfate anions, while the adsorption of sulfate anions onto the Cu surface is not so strong as to interrupt the Cu electrodeposition. Note that, if certain anions of the supporting electrolyte act as suppressors, it becomes possible to reduce the number of organic additives and simplify the electrolyte composition. In other words, it may be possible to achieve superfilling in the absence of any additional suppressor. For this purpose, it becomes necessary to consider the interactions (such as competitive adsorption) between the anions and the conventional accelerator.
Previous studies have introduced various kinds of supporting electrolytes for Cu electrodeposition, including potassium cyanide, fluoroboric acid, potassium pyrophosphate, methanesulfonic acid, ethylenediaminetetraacetic acid (EDTA), and citric acid.29–38 Citric acid, in combination with H2O2, was once used as pretreatment solution of Cu seed layer for Ni superconformal deposition.39 However, in this work, we have focused on citric acid as a supporting electrolyte for the replacement of sulfuric acid. Considering the molecular structure, we expected the citrate species to adsorb onto the Cu surface and act as a suppressor. In line with this expectation, Oskam and coworkers have already suggested the possibility of Cu superfilling in a citric acid-based electrolyte.31 They introduced changes to Cu electrodeposition kinetics and gap-filling profiles based on the pH of electrolytes containing CuSO4 and citric acid, but no accelerator.
In this study, the efficacy of replacing the suppressor and supporting electrolyte with citric acid was confirmed, while Cu superfilling without the conventional suppressor, PEG, was investigated. Electrochemical impedance spectroscopy (EIS) was performed so as to better understand the characteristics of a citric acid-based electrolyte and the competitive adsorption between citrate ion and SPS. Finally, the electrolyte, consisting of copper sulfate, citric acid, chloride ions, and SPS, was tested for superfilling ability in the fabrication of a Cu metal interconnect.
Experimental
The electrolytes consisted of 0.25 M CuSO4·5H2O and various concentrations of citric acid (C6H8O7, H3Cit), ranging from 0.10 to 0.75 M. In some cases, chloride ions were added to the electrolyte, with concentration fixed at 1.0 mM. SPS was used as an accelerator, and was added to investigate its interaction with citrate; the concentration ranged from 5 to 200 μM. The electrolyte temperature was maintained at 25°C during both electrodeposition and electrochemical analyses. The complex formed between Cu and citrate ions was inspected by UV-vis spectroscopy (Thermo Spectronics GENESYS10).
EIS and gap-filling were performed with a three-electrode system consisting of working, counter, and reference electrodes. The working electrode comprised a Cu disk with an active area of 0.196 cm2. Before use, the surface of the Cu electrode was ground using sandpaper (2000 grit). Meanwhile, the reference and counter electrodes comprised a Ag/AgCl electrode and a 99.9% Cu wire, respectively. EIS used an alternating potential with an amplitude of 20 mV and a frequency in the range of 25 kHz to 200 mHz. The signal was superimposed on constant potentials of −100, −200, and −300 mV with respect to open circuit potential (OCP). The Nyquist plots obtained with −100 mV of overpotential are presented as the representatives, and the others are minutely described in the following section. All procedures were controlled using a potentiostat (2273, EG&G Princeton Applied Research).
The gap-filling experiments were conducted with fragmented wafers with a size of 1.5×1.5 cm2. The coupon wafers were loaded in a Teflon holder allowing for an exposure of 1 cm2 of the surface to the electrolyte. The wafers were patterned, composed of a Cu seed layer (50 nm thick at the bottom of the trench, 15 nm on the side wall, PVD)/Ta (30 nm at the bottom, 15 nm on the side wall, PVD)/SiO2. The widths of trench were 120 and 240 nm, and the depth was 290 nm. The current density and deposition amount used in the gap-filling are discussed in the following section. The gap-filling experiment was galvanostatically carried out using a potentiostat (273A, EG&G Princeton Applied Research), while the cross-sectional profiles were inspected using a field emission scanning electron microscope (FESEM, S-4800, Hitachi).
In order to examine the film properties including impurity (carbon) incorporation, resistivity, grain size, Cu films were deposited on both Cu blanket wafer and Cu foils using two different electrolytes; (i) 0.25 M CuSO4, 0.5 M citric acid, 1 mM Cl−, 50 μM SPS (electrolyte developed in this work) and (ii) 0.25 M CuSO4, 1.0 M H2SO4, 88 μM PEG (Mw = 3,400), 1 mM Cl−, 50 μM SPS (conventional electrolyte for Cu superfilling). The structure of Cu blanket wafer is Cu seed layer (40 nm, PVD)/Ta (7 nm, PVD)/SiO2. The electrodeposition was performed with 10 mA/cm2, and the deposition times were 60 s on Cu blanket wafer and 200 s on Cu foil. The electrical resistivity and grain sizes were measured from Cu deposits on Cu blanket wafer, and the carbon contents were from those on Cu foil. Sheet resistance and film thickness necessary for the resistivity calculation were measured using a 4-point probe station (CMT-SR1000N, Chang Min Tech Co.) and FESEM, respectively. The grain sizes were calculated from full width at half maximum (FWHM) of Cu (111) peak obtained by X-ray diffraction (XRD, D8 Advance, Bruker). The carbon contents were investigated using an elemental analyzer (Flash EA 1112, Thermo Electron Corporation).
Results and Discussion
Since electrodeposition is significantly affected by the nature of the organometallic complex,31,40–44 it was first necessary to determine the nature of the complex formed by Cu ions and citrate. It has been reported that the complex formed between Cu ions and citrate is dependent on the pH of the electrolyte and the concentration ratio between Cu ions and citrate.40–44 For pH < 2, no complex was observed as the citric acid largely favored its neutral, non-dissociated form. However, once pH>2, citric acid dissociated to H2Cit−, HCit,2− and Cit3− leading to various complexes such as Cu(H2Cit)+, Cu(HCit), Cu(Cit)−, Cu2(Cit)+, Cu2(Cit)22−.45 Complex formation can be observed through UV-vis spectroscopy, with absorption at 800 nm being associated with hydrated, non-complexed Cu ions, and a blueshift and intensity increase being associated with complex formation.31 We observed a similar behavior at various citric acid concentrations, providing fundamental information as to the possible function of citrate as a suppressor in Cu superfilling.
The electrolytes in this study simply consisted of 0.25 M CuSO4 and 0.1 ∼ 0.75 M citric acid, of which pH was not intentionally controlled. The pH values for the electrolyte were 1.60, 1.36, 1.14, and 1.00 for 0.10, 0.25, 0.50, and 0.75 M citric acid, respectively, while the solution lacking citric acid had a pH value of 3.90. This allowed for the calculation of proton concentrations, which were found to be 0.0251, 0.0437, 0.0724, and 0.100 M. Note that the calculated concentrations were below the amounts of corresponding citric acid; since citric acid is triprotic, three dissociated forms (H2Cit−, HCit,2− and Cit3−) are possible, with the predominant structure being determined by electrolyte pH. Since the dissociation constants of citric acid are 2.79 (pK1), 4.30 (pK2), and 5.65 (pK3),40 it is reasonable to conclude that the main forms of the citrate species in the electrolyte were H3Cit and H2Cit−. While the former does not generally form complexes with Cu, the latter is able to do so.
Fig. 1 shows the UV-vis absorbance of electrolytes with respect to citric acid concentration; note that the samples were diluted to half from their original concentration as the solutions containing 0.25 M CuSO4 and citric acid could not be detected by UV-vis spectroscopy. As shown, absorbance increased with citric acid concentration, with no observed shift in peak position. Additional studies (not presented) demonstrate that the free citrate species have no absorption in the wavelength between 400 and 1100 nm; therefore, the increment of peak intensity implied the more amounts of complex (Cu(H2Cit)+) with increase in the citric acid. Based on UV-vis absorbance, it was confirmed that the electrolytes were composed of Cu2+, Cu(H2Cit)+, free citrate species (H3Cit, H2Cit−), and protons. Therefore, the main electrochemical reactions in these electrolytes were as in the following.


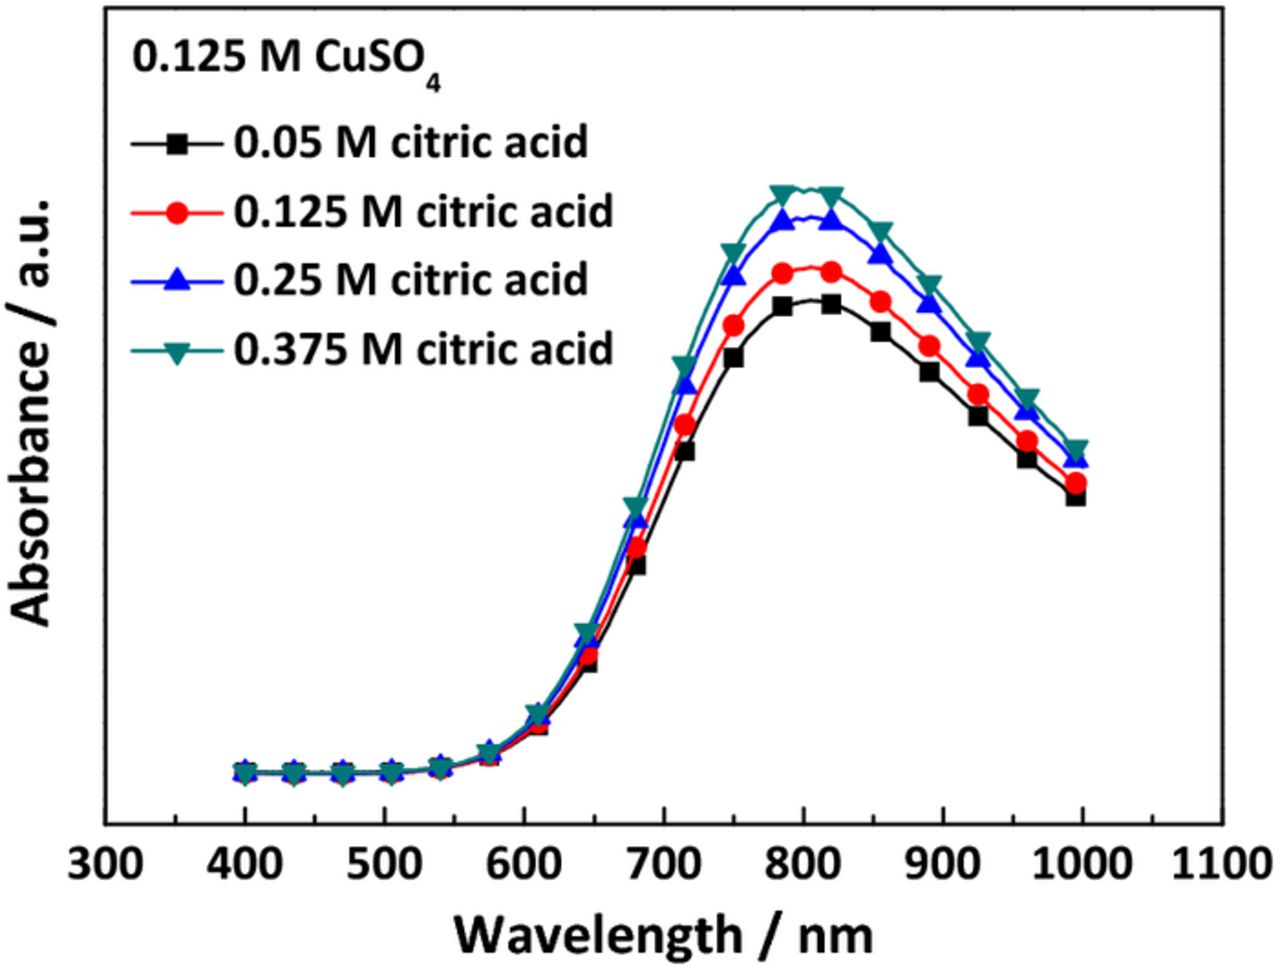
Figure 1. UV-vis absorbance spectra for various concentrations of citric acid in 0.125 M CuSO4 aqueous solution. The reference for this measurement was de-ionized water.
From these reactions, two phenomena were expected to affect the electrochemical reduction of Cu ions. The formation of Cu-citrate complex affects the kinetics of Cu ion reduction, which may result in a negative increase in the reduction potential. Also, the free citrate species, H3Cit or H2Cit−, and Cu(H2Cit)+ could adsorb on a Cu surface, and it may also suppress the electrodeposition of Cu. The adsorption of organic species on Cu surfaces and the impact of this phenomenon on Cu electrodeposition have been investigated by various electrochemical analyses.46,47 Among these techniques, impedance spectroscopy is highly useful, particularly when multiple electrochemical components of the system, such as solution resistance, electrode kinetics, and reactant concentrations, vary simultaneously. Because varying the concentration of citric acid can alter both solution conductance and electrodeposition kinetics, electrochemical impedance was employed in this research; a simple measurement of response current or potential would not have been able to provide detailed information. By using impedance spectroscopy, it became possible to separately investigate solution and charge transfer resistance.
Fig. 2(a) shows representative Nyquist plots with respect to citric acid concentration at −100 mV of overpotential. Note that the semicircle is elongated along with real part. Also, it was observed that the Warburg impedance in the low frequency region intensified as negative potential increased due to fast consumption of Cu ions (not shown here). Naturally, solution resistance did not change with applied potential, while a decreasing tendency was observed for increasing amounts of citric acid, resulting from an increase in charge carrying ions. On the other hand, charge transfer resistance was affected by both applied potential and citric acid concentration. It was considerably lower for increasing negative potential, while it appeared greater as citric acid concentration increased, regardless of applied potential.

Figure 2. The representative Nyquist plots with respect to the concentration of citric acid (a) without and (b) with 50 μM SPS in the electrolyte containing 0.25 M CuSO4 and 1 mM Cl−. (c) The changes in the Nyquist plot according to the concentrations of SPS in the electrolyte containing 0.25 M CuSO4, 0.5 M citric acid, and 1 mM Cl−. All of the results were obtained with −100 mV of overpotential.
A quantitative comparison of both the solution and charge transfer resistances was completed; the results are shown in Fig. 3. As mentioned above, the shape of the Nyquist plot was not that of a perfect semicircle, requiring that it be treated by adopting a constant-phase element (CPE) for calculations.48,49 The equivalent circuit, consisting of solution resistance (RS), charge transfer resistance (RCT), and CPE in the place of a pure capacitor, is presented in the inset of Fig. 3(a); as shown, the parallel CPE and RCT were serially connected to the RS. As indicated above, since the major role of Cu-citrate complex and the adsorption of the citrate species are the changes in the kinetics of Cu deposition, the corresponding equivalent circuit having RCT is good enough to represent characteristics of the electrolyte. Fig. 3 shows that RS values decreased with increasing citric acid concentration, while RCT values increased with citric acid concentration, regardless of the overpotential.
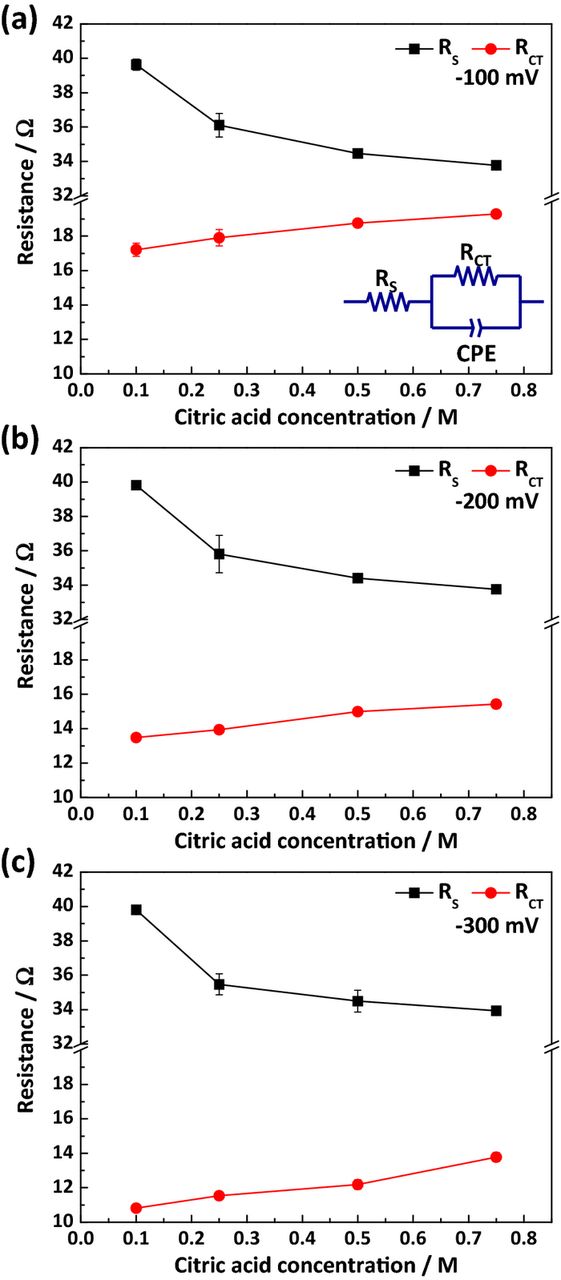
Figure 3. The solution (RS) and charge transfer (RCT) resistances with respect to the concentration of citric acid, in the absence of organic additives and with an overpotential of (a) −100 mV, (b) −200 mV, and (c) −300 mV; the inset in (a) is the equivalent circuit used for measuring resistances.
The observed variability in RCT values may result from either Cu-citrate complex formation or adsorption of both complex and free citrate on the Cu electrode forming a blocking layer against Cu electrodeposition. This would be consistent with previous research; G. Oskam and colleagues reported that complex formation retards the kinetics of Cu electrodeposition.31 Additionally, R. Wiart and coworkers suggested that the free citrate species produced from the electro-reduction of the Cu-citrate complex could adsorb onto the Cu surface, resulting in a blocking layer.41 In this way, the Cu-citrate complexes and free citrate found in the electrolyte can be treated as a suppressor to Cu electrodeposition. If the observed increase in RCT is completely due to the formation of complexes that do not adsorb onto the Cu surface, superfilling could not occur as competitive adsorption with accelerator and subsequent accelerator accumulation would be impossible. However, if there is adsorption of free citrate or of a Cu-citrate complex and that adsorption also contributes the observed increase in RCT, it is possible that these species competitively adsorb on the surface with the accelerator and induce superfilling.
Figs. 2(b) and 4 display Nyquist plots and the changes in the two resistances with respect to the citric acid concentration and overpotential in the presence of 50 μM of SPS. As observed in Fig. 2(b), both resistances were affected by citric acid concentration in a manner similar to Fig. 2(a). The values of the two resistances were obtained, with the results shown in Fig. 4. RCT decreased with the addition of SPS, although no noticeable difference in RS was observed. The decrease in RCT was more pronounced at low applied potential due either to inhibition of SPS adsorption through electrostatic repulsion or fast consumption of SPS at high overpotential.
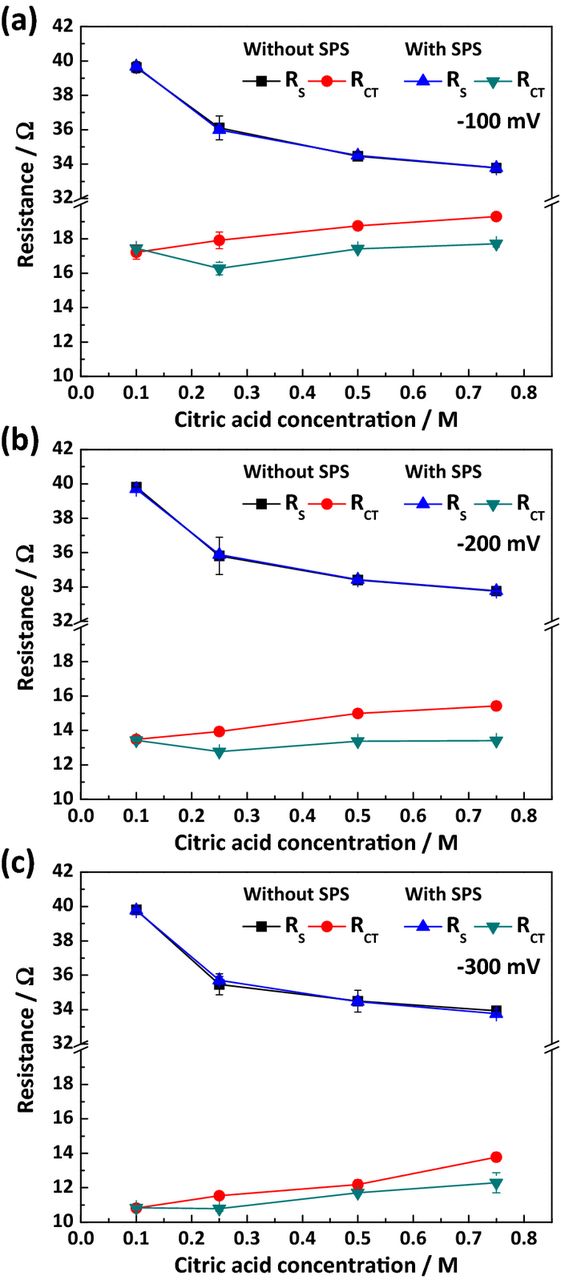
Figure 4. The solution (RS) and charge transfer (RCT) resistances with respect to the concentration of citric acid, in the presence of 50 μM SPS and with an overpotential of (a) −100 mV, (b) −200 mV, and (c) −300 mV.
In addition, the changes observed in RCT values at various concentrations of SPS were investigated in the 0.5 M citric acid electrolyte. The representative Nyquist plots and the changes in the two resistances are shown in Figs. 2(c) and 5, respectively. Similar to the previous results, RS was not affected by SPS concentration, while RCT gradually decreased upon addition of SPS. This suggests that SPS can act as an accelerator in the presence of free citrate or Cu-citrate complexes, and that surface coverage of SPS increases with higher concentration. In this case, the citrate species has the role of suppressor and reduces the rate of Cu electrodeposition in a similar manner to the conventional suppressor PEG. It should also be noted that the magnitude of RCT was greater at lower overpotential, the same tendency as observed in Fig. 4.
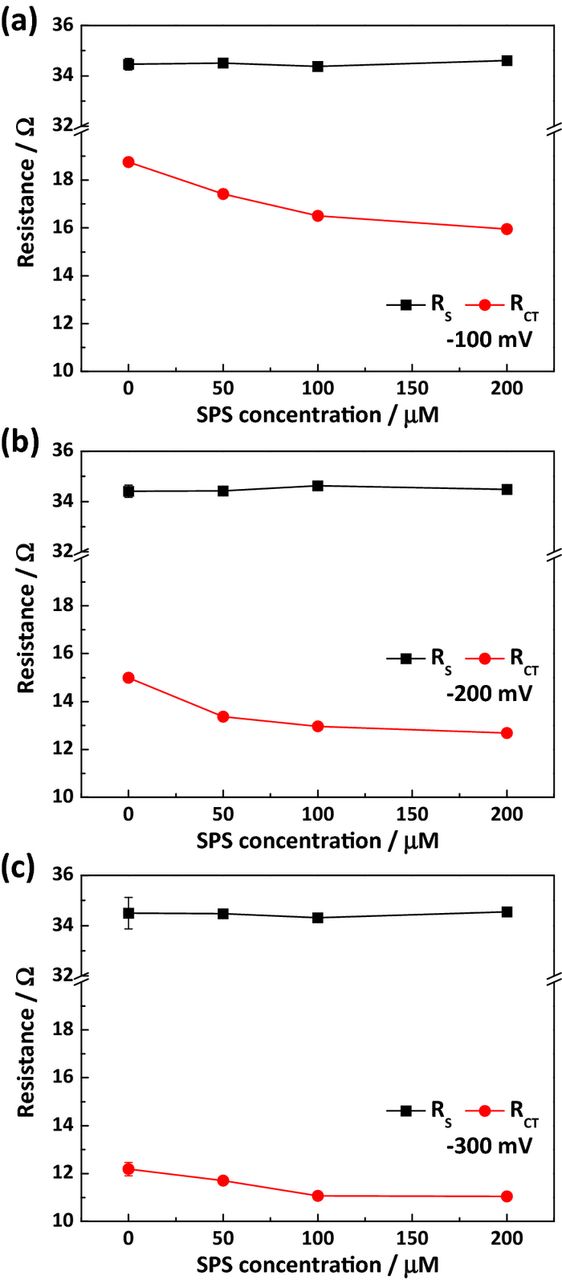
Figure 5. The solution (RS) and charge transfer (RCT) resistances with respect to the concentration of SPS and with an overpotential of (a) −100 mV, (b) −200 mV, and (c) −300 mV.
Overall, the citrate species adsorbs onto the Cu surface, reducing the rate of Cu electrodeposition. Additionally, the citrate species competitively adsorbs onto the Cu surface with SPS, behaving like a general polymer-like suppressor. Though information on the exact adsorbates is limited, it is highly probable that the free citrate species, resulting either from the dissociation of citric acid or via electrochemical reduction of the Cu-citrate complex, is available for Cu superfilling in combination with SPS. Though the importance of Cu(I)-additive complex in the Cu superfilling,50–53 we could not find any evidence on the formation of Cu(I)-citrate species from the EIS, LSV, and CV results (LSV and CV are not shown in here).
The possibility of superfilling using this system was verified by electrodeposition into trenches with 290 nm of depth and two different widths of 120 and 240 nm. The concentrations of citric acid and SPS were fixed at 0.5 M and 50 μM, respectively. No other additives other than 1 mM Cl− ions were added to the electrolyte. The gap-filling profiles with respect to the current density are shown in Fig. 6. The initial response potentials were −200, −250, −280, and −310 mV (vs. Ag/AgCl) for 5, 10, 15 and 20 mA/cm2 of deposition current density, respectively. Note that galvanostatic deposition was used for precise control of deposition amounts. It was clear that the depositions at 5 and 10 mA/cm2 succeeded in filling the trenches without any defect formation; however, higher current densities of 15 and 20 mA/cm2 resulted in internal voids. The convex profile (i.e. bump) is especially apparent at 5 mA/cm2, implying successful superfilling with the citrate-SPS-Cl− system based on the CEAC model,3,23–25 even if the surface was slightly rough. The voids inside the trenches, seen in Figs. 6(c) and 6(d), suggest that higher current densities (i.e. higher overpotentials) are not appropriate for SPS accumulation, an observation that is in accordance with the impedance results. In the case of a current density of 20 mA/cm2, electrodeposition was dominated by mass transport of Cu ions, leading to thicker deposits at the top of features.
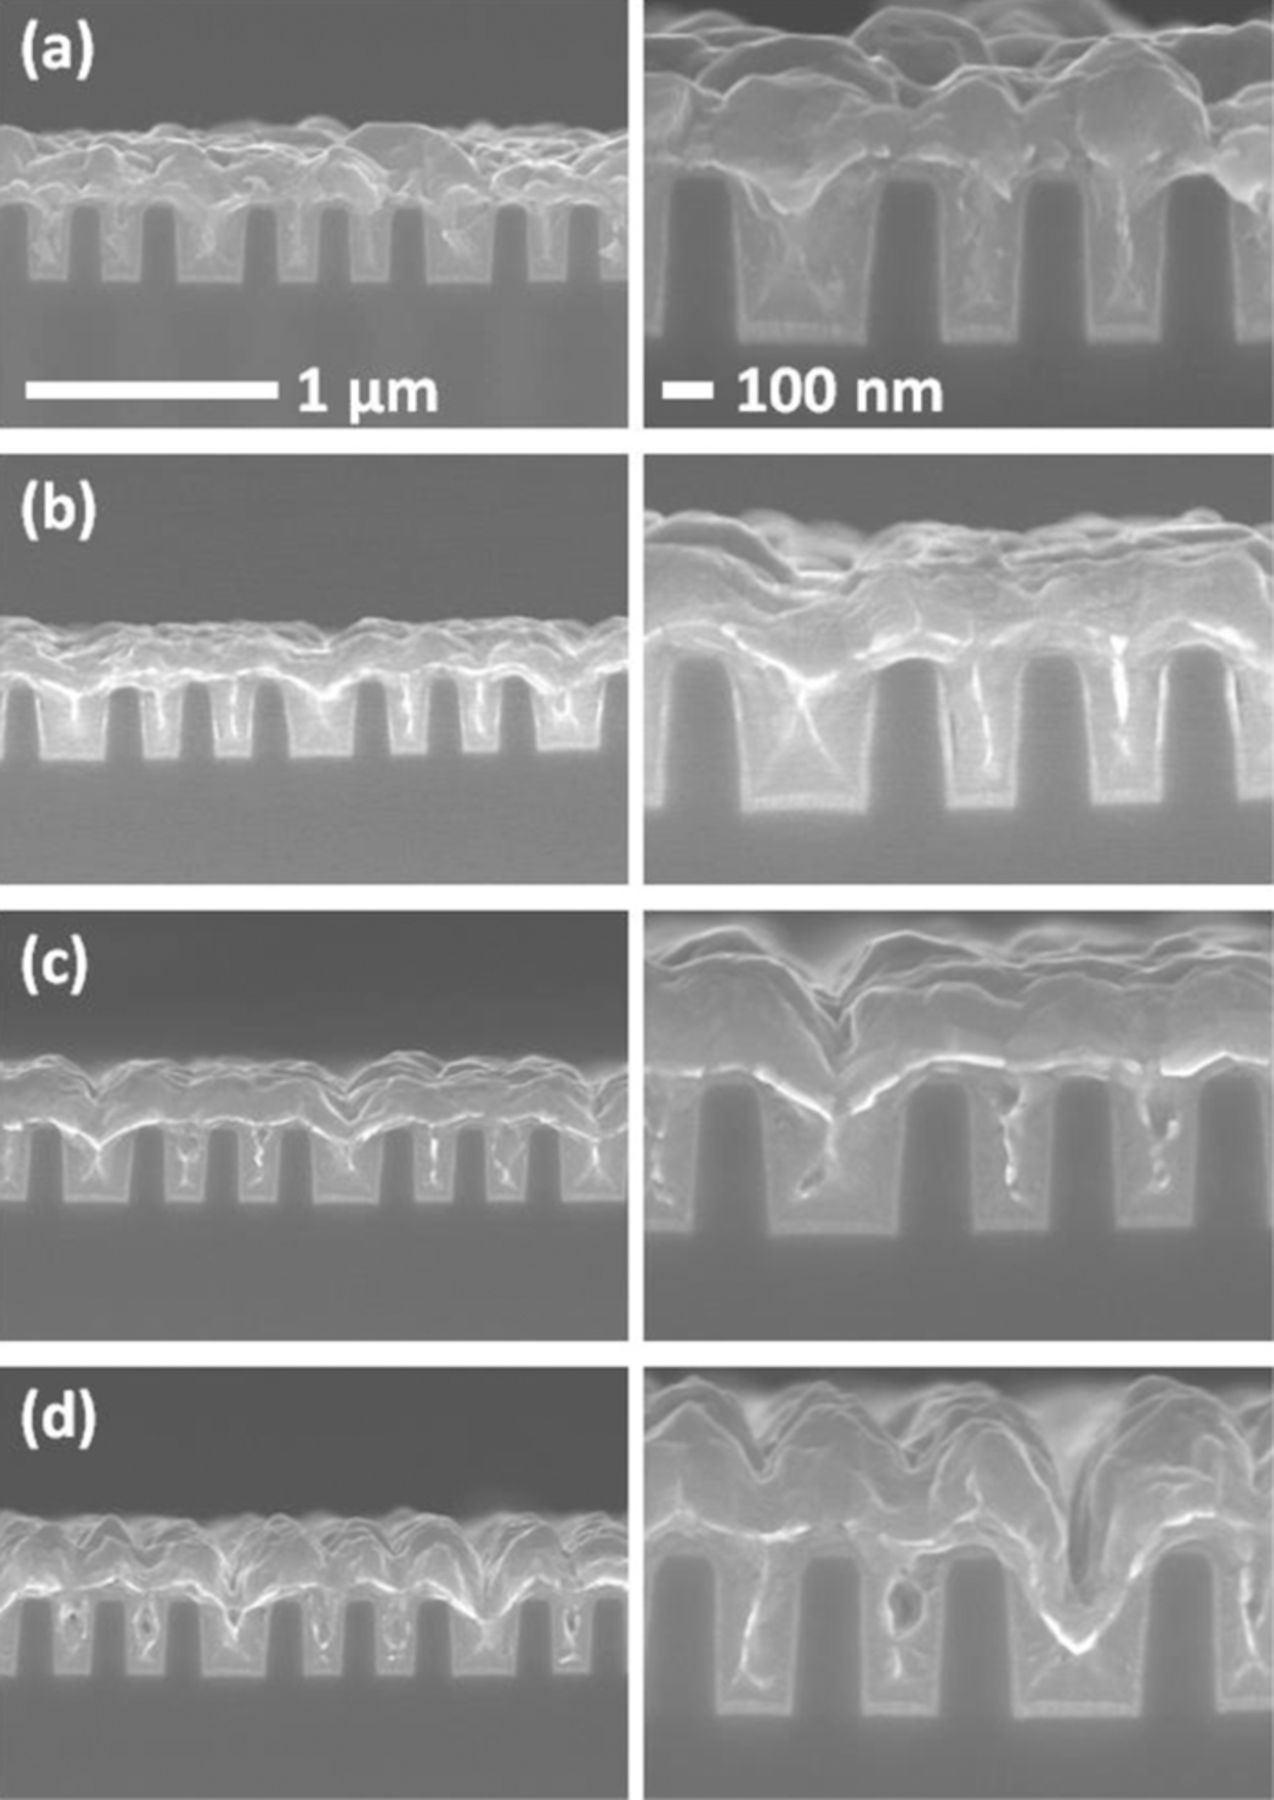
Figure 6. Gap-filling profiles for an electrolyte of 0.25 M CuSO4, 0.5 M citric acid, 1 mM Cl−, and 50 μM SPS and with a current density of (a) 5 mA/cm2 applied for 120 s, (b) 10 mA/cm2 applied for 60 s, (c) 15 mA/cm2 applied for 40 s, and (d) 20 mA/cm2 applied for 30 s.
Gap-filling profile evolution with respect to deposition amount was investigated to confirm bottom-up filling using citric acid and SPS; the results are displayed in Fig. 7. Fig. 7(a) demonstrates that the electrodeposition rate in the presence of citric acid, Cl−, and SPS at the bottom was much faster than at the top, meaning that this system operates in a similar fashion to the more typical PEG-Cl−-SPS system. That is, the complex or citrate species competitively adsorbed with SPS on Cu surface, implying Cu surface was not fully covered by SPS. As the electrodeposition progressed, the surface coverage of SPS was increased by its accumulation with the area reduction at the bottom of features. The accumulated SPS with an assistance of citrate species enhanced the electrodeposition rate at the bottom of features, and it finally induced excellent bottom-up filling of Cu. However, lack of SPS-Cl− resulted in conformal deposition, while some defects formed inside the trenches (Fig. 7(b)). These results demonstrate that citric acid can function as both a supporting electrolyte and a suppressor in Cu electrodeposition, leading to a reduction in the number of superfilling additives and a simplified electrolyte composition.
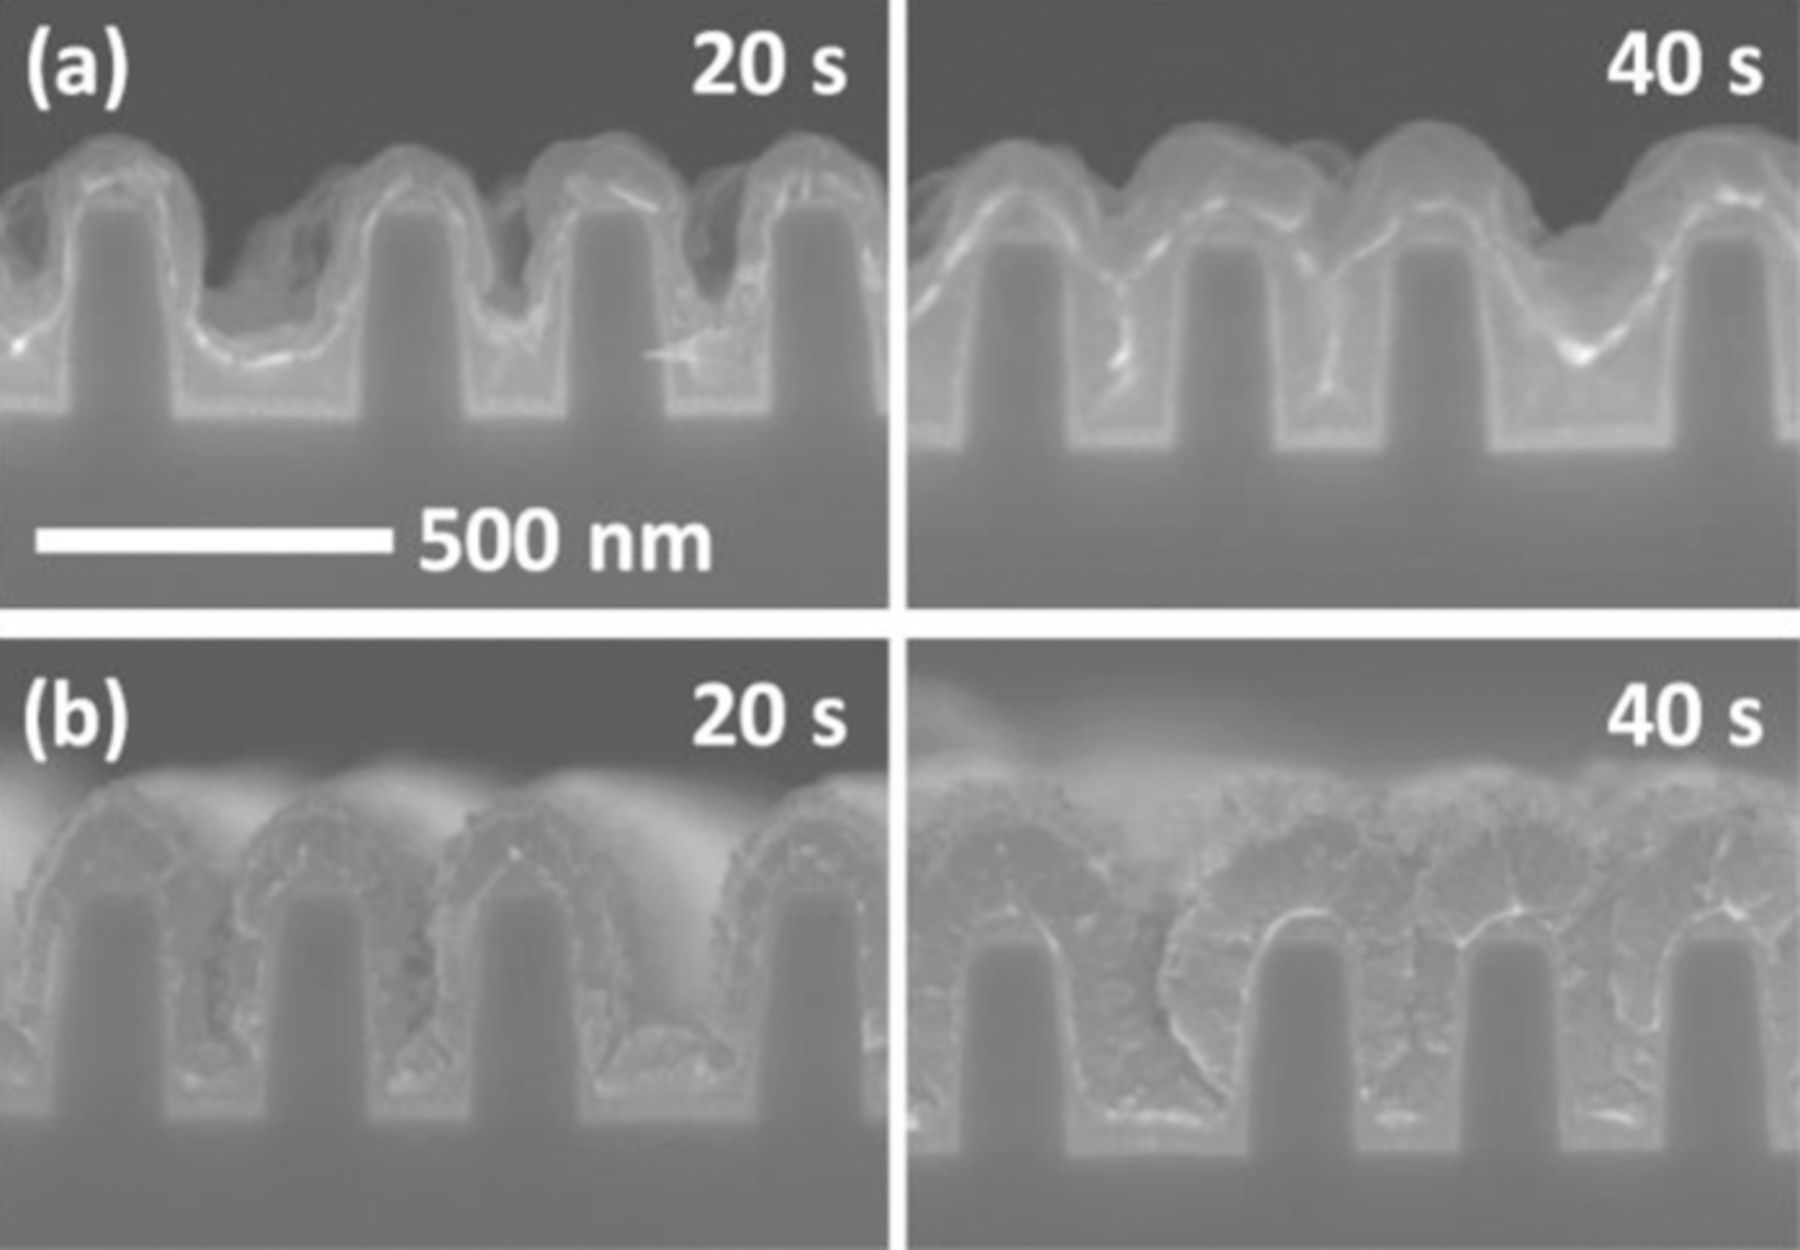
Figure 7. The evolution of filling profiles with respect to deposition time obtained (a) with 50 μM SPS and 1 mM Cl− and (b) without additives; the electrodeposition was performed with a current density of 10 mA/cm2 and an electrolyte consisting of 0.25 M CuSO4 and 0.5 M citric acid.
Finally, the properties of Cu films, such as electrical resistivity, grain size, and carbon content were compared. The electrical resistivities of 340 nm Cu film including 40 nm Cu seed layer were 2.64 (± 0.01) μΩ·cm and 2.77 (± 0.02) μΩ·cm for citric acid-based electrolyte case and conventional sulfuric acid-based electrolyte case, respectively. The grain sizes calculated from FWHM using Scherrer equation were 54 nm and 42 nm, respectively. Large grains of Cu from citric acid-based electrolyte were a main reason for low electrical resistivity. In addition, it was confirmed that the carbon contents were also comparable to each other (0.0771 wt% for citric acid and 0.0851 wt% for the conventional sulfuric acid), which implied the electrodeposition of Cu from Cu-citrate complex did not result in severe incorporation of impurity into the deposit. To conclude, the properties of Cu films from Cu-citrate complex were comparable to that deposited in conventional sulfuric acid-based electrolyte with PEG-Cl−-SPS.
Conclusions
In this study, the characteristics of citric acid and the interaction between SPS and adsorbed citrate species were investigated by electrochemical impedance measurements. It was observed that citric acid can act as both a supporting electrolyte and a suppressor. The citrate species is capable of adsorbing to Cu surfaces, suppressing the electroreduction of Cu. Furthermore, interactions with SPS resulted in the same behavior as for the conventional suppressor PEG-Cl−. Using this suppressing behavior, Cu superfilling was achieved with an electrolyte consisting of copper sulfate, citric acid, chloride ion, and SPS, without the need for any polymer-like suppressor. Although it is hard to separate the effects of complexation of citrate with Cu ions and the adsorption of citrate on the suppression of Cu reduction kinetics, the interaction of citrate species with SPS on Cu surface and the observed superfilling phenomenon clearly supported the dominant effects by the adsorption of citrate species on Cu surface. In short, this study suggests a new electrolyte composition for Cu superfilling that is simpler than the older, conventional one.
Acknowledgments
This research was supported by the MOTIE(Ministry of Trade, Industry & Energy (10048778) and KSRC(Korea Semiconductor Research Consortium) support program for the development of the future semiconductor device. This research was also supported by Basic Science Research Program through the National Research Foundation of Korea (NRF) funded by the Ministry of Education, Science and Technology (2012R1A1A1004731).