Abstract
A platinum coating on an ultrathin InN resistive gas sensor was fabricated for the selective sensing of ammonia and acetone gas for liver malfunction and diabetes applications by using a temperature modulation technique. We use a cyclic temperature profile in the InN gas sensor heater, where the temperature varies from 200°C to 0°C and from 0°C to 200°C in increments of 50°C. Therefore, a different current variation response is measured on an InN epilayer for 5 ppm ammonia and 5 ppm acetone gas, respectively, because ammonia and acetone gas behave differently in the cyclic temperature profile. When ammonia and acetone gas are exposed in background air, the variation in the response of the current in different temperature regions is given as 2.5% for acetone gas and 7.85% for ammonia gas between 100°C to 150°C, and 12% for acetone gas and 8.85% for ammonia gas between 150°C to 200°C. Therefore, the temperature region 100°C to 150°C is suitable for selectively sensing ammonia gas for determining liver malfunction. The temperature range between 150°C to 200°C is suitable for selectively sensing acetone gas for the diabetes monitoring applications.
Export citation and abstract BibTeX RIS

This is an open access article distributed under the terms of the Creative Commons Attribution 4.0 License (CC BY, http://creativecommons.org/licenses/by/4.0/), which permits unrestricted reuse of the work in any medium, provided the original work is properly cited.
Recently, the analysis of exhaled breath VOCs in human beings using gas sensor technology is in high demand for medical diagnosis applications because exhaled breath contains more than 3000 VOCs.1 The concentration profiles of exhaled breath VOCs vary from the sub-ppm to the ppb range for healthy humans.2,3 The concentration profile of a specific exhaled VOC abnormally increases for a specific disease and is called a biomarker,4,5 for example, acetone for diabetes.5–7 The concentration of acetone in healthy people ranges from 0.3 to 0.9 ppm and for diabetic patients exceeds 1.8 ppm.8–10 Trimethylamine increases for uremic patients,11 and ammonia increases in patients with liver malfunctions.12 The concentration profile of ammonia in healthy people is < 0.278 ppm and for liver malfunction patients ranges from 0.278 to 5 ppm.12 Therefore, the concentration profile of breath biomarkers is directly correlated to the physical condition of a human patient. Previously, there have been many techniques available to detect liver malfunction and diabetes in a patient, such as blood tests and stool tests. Blood analysis is quite a stressful and time-consuming process for patients. Other analytical instruments, such as GC-MS and SIFT-MS are available for breath analyses. These analytical instruments are large and instrument operation is complex. Therefore, these analytical instruments cannot be used as a portable sensor for breath analysis. Metal oxide semiconductor (MOS) based gas sensors open a new era for the noninvasive detection of exhaled breath VOCs, such as the gas sensing properties of In2O3/Au nanorods for the detection of volatile organic compounds in exhaled breath.13 Mobile sensors quickly and selectively measure the ammonia gas component of breath.14 The selective sensing of NH3 by Si-doped α-MoO3 for breath analysis has been used.15 Breath analysis by nanostructured metal oxides as chemo-resistive gas sensors has also been used.4 The selective detection of acetone and hydrogen sulfide for the diagnosis of diabetes and halitosis using SnO2 nanofibers functionalized with reduced graphene has also been used.16 The main drawback of MOS-based gas sensors is a high operating temperature region (300−500°C), which is not appropriate for a portable sensor for breath analysis in real-time applications. Recently, an III-V compound semiconductor material has been used for gas sensing applications, such as investigating of the performance of HEMT-based NO, NO2 and NH3 exhaust gas sensors for automotive antipollution systems.17 Gas sensitive GaN/AlGaN-heterostructures18 and the ammonia sensing properties of a Pt/AlGaN/GaN Schottky diode19 have also been used. Here, we use an ultrathin (∼ 10 nm) InN epilayer for gas sensing applications. Because an ultrathin InN epilayer has exceptional electronic properties, such as excellent electron transport properties (mobility > 1000 cm2/V.s), an energy bandgap that lies between 0.6 and 0.7eV, and a high electron density of approximately 1 × 1018 cm−3 for an undoped InN epilayer,20 there is much electron accumulation within a few nanometers of the InN surface, with a sheet density of 1013 cm−2, which has been confirmed by various experimental technologies, such as C-V profiling and high-resolution electron-energy-loss spectroscopy.21–25 Therefore, the sensitivity of an ∼ 10 nm InN epilayer to ammonia and acetone gas is higher because ammonia and acetone gas are easily adsorbed and diffused across the ∼ 10 nm InN epilayer and modulate the conductivity of the InN epilayer. When the thickness of the InN epilayer increases, the sensitivity of the InN epilayer is reduced.26 Variations in the growth of the InN epilayer thickness affects heating of the material because a thick InN epilayer will take a longer time to reach the maximum temperature than a thin InN epilayer. Therefore, the layer thickness skews the sensitivity of the InN epilayer. The InN gas sensor has a lower detection limit of < 0.2 ppm at 200°C. Our lab has previously published a report on InN gas sensors, such as a sub-ppm acetone gas sensor for diabetes detection using 10 nm thick, ultrathin InN FETs,27 A semiconductor gas system for the healthcare industry to detect liver disease using an ultrathin InN-based system.28 InN-based anion selective sensors have been used in aqueous solutions,29 but the selectivity of the Pt-coating on an InN gas sensor was very poor. There are many techniques available to improve the selectivity of the gas sensor, such as synthesizing specific materials that have a high sensitivity to the target gas and zero cross-sensitivity to an interfering gas. Other method include the sensor array technique,30–33 and the temperature modulation technique.34,35 The temperature modulation technique is a very effective method for improving the selectivity of a single InN gas sensor with lower power consumption than the sensor array technique because the InN epilayer has a large accumulation of electrons within a few nanometers of the InN epilayer. This leads to a high sensitivity toward exhaled breath VOCs21 compared to other thin film devices, which have lower sensitivity,36 because these thin film devices have no charge accumulation phenomenon that occurs. Therefore, the current variation response of the InN epilayer is much higher than for other thin film devices with the same structure, for a given temperature profile. Therefore, in this study, we use a temperature modulation technique to improve the selectivity of a Pt-coating on ultrathin InN as a dual gas sensor for liver malfunction as well diabetes diagnosis. We give a cyclic temperature profile to the heater of the InN gas sensor, and the temperature profile of the InN epilayer varies in the same manner as the temperature profile of the heater. Every temperature region of the cyclic temperature profile acts as a different virtual sensor. Therefore, each temperature region gives a different current variation response34,35 for 5 ppm ammonia and 5 ppm acetone gas.
Temperature Modulation
The temperature modulation technique is an effective method for improving the selectivity of the gas sensor. We are using a cyclic temperature profile to improve the selectivity of a Pt-coating on an ultrathin InN gas sensor for measuring exhaled breath ammonia and acetone gas for liver malfunction and diabetes applications. In this technique, we have applied the cyclic temperature profile to the heater of an InN gas sensor. The temperature profile of the InN epilayer will vary in the same manner as the temperature profile of the heater. Each temperature region of the temperature profile cycle acts as a virtual sensor. Therefore, each virtual sensor gives its own response to variation in current.37 Therefore, the InN gas sensor can sample several temperatures and treats each data point as a separate virtual sensor. The cyclic temperature profile ranges from 200°C to 0°C, and 0°C to 200°C in increments of 50°C to the heater of InN gas sensor. When we choose much finer steps less than 50°C, the change in the current variation response of the ultrathin InN gas sensor negligible because the current response of the InN gas sensor is given by Equation 1. The current variation response ( ) is directly proportional to the change in temperature (dT), given by Equation 2.38
![Equation ([1])](https://content.cld.iop.org/journals/2162-8777/7/7/Q3221/revision1/d0001.gif)
After differentiation of Equation 1, we obtain Equation 2.
The current variation response is given by:
![Equation ([2])](https://content.cld.iop.org/journals/2162-8777/7/7/Q3221/revision1/d0002.gif)
![Equation ([3])](https://content.cld.iop.org/journals/2162-8777/7/7/Q3221/revision1/d0003.gif)
![Equation ([4])](https://content.cld.iop.org/journals/2162-8777/7/7/Q3221/revision1/d0004.gif)
From Equation 2, the current variation response has a smaller change for smaller temperature steps. Therefore, we used larger temperature steps (50°C) to distinguish the current variation response. Additionally, the minimum temperature was measured using a K-type thermocouple from a heater at room temperature. Because the temperature of the gas chamber unit comprises an InN gas sensor is the same as the room temperature, the temperature measured by the thermocouple from the heater surface is initiated at room temperature, which is not same as the input temperature profile (50 to 0°C and 0 to 50°C) given to the heater as shown in Figure 1. When 5 ppm ammonia and 5 ppm acetone are exposed to the InN gas sensor, we obtain a different current variation response in each temperature region. Because the current response of the InN sensing layer exponentially varies with the temperature profile and potential barrier,38 the model by which we predict the current response varies with temperature and surface potential shown by Equation 1.38
![Equation ([5])](https://content.cld.iop.org/journals/2162-8777/7/7/Q3221/revision1/d0005.gif)

Figure 1. Cyclic Temperature profile applies to the heater of the InN gas sensor device.
Vs is a potential barrier, VO is the voltage applied to the InN sensor, G0 = gqμSND , is referred to as the pre-exponential factor geometry, g is a constant determined by the semiconductor geometry, q is the charge of the electronics, μS is the mobility of electrons, and ND is the density of the donor.
Gas Sensor Device
The gas sensing device comprises an ultrathin (∼10 nm) InN sensing layer with a pair of electrodes composed of an Au/Al/Ti (50 nm /200 nm/50 nm) composite grown on a sapphire substrate along with a 500 nm AlN buffer layer, as shown in Figure 2a. The Au/Al/Ti composite electrode forms an ohmic contact with InN epilayer, which is used for measuring the current of the InN conductive channel in between the electrodes. A very thin (∼10 nm) Pt film is deposited between the two electrodes on the InN epilayer, as shown in Figure 2a. A platinum catalyst has been used rather than other catalytic metals such as silver and gold because Pt has a high melting point, and Pt has the ability to interact with poisons such as sulfur compounds that are limited to the metal surface. Pt has efficiently been recycled.39,13,14 Due to the sensitivity the Pt layer on the InN epilayer, the rate of reaction, response, and recovery time are improved. To operate the InN gas sensing device at the higher operating temperature of 200°C, the heater in the serpentine structure is made of an aluminum film with a thickness of 200 nm on a glass substrate as shown in Figure 2b. The ultrathin InN sensing device is attached to the heater using a thermally conductive silicone adhesive (Dow Corning SE4485, 2.5 W/m-K) that supports heat conduction. In addition, the heater, along with the InN sensing device, is inserted into a hole in the PCB substrate with four bonding pads. The heater is fixed with a UV curing adhesive on the two sides in contact with the PCB substrate. The aluminum pads of the heater and the electrode metal (Au/Al/Ti) of the InN sensing device are connected to the bonding pads of the PCB substrate through aluminum wires, as shown in Figure 2c. The heater can withstand temperatures up to 300°C. When the temperature profile of the heater increases, the temperature profile of the InN epilayer also increases.

Figure 2. (a) Platinum coated atop ultrathin (∼ 10 nm) InN gas sensor device. (b) The heater of the serpentine structure (c) The Assembly of the sensing device, heater, and PCB substrate.
The area of the Pt covering on the InN epilayer is 125 × 104μm2, when the area of the platinum (Pt = 125 × 104μm2) is applied on the InN epilayer between two electrodes, as shown in Figure 2a. This improves the sensitivity and response time of the gas sensor when the area of the platinum covering on the InN epilayer between the two electrodes is < 125 × 104 μm2. Therefore, the sensitivity and response time of the InN gas sensor decays. This is because when ammonia and acetone are exposed on a −10 nm Pt-atop InN epilayer, ammonia and acetone are adsorbed at adsorption sites and dissociated into hydrogen atoms at the surface of a thin Pt catalytic metal film.40–44 Further, part of the dissociated hydrogen atoms diffuse and are trapped at the interface of Pt catalytic metal and InN epilayer to form the dipole layer at the interface.45 This leads to change the conductivity of the InN epilayer. Therefore, the sensitivity and response time of the InN gas sensor will be improved. When the area of platinum on the InN epilayer is reduced, the number of adsorption sites is reduced. Therefore, adsorption and dissociation of hydrogen atoms from ammonia and acetone is reduced. Therefore, a lower number of dissociated hydrogen atoms will diffuse and be trapped at the interface of the Pt and InN epilayer, which will lead to a lower number of the dipole layer at the Pt-InN interface. Therefore, sensitivity and response time of the InN gas sensor device will decay.
Device Fabrication Process
The fabrication process of InN epilayer on the sapphire substrate and fabrication of the heater on the glass substrate is performed separately. In this fabrication process, the gas sensor is not mounted on the heater because both processes are independent of each other. The ultrathin InN epitaxial growth was conducted in a plasma-assisted molecular-beam epitaxy (PAMBE) system, equipped with a radio-frequency generated nitrogen (N2) plasma source. The elemental indium sources are generated by the thermal evaporation of pure source materials. The base pressure of the MBE system was maintained at an ultrahigh vacuum (UHV) of ∼1 × 10⁻⁹ Torr during deposition. The nitrogen plasma has high reactivity with the evaporated indium atom flux on the sapphire substrate surface that allows InN growth at low temperature. Two-inch sapphire wafers were employed as initial substrates. The thickness of the buffer layer of AlN was 500 nm for the InN that was deposited prior to the growth of InN, to overcome the large lattice mismatch between InN (0001) and Al2O3 (0001). For the growth of InN, a low-temperature AIN buffer was grown at 350°C. This was followed by high-temperature InN growth at 520°C. The fabrication of the heater in the serpentine structure is made from a 200 nm-thick aluminum film on a glass substrate that was made using electron beam epitaxy. The fabrication process for the heater is given in Figure 3a, and the fabrication processes for the InN epilayer layer is given in Figure 3b.
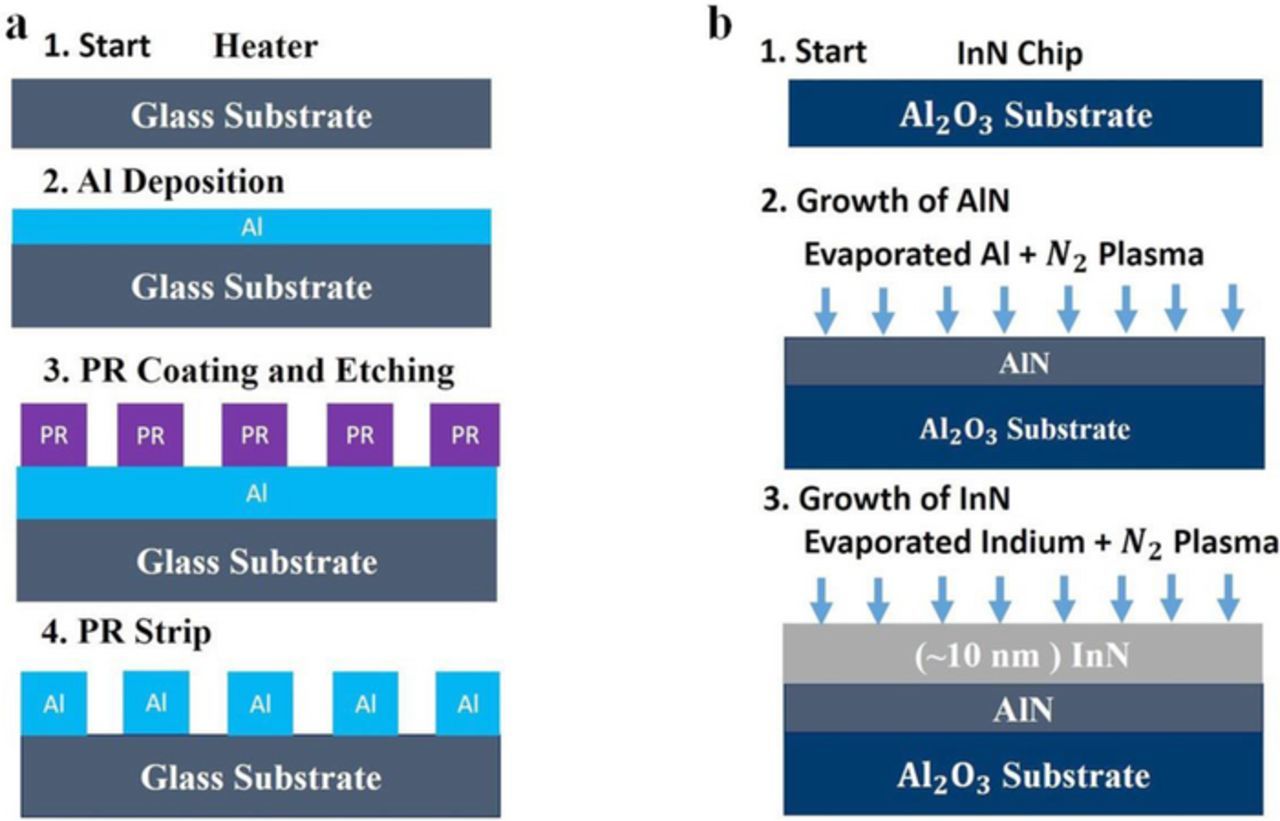
Figure 3. (a) Demonstrate the fabrication process of the heater (b) Demonstrate the fabrication process of the InN epilayer.
Gas Chamber System
The measurement setup of the gas chamber system is categorized into three groups. The gas supply unit, the temperature unit, and the current measurement unit are shown in Figure 4. The gas supply unit is mainly composed of the three gas channels, three mass flow controllers (MFCs) and a gas mixing unit. In the gas chamber testing unit, a single way valve, a mechanical pump and the MFCs are connected to a computer via serial ports for the programmable control and acquisition of the flow rate.

Figure 4. Gas chamber system comprised of gas supply unit, gas chamber unit, temperature control unit, current measurement unit.
The temperature control unit comprises a K-type thermocouple data acquisition system (Fluke 2640 A) and a DC power supply (Agilent 6654 A, 4.5 digits, and maximum power 60 V/9A). The DC power supply was controlled by a computer using the GPIB interface, which is employed to apply the voltage to the heater surface, as shown in Figure 4. The temperature of the heater is measured by the data acquisition system. To measure the precise temperature of the heater surface, a conductive adhesive is pasted around the contact points between the thermocouple and the heater surface in order to quickly reach the equilibrium temperature. The measured temperature is transferred to the computer via a network port and is used to feed back control of the voltage applied to the heater to maintain the set-point temperature. The precision of the temperature control unit is ± 0.1°C, and the accuracy of the gas sensor is ± 0.1 ppm. As far as radiative losses are concerned, the InN gas sensor cannot detect the temperature variations due to radiative losses from the heater. The current measurement unit comprises a digital multimeter (Kethley Model 2001,7.5 digits) and a DC power supply (Agilent 6654A, 4.5 digits), with a maximum power 60 V/9 A, which were serially connected to the gas sensor in the gas chamber through an electrical feed-through. During testing, the DC power supply provided a constant DC power supply with a constant DC bias, and the current was measured using a digital multimeter. The digital multimeter transferred the measured data to the computer via the GPIB interface.
Sensing Mechanism
When the Pt-coated InN epilayer came into contact with background air as shown in Figure 5, due to the presence of oxygen in the air, a thin layer of indium oxide was formed on the Pt-coated InN epilayer because of the adsorption of oxygen on the InN surface. Adsorbed oxygen ions act as an acceptor and withdraws electrons from the InN surface conduction band. Therefore, the conductivity of InN sensing layer was reduced. In addition, oxygen vacancies act as donors, and these donors are responsible for increasing the conductivity of the InN sensing layer, as adsorbed oxygen can ionize into many forms, such as O−2, O− and O2 −. In this ionosorbtion process, the doubly charged adsorbed oxygen O2 − is not stable when doubly charged oxygen ions do not react immediately or are trapped by oxygen vacancies. O2 − is not expected to be present as an ionosorbed oxygen species.46 At room temperature, equilibrium for the reaction on the InN epilayer is given by Equation 5.
![Equation ([6])](https://content.cld.iop.org/journals/2162-8777/7/7/Q3221/revision1/d0006.gif)

Figure 5. Explain the sensing mechanism of ammonia and acetone gas on the InN epilayer in air background under the cyclic temperature profile given to the heater of InN gas sensor device.
The above reaction, given by Equation 5, occurred very slowly. When the temperature increases, the reaction is given by Equation 6.
![Equation ([7])](https://content.cld.iop.org/journals/2162-8777/7/7/Q3221/revision1/d0007.gif)
When the temperature of the InN epilayer is above the 150°C, the ionosorbtion process for O− dominates.47 The reaction rate of O− is greater than the reaction rate of O2 −.48 Therefore, when ammonia and acetone gas are exposed on the −10 nm Pt-coating on an InN epilayer in an air background, ammonia and acetone gas are adsorbed on the thin Pt film and dissociated into atomic hydrogen. Hydrogen atoms diffuse through the Pt film and are trapped at the interface of the Pt-InN epilayer to form a dipole layer. Therefore, the modulation of the electron accumulation at an InN epilayer is much higher because the Pt film is in direct contact with the InN film.16,19,40,49–55 The following reaction will take the place of ammonia and acetone gas adsorption on the Pt-coated InN layer in an air background. The reaction mechanism of NH3 in an air background is given by Equation 7.19,40,52,56
![Equation ([8])](https://content.cld.iop.org/journals/2162-8777/7/7/Q3221/revision1/d0008.gif)
The reaction mechanism for acetone is given by Equation 8.16,53,54
![Equation ([9])](https://content.cld.iop.org/journals/2162-8777/7/7/Q3221/revision1/d0009.gif)
Because of the above sensing mechanism on the thin Pt-coating on an InN epilayer, the rate of reaction, sensitivity, response, and recovery time will improve.
Results and Discussion
We use the temperature modulation technique to enhance the selectivity of a Pt-coating on an InN gas sensor for ammonia and acetone gas,for liver malfunction and diabetes applications. Here, we give cyclic temperature profiles for the heater of an InN gas sensor. The cyclic temperature profile varies from 200°C to 0°C to 200°C, at a change rate of 50°C with respect to the time. The function of the heater is to heat the InN epilayer to enhance the sensing response for samples composed of 5 ppm ammonia and 5 ppm acetone gas. Due to direct contact of the InN epilayer with the heater, the temperature profile of the InN epilayer will vary according to the temperature profile given to the heater of the InN gas sensor. Therefore, when a 5 ppm ammonia gas and 5 ppm acetone gas in an air background are exposed on the InN epilayer under the cyclic temperature profile, we will obtain a different current response in a different temperature region because the current response of the InN gas sensor exponentially varies with the temperature, as given by Equation 1. Therefore, when the temperature of the InN epilayer increases, the current response of the InN also increases. When the temperature of the InN epilayer decreases, the current response of the InN also decreases. Therefore, we will find different current variation responses in different temperature regions as given by Equation 2. The current response for 5 ppm ammonia and 5 ppm acetone gas under the cyclic temperature profile is given in Figure 6a and in Figure 6b, respectively.

Figure 6. (a) Explain the current response for 5 ppm ammonia gas in cyclic temperature profile to the heater of the InN gas sensor. (b) The current response to 5 ppm acetone gas in cyclic temperature profile to the heater of the InN gas sensor.
Current Variation Response for Ammonia Gas 

The sensitivity of the InN gas sensor measured by the current variation ratio under the cyclic temperature profile is applied to the InN gas sensor heater. The current response of the InN epilayer exponentially varies with temperature, as given by Equation 1. As the temperature profile of the InN epilayer increases, the current response of the InN also increases in the same manner. Therefore, we obtain different current variation responses in different temperature regions for 5 ppm ammonia gas in air. The current variation ratio is a significant factor for measuring the selectivity of the InN gas sensor.
The cyclic temperature profile given to the InN gas sensor heater decreases from 200°C to 150°C to 100°C to 50°C to 0°C. Therefore, the current variation ratio of the InN gas sensor also decreases in the same manner. Therefore, the current variation ratio in each temperature region is given by: ( for 200°C to 150°C as given in Figure 7a, (
 for 150°C to 100°C as given in Figure 7b, (
 for (100°C to 50°C) as given in In Figure 7c, and (
 for (50°C to 0°C) as given in Figure 7d.

Figure 7. (a) Current variation response in (200–150°C). (b) Current variation response in (150–100°C). (c) Current variation response in (100–50°C). (d) Current variation response (50–0°C) for the 5 ppm ammonia gas in air background.
The cyclic temperature profile given to the heater of the InN gas sensor increases from 0°C to 50°C to 100°C to 150°C to 200°C. Therefore, the current variation ratio of the InN gas sensor also increases in the same manner. Therefore, the current variation ratio in each temperature region is given in Figure 8a ( for 0°C to 50°C, in Figure 8b (
 for 50°C to 100°C, in Figure 8c (
 for 100°C to 150°C, and in Figure 8d (
 for (150°C to 200°C). Therefore, the current variation response varies in the same manner that the temperature profile of the heater varies.
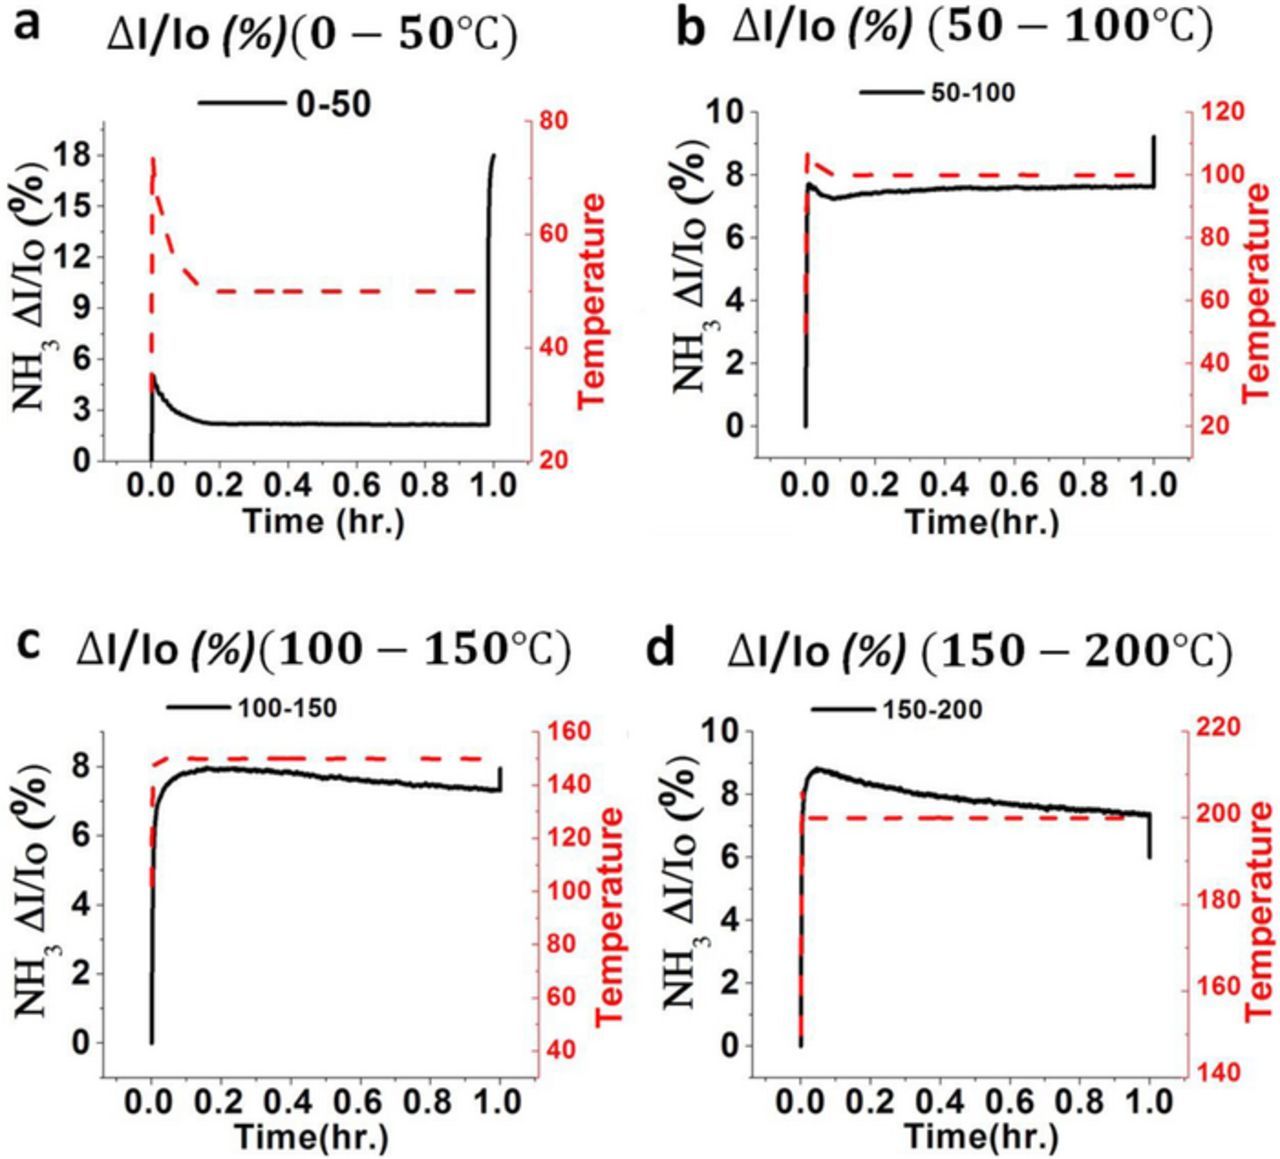
Figure 8. (a) Current variation response in (0–50°C). (b) Current variation response in (50–100°C). (c) Current variation response in (100–150°C). (d) Current variation response (150–200°C) for the 5 ppm ammonia gas in air background.
Current Variation Response for Acetone Gas

The sensitivity of the InN gas sensor measured by the current variation ratio under the cyclic temperature profile was applied to the heater of the InN gas sensor. The current response of InN epilayer exponentially varied with temperature, as shown in Equation 1. As the temperature profile of the InN epilayer increased, the current response of the InN also increased in the same manner. Therefore, we will have obtained different current variation responses in different temperature regions for 5 ppm acetone gas in air. The current variation ratio is a significant factor for measuring the selectivity of the InN gas sensor. The cyclic temperature profile given to the heater of the InN gas sensor decreases from 200°C to 150°C to 100°C to 50°C to 0°C. Therefore, the current variation ratio for each temperature region is given in Figure 9a ( for 200°C to 150°C, in Figure 9b (
 for 150°C to 100°C, in Figure 9c (
 for 100°C to 50°C, and in Figure 9d (
 for 50°C to 0°C.

Figure 9. (a) Current variation response in (200–150°C). (b) Current variation response in (150–100°C). (c) Current variation response in (100–50°C). (d) Current variation response (50–0°C) for the 5 ppm acetone gas in air background.
The cyclic temperature profile given to the heater of the InN gas sensor increases from 0°C to 50°C to 100°C to 150°C to 200°C. Therefore, the current variation ratio of the InN gas sensor also varies in the same manner. Therefore, the current variation ratio in each temperature region is given in Figure 10a ( for 0°C to 50°C, in Figure 10b (
 for 50°C to 100°C, in Figure 10c (
 for 100°C to 150°C, and in Figure 10d (
 for 150°C to 200°C.

Figure 10. (a) Current variation response in (0–50°C). (b) Current variation response in (50–100°C). (c) Current variation response in (100–150°C). (d) Current variation response (150–200°C) for the 5 ppm acetone gas in air background.
From Table I, we obtain different current variation responses for the 5 ppm ammonia gas and 5 ppm acetone gas over the cyclic temperature profile region, for example, ( for 5 ppm acetone gas and (
 for the 5 ppm ammonia gas in the 150°C to 200°C range, and (
 for 5 ppm acetone gas and (
 for the 5 ppm ammonia gas in the 100°C to 150°C range. Therefore, the temperature region between 100°C and 150°C is suitable for the selective sensing of ammonia gas for liver malfunction, and the temperature region between 150°C and 200°C is suitable for the selective sensing of acetone gas for diabetes detection.
Table I. Shows the percentage change in current variation response for the 5 ppm ammonia and 5 ppm acetone gas over the cyclic temperature profile given to the heater of the InN gas sensor.
| Temperature | Ammonia | Acetone | Concentration |
|---|---|---|---|
| (°C) | (% ) ) |
(% ) ) |
(ppm) |
| 200–150°C | 2 | −0.3 | 5 |
| 150–100°C | 0.6 | −0.25 | 5 |
| 100–50°C | 0.3 | −0.125 | 5 |
| 50–0°C | 0.25 | 0.04 | 5 |
| 0–50°C | 4.5 | −0.5 | 5 |
| 50–100°C | 7.5 | −0.75 | 5 |
| 100–150°C | 7.85 | 2.5 | 5 |
| 150–200°C | 8.75 | 12 | 5 |
The Detection Limit of the InN Gas Sensor
When 0.2 ppm and 0.8 ppm ammonia is exposed to the Pt-coated ultrathin InN gas sensor, the current response for 0.2 ppm and 0.8 ppm NH3 gas is shown in Figure 11.

Figure 11. Current response for the 0.2 ppm and 0.8 ppm NH3.
The current variation response for the 0.2 ppm NH3 and 0.8 ppm NH3 is 1.49% and 1.76%, respectively. Therefore, Pt-coated ultrathin InN gas sensors have lower detection limits ⩽ 0.2 ppm NH3 in Figure 12, which is suitable for the detection of the liver malfunctions and diabetes in the exhaled breath of patients.

Figure 12. The current variation response for the 0.2 ppm and 0.8 ppm NH3.
In this work, the selective detection of ammonia with a signal-to-noise ratio of ( ) for liver malfunction between 100 and 150°C, and the selective detection of acetone with a signal-to-noise ratio of (
 ) for diabetes between 150 and 200°C, was achieved. However, MOS-based gas sensors detect ammonia and acetone gas in a higher temperature region (300–500°C).
In previous works, metal oxide-based gas sensors detected acetone and ammonia gas in the temperature range between 250 and 500°C. Which is not suitable for real applications. However, a Pt-coating on an ultrathin InN gas sensor can detect ammonia gas between 100 and 150°C and acetone gas between 150 and 200°C, with detection limits of ⩽ 0.2 ppm, as shown in Table II. This method can be used as a medical diagnostic tool to detect ammonia and acetone gas in exhaled breath for diagnosing liver malfunction and diabetes.
Table II. Comparison of InN gas sensor with the prior work.
| Material | Temperature | Biomarker | Detection limit |
|---|---|---|---|
| Au/In2O3 Nanorod | 250°C | Acetone13 | 100 ppb |
| Si-doped α-MoO3 | 500°C | NH315 | 400 ppb |
| SnO2 nanofiber functionalized with graphene oxide Nanosheet | 350°C | Acetone16 | 100 ppb |
| Si:WO3 GAS SENSOR | 325–400°C | Acetone57 | 20 ppb |
| Pt- coated InN | 100–150°C | NH3 | ⩽ 200 ppb |
| Pt-coated InN | 150–200°C | Acetone | ⩽ 200 ppb |
Conclusions
The percentage change in the current variation response for 5 ppm ammonia gas is 3.14-fold larger than the percentage change in the current variation response for 5 ppm acetone gas in the temperature region of 100 to 150°C. The percentage change in the current variation response for 5 ppm acetone gas is 1.3-fold larger than the percentage change in the current variation response for 5 ppm ammonia gas in the temperature region of 150 to 200°C. Therefore, the temperature region of 100°C to 150°C is suitable for the selective sensing of the ammonia gas for diagnosing liver malfunction, and the temperature region 150°C to 200°C is suitable for the selective sensing of acetone gas for diagnosing diabetes. The lower detection limit of the Pt-coated InN gas sensor is below 0.2 ppm for ammonia gas. Therefore, Pt-coated InN gas sensors are suitable for diagnosing liver malfunction as well as diabetes in exhaled breath detection for medical applications.
Acknowledgment
This work was partly supported by the Ministry of science and technology (MOST) through the Project No.: MOST 104-2221-E-007 -018 -MY3.
ORCID
Sujeet Kumar Rai 0000-0003-2484-9562
J. Andrew Yeh 0000-0001-7902-6120