
Abstract
In chemical-mechanical polishing (CMP), even the soft pad asperities may, under certain conditions, generate scratches on the relatively hard surfaces being polished. In the present study, contact mechanics models of pad-induced scratching are formulated, and the effects of the hardness of the surface layers and of pad asperities as well as the interfacial friction are elucidated. Additionally, scratch-regime maps are proposed to provide criteria for scratching hard surface layers by the softer pad asperities. Furthermore, scratching indexes are introduced to predict the proportion of asperities in contact that are likely to scratch. The contact mechanics models of scratching have been validated by sliding experiments with two commercial CMP pads (Pad A and IC1000) and various thin-films (Al, Cu, SiO2, Si3N4, TiN and three low-k dielectrics) using deionized water as a "lubricant." Both the theoretical models and the experimental results show that the number of scratches increases as the scratching index exceeds 0.33. Al and Cu layers are found to be more susceptible to pad scratching due to their low hardness and high interfacial friction. The scratch-regime maps provide practical guidelines for mitigating pad scratching in CMP.
Export citation and abstract BibTeX RIS

This is an open access article distributed under the terms of the Creative Commons Attribution 4.0 License (CC BY, http://creativecommons.org/licenses/by/4.0/), which permits unrestricted reuse of the work in any medium, provided the original work is properly cited.
Chemical-mechanical polishing (CMP), which employs both chemical and mechanical means to remove material from solid surfaces, is a planarization/polishing process. The CMP process is widely used in the manufacture of integrated circuits (IC), computer hard disks, optical glass, and micro-electromechanical systems (MEMS).1–5 Despite its universal usage, a persistent problem in CMP is the scratching of the surfaces being polished. As demands for metal interconnects and surface structures are becoming ever more stringent in integrated circuits, micro- and nano-scale scratching during CMP has lately emerged as a critical problem.6–8
The CMP process is carried out by rotating a wafer over a polishing pad under pressure, while chemical slurry containing hard, abrasive particles is provided at the wafer/pad interface. The basic mechanism of material removal in CMP is by "fine scratching" at the nano-scale by the abrasive particles.9–12 The nano-sized particles, 50–300 nm in diameter, "plow" the surface layer softened by chemical reactions. Such nanometer-scale scratches produce smooth, flat surfaces and thus are preferred.
During the polishing process, however, the small abrasive particles may agglomerate due to inter-particle attraction, fluctuations in slurry delivery, and so on. Scratches generated by the agglomerated particles are termed surface defects, and the width of the scratches so generated is an order of magnitude greater than that of the scratches created by individual particles. The abnormally large, hard particles, which may cut the metal interconnects in IC chips and cause malfunctioning of the microelectronic devices, have generally been considered the primary sources of scratching.13–18 To minimize particle agglomeration, and thus mitigate particle-induced scratching, particle interaction models and such practical methods as magnetically levitated centrifugal pumps have been suggested and developed.19,20
It has been recently reported, however, that scratches can also be generated without abrasive particles in the slurry, such as in "abrasive-free CMP".21,22 The experimental results show that not only the hard agglomerates but even the soft pad asperities also may scratch the relatively hard surface layers. As the rough CMP pad is pressed against a relatively smooth, flat surface layer and slid over, under certain conditions the tractions applied by the soft asperities would be large enough to initiate scratching.23 Because the width of the scratches generated by the asperities is larger compared with those by the other sources, pad scratching is expected to create far more severe defects. The scale of scratches generated by different modes of contact is illustrated in Figure 1. Despite the potential of scratching by pad asperities, however, studies on pad scratching have not been widely reported.
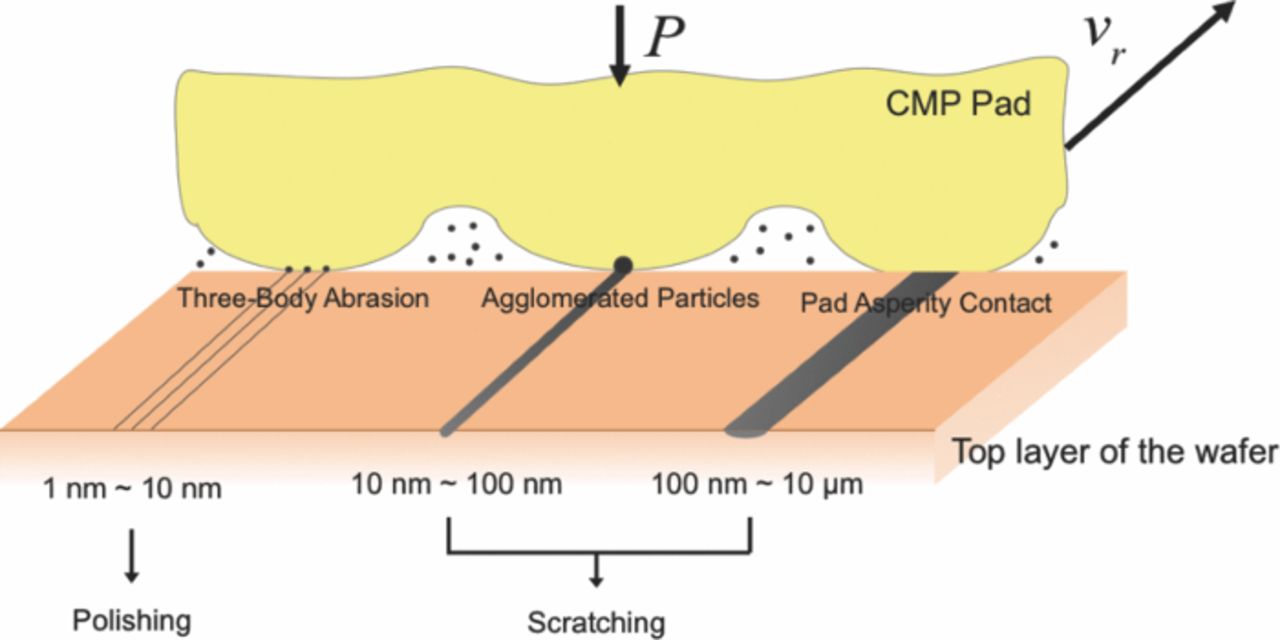
Figure 1. Contact modes and scale of scratches in CMP.
In this paper, the previous contact mechanics models22,23 elucidating the scratching of relatively hard surface layers by the softer pad asperities are reviewed and further developed. Based on the stress analysis of a single-asperity sliding contact, criteria for scratch initiation in different asperity deformation modes—elastic, at the onset of asperity yielding, elastic-plastic, and fully plastic—are first presented. In addition, scratch-regime maps for elastically and plastically deformed asperities are constructed in terms of the hardness ratio and the friction coefficient between the pad asperity and the surface layer. Then the pad scratching models are further advanced for multi-asperity contacts with exponentially distributed asperity heights. The proportion of scratching asperities is estimated in terms of scratching indexes, which characterize the effects of relative hardness and the interfacial friction on scratching.
To validate the theoretical predictions, the hardness of various thin films, Al, Cu, Si, SiO2, TiN, and low-dielectric-constant (low-k) materials, were determined by nano-indentation. Then, sliding experiments were conducted on monolithic surface layers of these materials using two CMP pads and without any abrasive particles. Furthermore, the coefficient of friction between the pad asperities and the surface layers was concurrently measured in each sliding test. The scratches generated on the surface layers were examined and compared with the theoretical predictions based on hardness and the friction coefficient.
Pad Scratching Models: Single-Asperity Sliding Contact
As a pad asperity is pressed against a smooth surface layer at a certain load, depending on the approach of distant points, δ, it deforms in different modes.24,25 If δ is very small, the asperity deforms elastically, and if δ reaches the elastic limit, δy the asperity begins to deform plastically. Past the onset of yielding, the asperity deformation is both elastic and plastic, or elastic-plastic. Finally, asperity deformation is fully plastic, the extreme case, when δ exceeds a critical value, δf–p. The average pressure in the contact area depends on δ, the asperity radius, Ra, Young's modulus, Ea, and the hardness, Ha. Moreover, as the asperity begins to slide over the surface layer, shear stresses are induced on the surface due to interfacial friction. Assuming that the tangential traction is proportional to the normal pressure at every point in the contact area, i.e., the Coulomb friction law is valid, the tangential traction is also determined by δ and the other quantities. Figure 2 shows four possible types of surface traction at a sliding contact depending on δ.
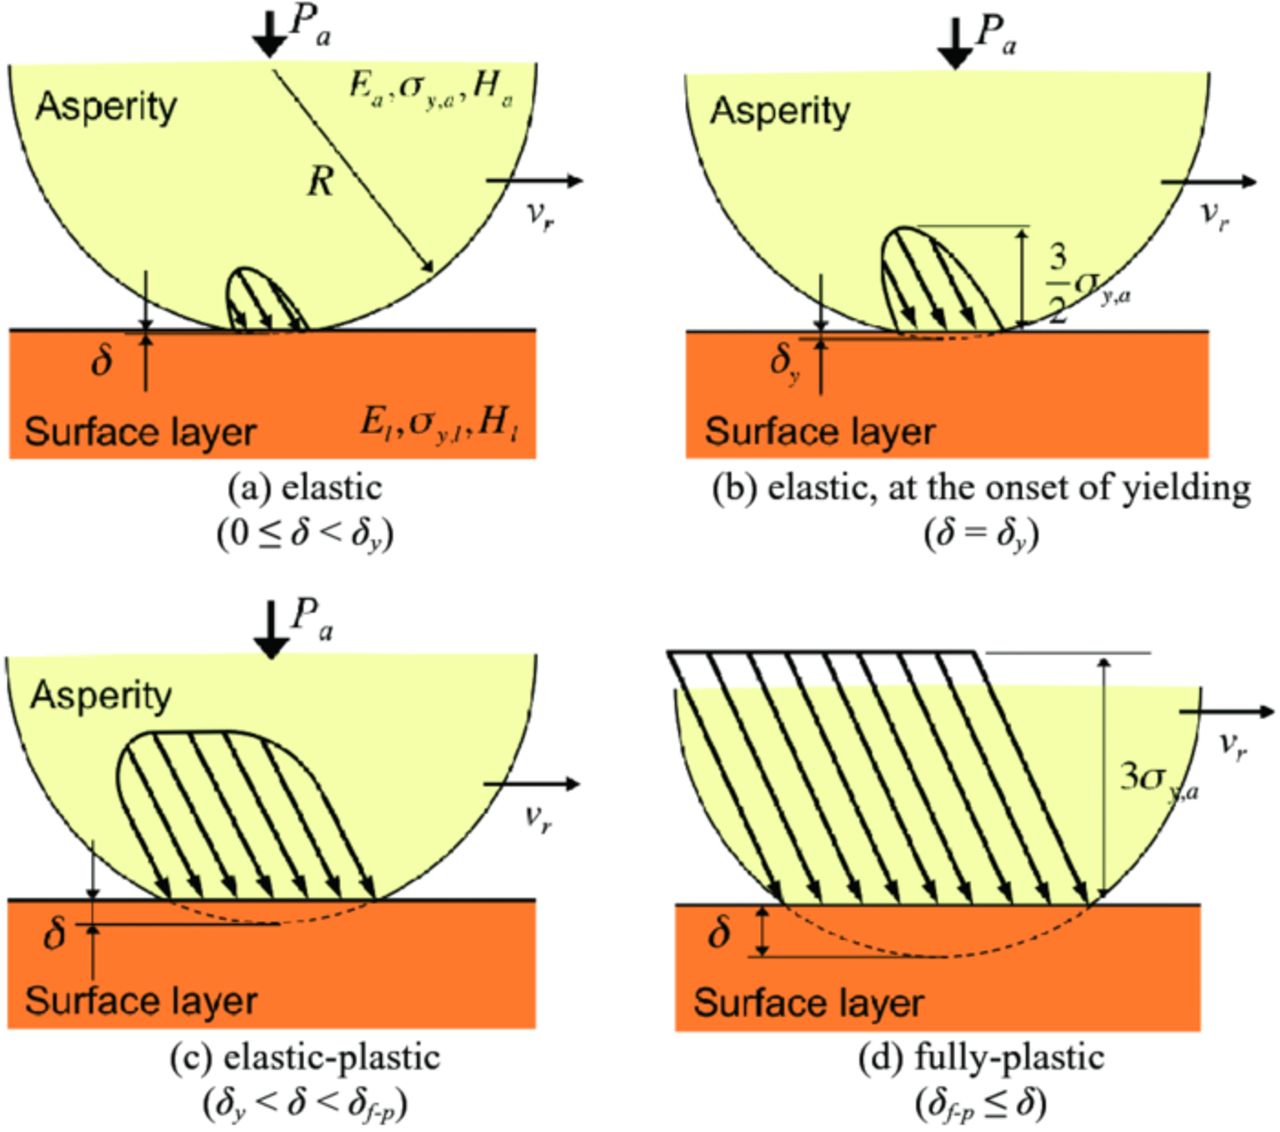
Figure 2. Surface tractions at an asperity sliding contact for different modes of asperity deformation.
The following standard assumptions are made in the development of single-asperity scratching model:
- (1)The tip of the asperity is spherical and has a radius Ra.
- (2)Both the asperity and layer materials are homogeneous and isotropic. This assumption is not strictly valid for thin-film systems, but is reasonable for estimating the stresses approximately.
- (3)Young's modulus of the surface layer being polished is much greater than that of the pad asperity (El ≫ Ea).
- (4)Strains in both the pad asperity and the surface layer are small and proportional to the corresponding stresses in the elastic case.
- (5)Furthermore, either the Tresca or the von Mises yield criterion is used to signify yielding because the difference between the two is at most 15 percent.
Average pressure at an asperity contact
If the asperity deformation is elastic, the average contact pressure, pa, is given by the Hertz solution as26
![Equation ([1])](https://content.cld.iop.org/journals/2162-8777/3/5/P169/revision1/jss_3_5_P169eqn1.jpg)
Asperity deformation reaches the elastic limit when the maximum contact pressure, po, is 1.5 times the yield strength of the asperity, σy,a.27 Then the average contact pressure is given by
![Equation ([2])](https://content.cld.iop.org/journals/2162-8777/3/5/P169/revision1/jss_3_5_P169eqn2.jpg)
From Eqs. 1 and 2, the approach of distant points at the onset of asperity yielding, δy, can be written as
![Equation ([3])](https://content.cld.iop.org/journals/2162-8777/3/5/P169/revision1/jss_3_5_P169eqn3.jpg)
Beyond the elastic limit, analysis of the pressure distribution at an asperity contact is quite complex, since the asperity deformation comprises both elastic and plastic components. When the approach of distant points exceeds another critical limit, δf–p (= Cf–pδy), however, the deformation will be fully plastic everywhere in the asperity. The pressure then will be approximately uniform in the contact and is equal to the hardness of the asperity, which is three times the yield strength.28–30 Therefore, the average contact pressure at a fully-plastically deformed asperity contact can be expressed as
![Equation ([4])](https://content.cld.iop.org/journals/2162-8777/3/5/P169/revision1/jss_3_5_P169eqn4.jpg)
Over the decades, several attempts have been made to characterize the transitional regime, elastic to fully plastic, using mathematical functions and by finite element analyzes.31–34 Zhao et al. have suggested that the mean contact pressure can be represented by a logarithmic function based on the statistical results of spherical indentations by Francis.25,35 Kogut and Etsion have analyzed the problem by the finite element method and showed that the logarithmic function better agrees with their results than the other models.36 In the logarithmic function formulation, which is adopted here for simplicity, the average pressure at an elastic-plastic asperity contact can be expressed as25
![Equation ([5])](https://content.cld.iop.org/journals/2162-8777/3/5/P169/revision1/jss_3_5_P169eqn5.jpg)
where Cf–p is defined as Cf–p = δf–p/δy.
Based on the experimental results using a spherical indenter, Johnson has proposed that the fully-plastic deformation state is reached when the asperity load is greater than 400 times the yield load.27 From the elastic analysis, where the asperity load, Pa, is given as
![Equation ([6])](https://content.cld.iop.org/journals/2162-8777/3/5/P169/revision1/jss_3_5_P169eqn6.jpg)
The approach of distant points at the onset of fully-plastic flow is 54 times that at the onset of asperity yielding; i.e. Cf–p will be at least 54.25
Average contact pressure at the onset of surface layer yielding
For frictionless or low frictional contact (0 ≤ μ < 0.3), the maximum shear stress, τmax, for the Hertzian traction distribution is below the surface and the normalized maximum shear stress, τmax/pa, is given by27
![Equation ([7])](https://content.cld.iop.org/journals/2162-8777/3/5/P169/revision1/jss_3_5_P169eqn7.jpg)
By the Tresca yield criterion, the surface layer will yield if the maximum shear stress reaches half the yield strength, σy,l. Thus, the average contact pressure at the onset of surface layer yielding, ps, under elastically deformed asperity will be
![Equation ([8])](https://content.cld.iop.org/journals/2162-8777/3/5/P169/revision1/jss_3_5_P169eqn8.jpg)
As friction increases, however, the location of maximum shear stress will no longer be below the surface but rapidly rises to the surface. It has been shown by Hamilton and Goodman that if the coefficient of friction is greater than 0.3, the location of the maximum von Mises stress also moves to the surface.37,38 Based on the closed-form, analytical solution, the normalized maximum von Mises stress, σM,max/pa, in a elastic body under Hertizian traction distribution is given by38
![Equation ([9])](https://content.cld.iop.org/journals/2162-8777/3/5/P169/revision1/jss_3_5_P169eqn9.jpg)
Although Eq. 9 depends on the Poisson's ratio of the surface layer, νl, the of the maximum von Mises from νl = 0.1 to 0.5, is not significantly different. Therefore, Eq. 9 can be simplified, for νl = 0.3, as
![Equation ([10])](https://content.cld.iop.org/journals/2162-8777/3/5/P169/revision1/jss_3_5_P169eqn10.jpg)
By the von Mises yield criterion, the surface layer will yield if the maximum equivalent stress reaches the yield strength. Then, the average asperity contact pressure at the onset of surface layer yielding will be
![Equation ([11])](https://content.cld.iop.org/journals/2162-8777/3/5/P169/revision1/jss_3_5_P169eqn11.jpg)
If the asperity deformation is fully plastic, the normal pressure distribution in the contact will be uniform. For frictionless or low-frictional contact (0 ≤ μ < 0.05), the maximum shear stress is located below the surface and the normalized maximum shear stress is given by27,39
![Equation ([12])](https://content.cld.iop.org/journals/2162-8777/3/5/P169/revision1/jss_3_5_P169eqn12.jpg)
By the Tresca yield criterion, the average asperity contact pressure at the onset of surface layer yielding, under fully-plastically deformed asperity, will be
![Equation ([13])](https://content.cld.iop.org/journals/2162-8777/3/5/P169/revision1/jss_3_5_P169eqn13.jpg)
When the coefficient of friction is greater than 0.05, Eusner has shown by finite element analysis (FEA) that the location of the maximum von Mises stress for uniform contact pressure distribution moves to the surface.23,40 Based on second-order polynomial regression of the FEA results, the magnitude of the normalized maximum von Mises stress for high friction is given by
![Equation ([14])](https://content.cld.iop.org/journals/2162-8777/3/5/P169/revision1/jss_3_5_P169eqn14.jpg)
Therefore, when the asperity deformation is fully plastic, the average contact pressure at the onset of surface layer yielding by the von Mises criterion will be
![Equation ([15])](https://content.cld.iop.org/journals/2162-8777/3/5/P169/revision1/jss_3_5_P169eqn15.jpg)
The normalized average contact pressures at the onset of surface layer yielding for both the Hertzian and the uniform traction distributions against the friction coefficient are plotted in Figure 3. In both cases the layer yields below the surface when friction coefficient is low and thus the effect of interfacial friction on layer yielding is neglegible. As the friction coefficient increases, however, the layer yields at the surface and the effect of friction then is significant.
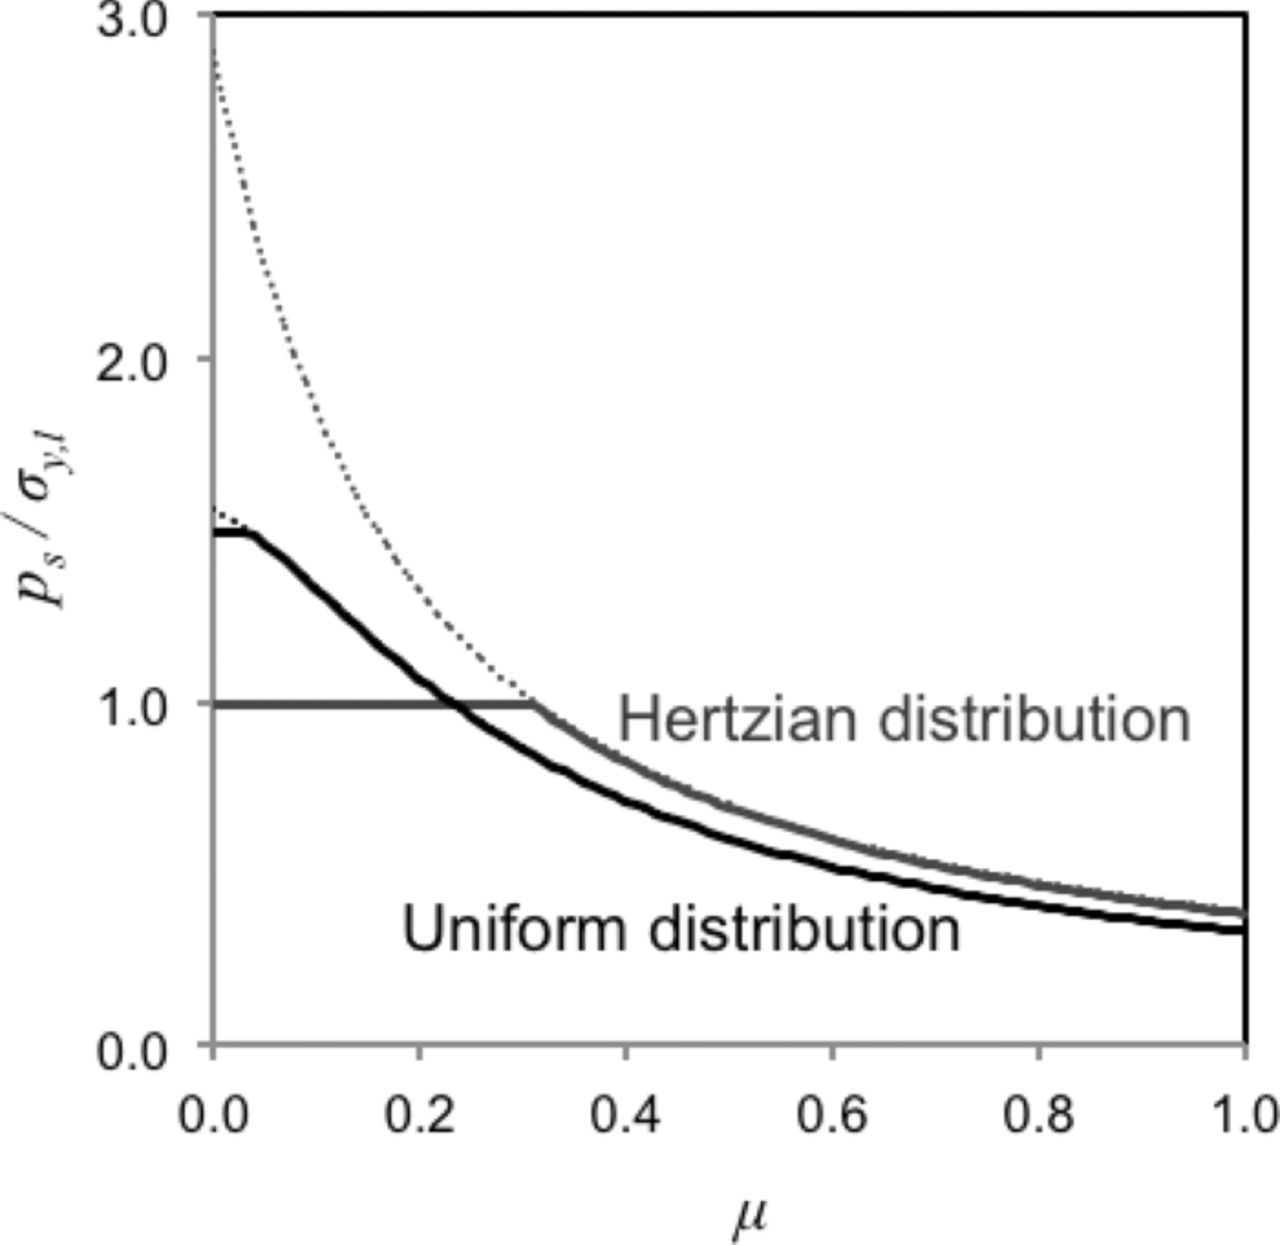
Figure 3. Normalized average asperity contact pressure at the onset of yielding of surface layer due to Hertzian and uniform pressure distributions.
When the pad asperity deformation is elastic-plastic, the pressure distribution in the contact gradually changes from Hertzian to uniform as δ increases, Figure 2c. At such arbitrary condition, determination of the stress field in the surface layer is more complicated compared with the elastic and fully-plastic cases. Assuming that the magnitudes of maximum von Mises stress and maximum shear stress lie between the values of the two extremes cases, the normalized average contact pressure at the onset of yielding in the surface layer under elastic-plastically deformed asperity, can be approximated to be the pressure distribution of Hertzian or uniform. The difference between the Herzian and uniform pressure distributions is no more than 15% when μ ≥ 0.3.
Scratching criteria
Scratching of the surface layer initiates at the onset of plastic flow, i.e., yielding is a prerequisite for the scratching of ductile materials. Therefore, a sliding asperity will scratch only if the mean contact pressure, pa, exceeds the mean contact pressure at the onset of surface layer yielding, ps. From Eqs. 1, 8 and 11, an elastically deformed asperity (0 ≤ δ < δy) will scratch the layer surface if:
![Equation ([16])](https://content.cld.iop.org/journals/2162-8777/3/5/P169/revision1/jss_3_5_P169eqn16.jpg)
where δs,e is approach of distant points at the onset of surface layer yielding under an elastically deformed asperity in sliding contact, defined by
![Equation ([17])](https://content.cld.iop.org/journals/2162-8777/3/5/P169/revision1/jss_3_5_P169eqn17.jpg)
If the asperity deformation is elastic, but at the onset of yielding (δ = δy), from Eqs. 2, 8 and 11, the surface layer will be scratched if:
![Equation ([18a])](https://content.cld.iop.org/journals/2162-8777/3/5/P169/revision1/jss_3_5_P169eqn18.jpg)
![Equation ([18b])](https://content.cld.iop.org/journals/2162-8777/3/5/P169/revision1/jss_3_5_P169eqn19.jpg)
Thus whether an asperity can scratch the surface layer depends only on the yield strengths of the asperity and the surface layer, and the friction coefficient.
If the asperity deformation is elastic-plastic (δy < δ < δf–p), but the contact pressure distribution is uniform and given by Eq. 5, from Eqs. 9 and 12 the scratch criteria can be written as
![Equation ([19])](https://content.cld.iop.org/journals/2162-8777/3/5/P169/revision1/jss_3_5_P169eqn20.jpg)
where δs,p is approach of distant points at the onset of surface layer yielding under an elastic-plastically deformed asperity in sliding contact, defined by
![Equation ([20])](https://content.cld.iop.org/journals/2162-8777/3/5/P169/revision1/jss_3_5_P169eqn21.jpg)
Finally, in the extreme case of fully plastic asperity deformation (δf–p ≤ δ), from Eqs. 4, 9 and 12, the scratch criteria can be given as
![Equation ([21a])](https://content.cld.iop.org/journals/2162-8777/3/5/P169/revision1/jss_3_5_P169eqn22.jpg)
![Equation ([21b])](https://content.cld.iop.org/journals/2162-8777/3/5/P169/revision1/jss_3_5_P169eqn23.jpg)
In this extreme case, too, the condition whether an asperity can scratch the surface depends only on the yield strengths of the asperity and of the surface layer, and the friction coefficient.
The Scratch-regime map
It may be noted that the criteria for scratching in the cases of elastic and fully-plastic deformations depend only on the mechanical properties and the interfacial friction. That is, neither criterion is explicitly a function of the radius of curvature of the asperity, although the load required to induce plasticity in the asperity depends on the radius. Because the hardness is about three times the yield strength, the scratching criteria for elastically deformed asperities can be expressed from Eq. (18) as a function of asperity-to-layer hardness ratio and the coefficient of friction as
![Equation ([22a])](https://content.cld.iop.org/journals/2162-8777/3/5/P169/revision1/jss_3_5_P169eqn24.jpg)
![Equation ([22b])](https://content.cld.iop.org/journals/2162-8777/3/5/P169/revision1/jss_3_5_P169eqn25.jpg)
Thus, a scratch-regime map can be constructed with the ratio of pad hardness to layer hardness and with the coefficient of friction as coordinates, Figure 4a.23,41 The map provides whether an elastically deformed asperity in sliding contact can scratch the surface layer. If the pad-to-layer hardness and the friction coefficient fall in the 'scratch regime,' an elastically deformed asperity, at the onset of yielding, will scratch the surface layer. An elastically deformed asperity may also scratch the surface if satisfy Eq. 16 is satisfied. However, an elastically deformed asperity, even at the onset of asperity yielding, cannot scratch the surface layer, if the conditions fall in the 'no-scratch regime.'
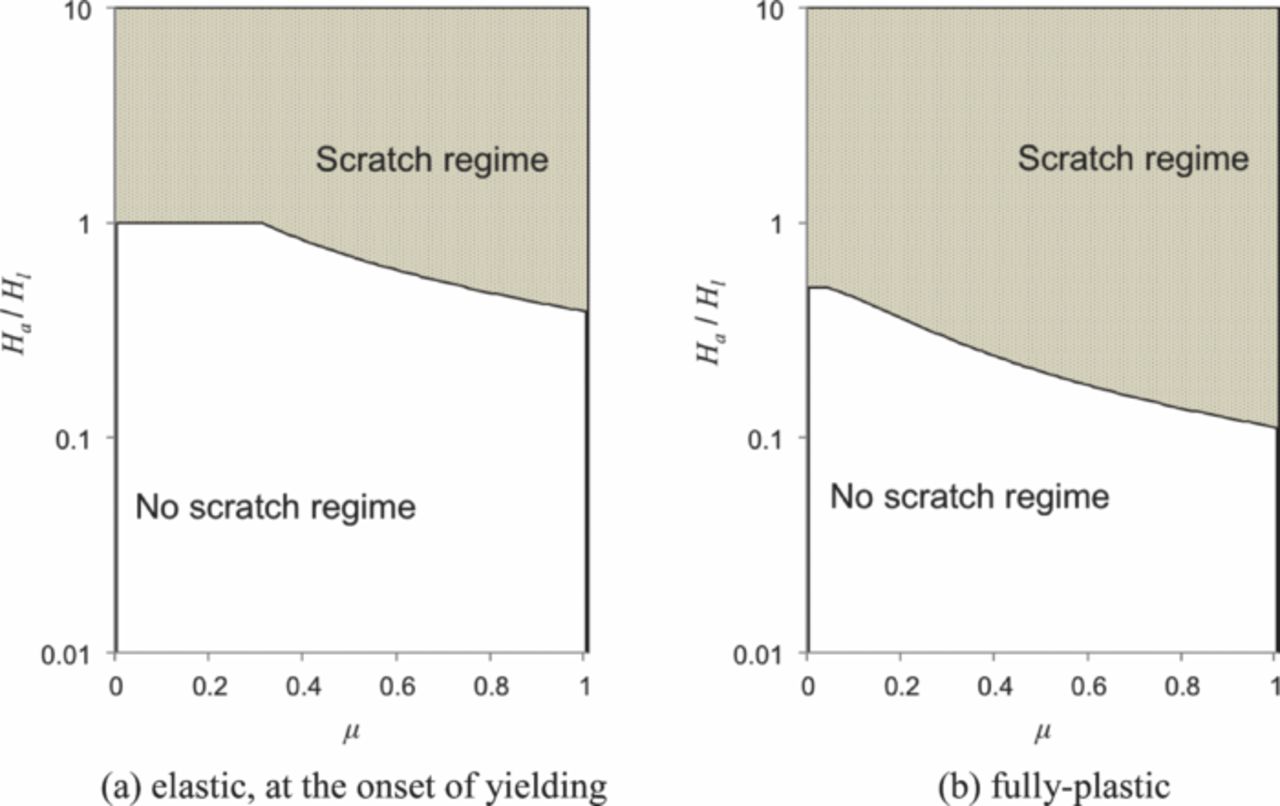
Figure 4. Scratch-regime maps for elastic, at the onset of yielding, and fully-plastic deformation modes of pad asperities.
Similarly, from Eq. (21) the scratching criteria for fully-plastically deformed asperities can be expressed as
![Equation ([23a])](https://content.cld.iop.org/journals/2162-8777/3/5/P169/revision1/jss_3_5_P169eqn26.jpg)
![Equation ([23b])](https://content.cld.iop.org/journals/2162-8777/3/5/P169/revision1/jss_3_5_P169eqn27.jpg)
and a scratch-regime map can be constructed as in Figure 4b. If pad-to-layer hardness and friction coefficient fall in the 'scratch regime,' a fully-plastically deformed asperity will scratch the surface layer. An elastic-plastically deformed asperity may also scratch the surface if Eq. 19 is satisfied. But neither an elastic-plastic nor a fully-plastically deformed asperity can scratch the surface layer, if the conditions fall in the 'no-scratch regime.'
Pad Scratching Models: Multi-Asperity Sliding Contact
In CMP, the roughness of the pad surface is typically much greater than that of the surface layer being polished. Therefore, the contact between the two surfaces can be regarded as a contact between many pad asperities with a smooth, flat surface.41 In addition to the assumptions that have already been made in single-asperity contact mechanics, the following additional assumptions are made in the scratching model of multi-asperity contacts:
- (1)All asperity tips are spherical and have identical radius, Ra.
- (2)Asperities are far apart so that interactions among asperity contacts can be neglected.
- (3)Asperity heights are exponentially distributed.
Generally, asperity heights of the CMP pads are either normally or exponentially distributed.42,43 While normal distribution may possibly give a better description of the topography, the exponential distribution has analytical advantages and gives similar results.27,44
Relative proportions of the pad asperity deformation modes
The probability density function of exponentially distributed asperity heights, ϕ(za), can be written as
![Equation ([24])](https://content.cld.iop.org/journals/2162-8777/3/5/P169/revision1/jss_3_5_P169eqn28.jpg)
If n asperities per unit area are pressed against a smooth, flat surface layer, only asperities that are taller than the separation distance, d, will be in contact, therefore, the number of asperities in contact per unit area, nc, may be written as
![Equation ([25])](https://content.cld.iop.org/journals/2162-8777/3/5/P169/revision1/jss_3_5_P169eqn29.jpg)
Figure 5 schematically shows the proportion of each asperity deformation mode depending on the approach of distant points, δ, equals to (za – d). Of the asperities in contact, the relatively short asperities, that have δ < δy, determined by Eq. 3, deform elastically, whereas the tall asperities, that have δ > δy, deform plastically—-elastic-plastic and fully plastic.
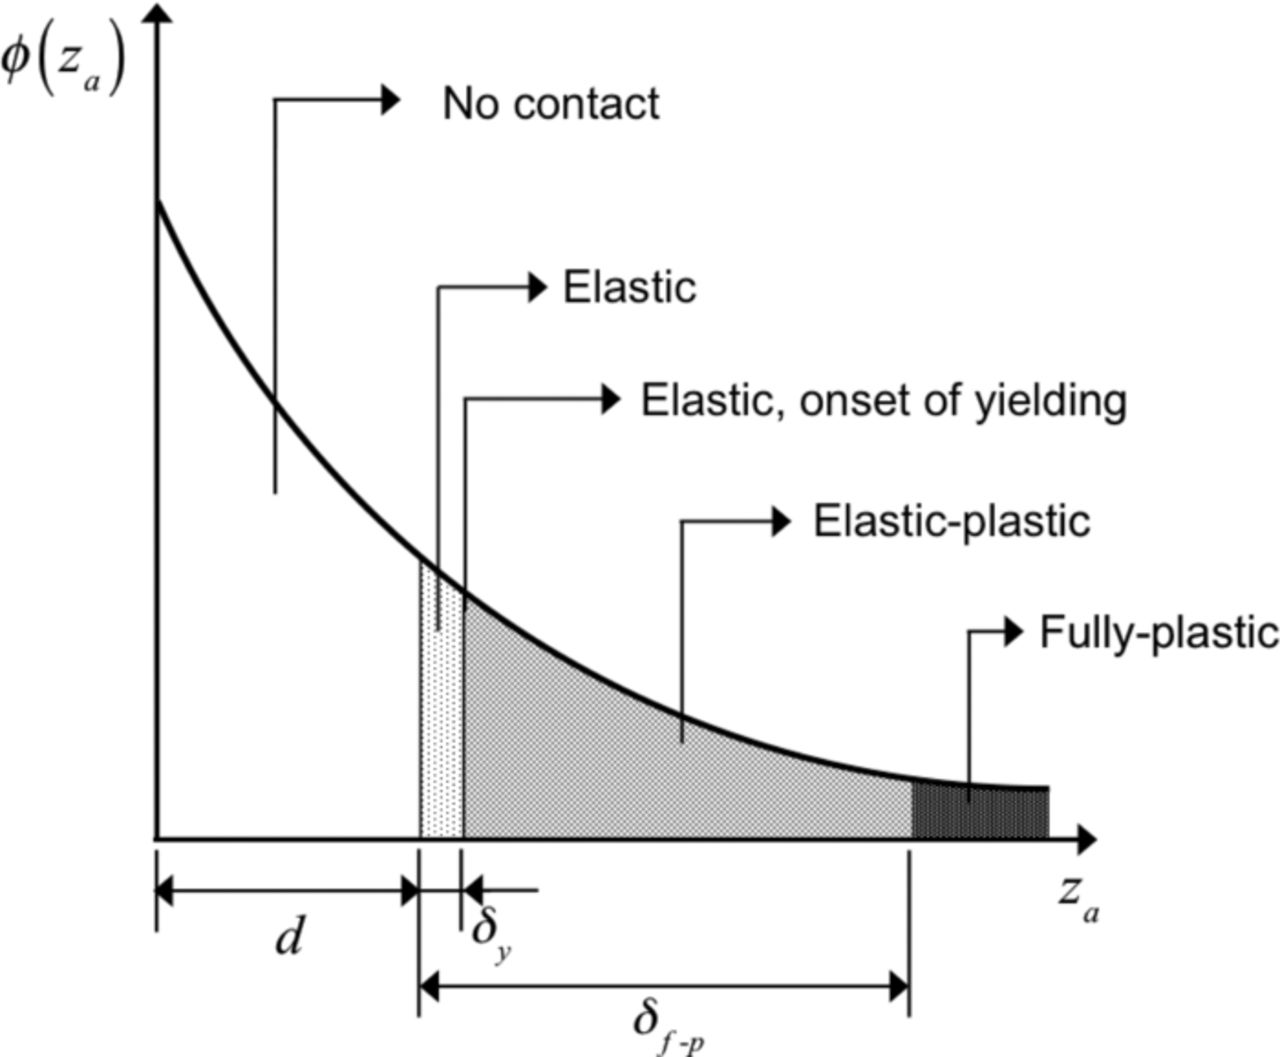
Figure 5. Asperity deformation modes for exponentially distributed heights.
The number of elastically and plastically deformed asperities per unit area, ne and np, can be expressed, respectively, as
![Equation ([26a])](https://content.cld.iop.org/journals/2162-8777/3/5/P169/revision1/jss_3_5_P169eqn30.jpg)
![Equation ([26b])](https://content.cld.iop.org/journals/2162-8777/3/5/P169/revision1/jss_3_5_P169eqn31.jpg)
The proportions of elastically and plastically deformed asperities in the contact are
![Equation ([27a])](https://content.cld.iop.org/journals/2162-8777/3/5/P169/revision1/jss_3_5_P169eqn32.jpg)
![Equation ([27b])](https://content.cld.iop.org/journals/2162-8777/3/5/P169/revision1/jss_3_5_P169eqn33.jpg)
where ψ is the plasticity index, defined as
![Equation ([28])](https://content.cld.iop.org/journals/2162-8777/3/5/P169/revision1/jss_3_5_P169eqn34.jpg)
Thus, the relative proportions of elastically and plastically deformed pad asperities depend on the plasticity index, which depends on the ratio of asperity modulus to asperity hardness, Ea/Ha, and the ratio of standard deviation of asperity heights to asperity radius, σz/Ra. Based on Eq. (27), the probability of pad asperity deformation modes can be estimated if the plasticity index of the pad surface is known. As shown in Figure 6, ψ ≈ 1 is the transition region from elasticity-dominant contact to plasticity-dominant contact. If ψ ≪ 1, most asperities in contact deform only elastically. Then, Eq. (22) and Figure 4a should be considered as criteria for pad scratching. On the other hand, if ψ ≫ 1, a considerable number of asperities in contact will deform plastically, and therefore, Eq. (23) and Figure 4b should be the scratching criteria.
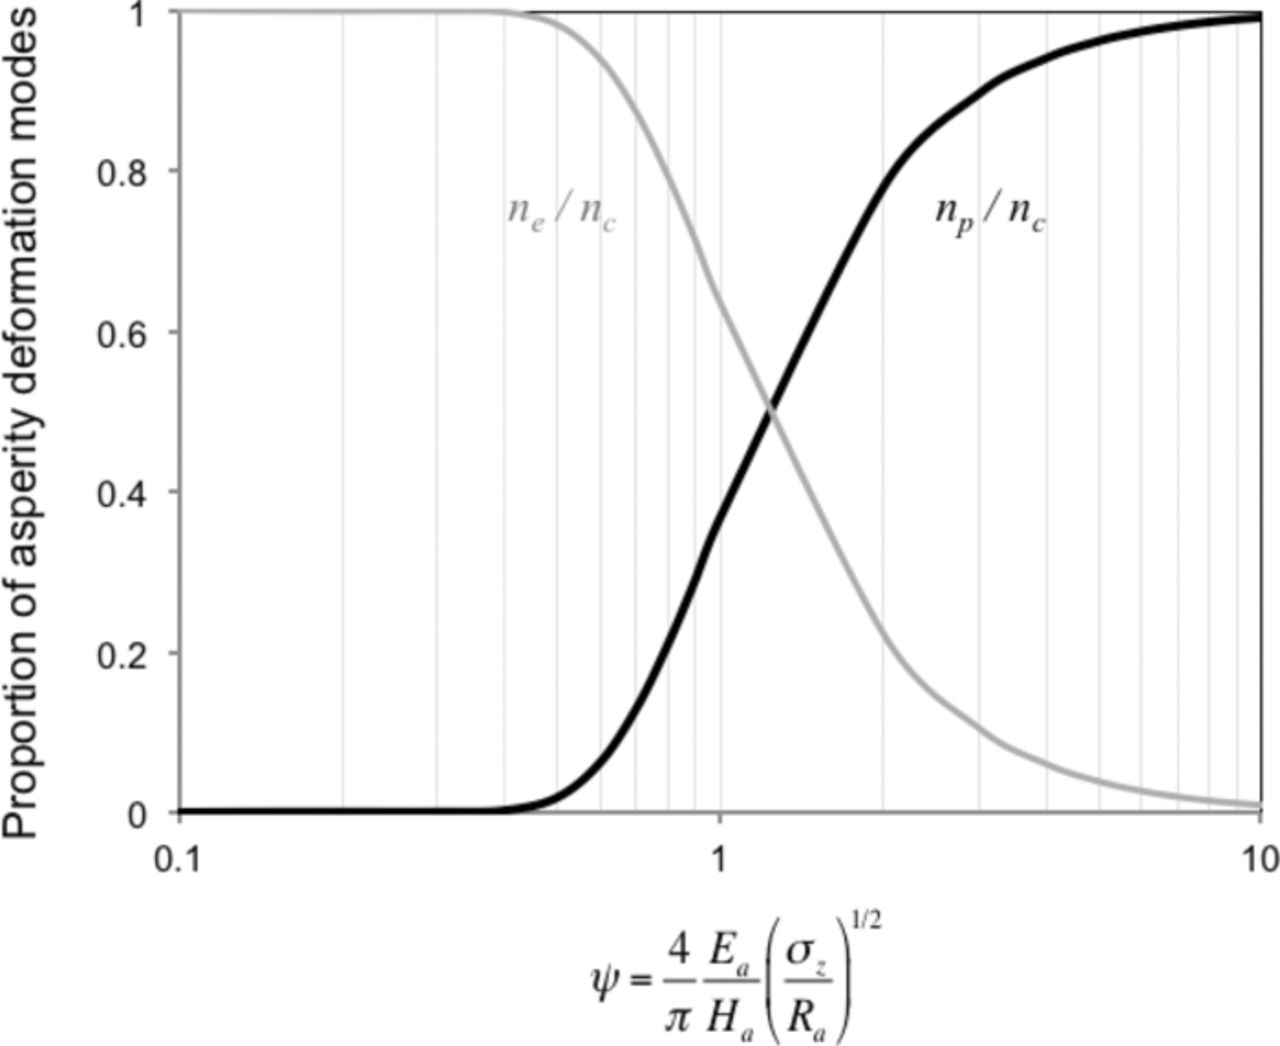
Figure 6. Proportions of elastic and plastic asperity deformation modes versus the plasticity index, ψ.
Proportion of scratching asperities in contact
While the scratch-regime maps provide the criteria for given pad-to-layer hardness ratio and the friction coefficient, they only indicate whether the pad may scratch the surface layer or not. For a quantitative analysis of pad scratching, therefore, the models must be further extended for estimating the relative proportion of asperities among those in contact that can scratch the layer.
When multiple asperities slide over the layer it is the approach of distant points, δ ( = za – d), which determines the mean pressure, pa, at each asperity contact. The surface layer will yield only if pa > ps. That is, only the asperities that deform more than the approach of distant points at the onset of surface layer yielding, δs, which corresponds to ps, can scratch the surface layer. Therefore, the number of scratches per unit area, ns, can be estimated by
![Equation ([29])](https://content.cld.iop.org/journals/2162-8777/3/5/P169/revision1/jss_3_5_P169eqn35.jpg)
From Eqs. 25 and 29, the relative proportion of asperities that can scratch the layer among those in contact, ns/nc, is by
![Equation ([30])](https://content.cld.iop.org/journals/2162-8777/3/5/P169/revision1/jss_3_5_P169eqn36.jpg)
Determination of δs depends on where the hardness ratio and the interfacial friction fall in the scratch-regime maps. First, if the pad-to-layer hardness ratio and the friction coefficient fall in the 'scratch regime' of Figure 4a, i.e. if the conditions satisfy the Eq. (22), then δs = δs,e, given as Eq. 17. For multiple asperities in sliding contact the proportion of scratching asperities can be obtained from Eq. 30 as
![Equation ([31])](https://content.cld.iop.org/journals/2162-8777/3/5/P169/revision1/jss_3_5_P169eqn37.jpg)
Second, if the pad-to-layer hardness ratio and the friction coefficient fall in 'no-scratch regime' of Figure 4a, but fall in 'scratch regime' of Figure 4b, i.e., if the conditions do not satisfy the plastic criteria Eq. (22) but satisfy Eq. (23), then δs = δs,p, given as Eq. 20. Therefore, from Eq. 30,
![Equation ([32])](https://content.cld.iop.org/journals/2162-8777/3/5/P169/revision1/jss_3_5_P169eqn38.jpg)
Finally, if the pad-to-layer hardness ratio and the friction coefficient fall in the 'no- scratch regime' of Figure 4b, i.e., if the conditions do not satisfy Eq. (23), then the asperities in contact cannot scratch the surface and therefore,
![Equation ([33])](https://content.cld.iop.org/journals/2162-8777/3/5/P169/revision1/jss_3_5_P169eqn39.jpg)
To simplify Eqs. 31 through 33, scratching indexes for elastically and plastically deformed asperities, αe and αp respectively, are introduced as:
![Equation ([34])](https://content.cld.iop.org/journals/2162-8777/3/5/P169/revision1/jss_3_5_P169eqn40.jpg)
![Equation ([35])](https://content.cld.iop.org/journals/2162-8777/3/5/P169/revision1/jss_3_5_P169eqn41.jpg)
Then, the scratching criteria for the extreme cases of elastically and plastically deformed asperities, Eqs. (22) and Eqs. (23), respectively, can be expressed as
![Equation ([36])](https://content.cld.iop.org/journals/2162-8777/3/5/P169/revision1/jss_3_5_P169eqn42.jpg)
The proportion of asperities in sliding contact that can scratch a surface can be summarized, from Eqs. 31 to 36, as
![Equation ([37])](https://content.cld.iop.org/journals/2162-8777/3/5/P169/revision1/jss_3_5_P169eqn43.jpg)
Equation 37 suggests that the relative proportion of the asperities that can scratch the surface layer depends on the scratching index, αe or αp, and the plasticity index, ψ. The scratching indexes characterize the effects of the hardness ratio and the interfacial friction. If αe ≥ 1, the larger the αe value is the more are the elastically deformed asperities that scratch the surface layer. If αe < 1 and αp ≥ 0.33, none of the elastically deformed asperities can scratch the surface. However, plastically deformed asperities may scratch surface and the number of scratches may increases as the αp increases. If αp < 0.33, none of the asperities will scratch. Figure 7 shows the proportion of scratching asperities in contact according to the scratching index for different values of plasticity index. Typically, the hardness ratios of CMP pads and the surface layers vary from 0.01 to 0.5, and the friction coefficients are in the range 0.4 and 0.6. Therefore, the αe value in a general CMP system is less than unity, and thus the elastically deformed asperities will not scratch the surface layers; the plastically deformed asperities are the primary source of pad scratching. Moreover, because typical pad surfaces have ψ > 1, most asperities in contact will deform plastically. It can be predicted that the softer pad asperities can scratch the relatively hard surfaces when αp is greater than 0.33, and the number of scratches abruptly increases as αp increases beyond 0.33 as shown in Figure 7.
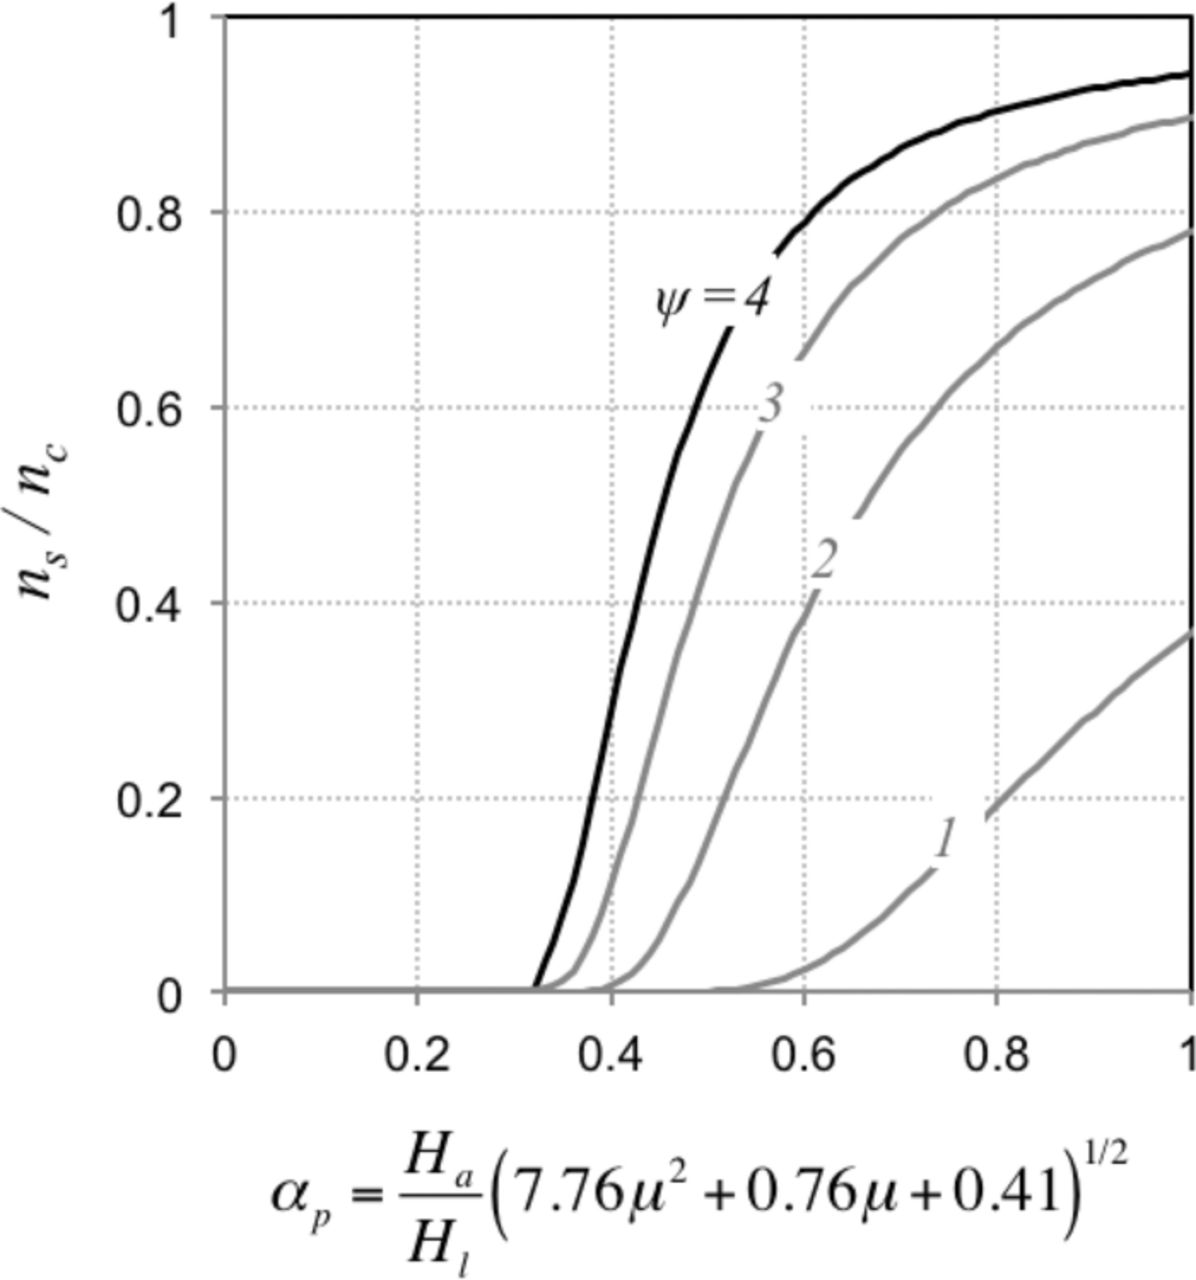
Figure 7. Proportion of asperities in contact that can scratch the surface layer, ns/nc, versus the scratching index, αp, for different plasticity indexes, ψ.
Experimental
Characterization of pad topography
The surface profiles of a commercial pad, Pad A, and a standard CMP pad, IC1000, manufactured by Dow Chemical Co., were determined by a Tencor P16 profilometer, Figure 8. Sampling lengths of 5 mm were scanned at a data acquisition rate of 200 Hz. The tip radius of the stylus was 10 μm, the normal load was 20 μN and the scanning speed was 50 μm/s. Table I lists the statistics of the topographical parameters, heights, and radii of the asperities in the scanned length. In addition, the probability densities of the asperity heights are calculated and shown in Figure 9. It is apparent that the asperity-height distributions of both pads can be well expressed by exponential probability density functions, based on the standard deviation of asperity heights.
Table I. Statistics of pad topography.
| Pad | Parameters | Avg. (μm) | Std. Dev. (μm) | C.V.* |
|---|---|---|---|---|
| Pad A | Asperity height, za | 11.8 | 10.5 | 0.89 |
| Asperity radius, Ra | 26.1 | 9.6 | 0.37 | |
| IC1000 | Asperity height, za | 6.7 | 4.4 | 0.66 |
| Asperity radius, Ra | 23.9 | 9.8 | 0.41 |
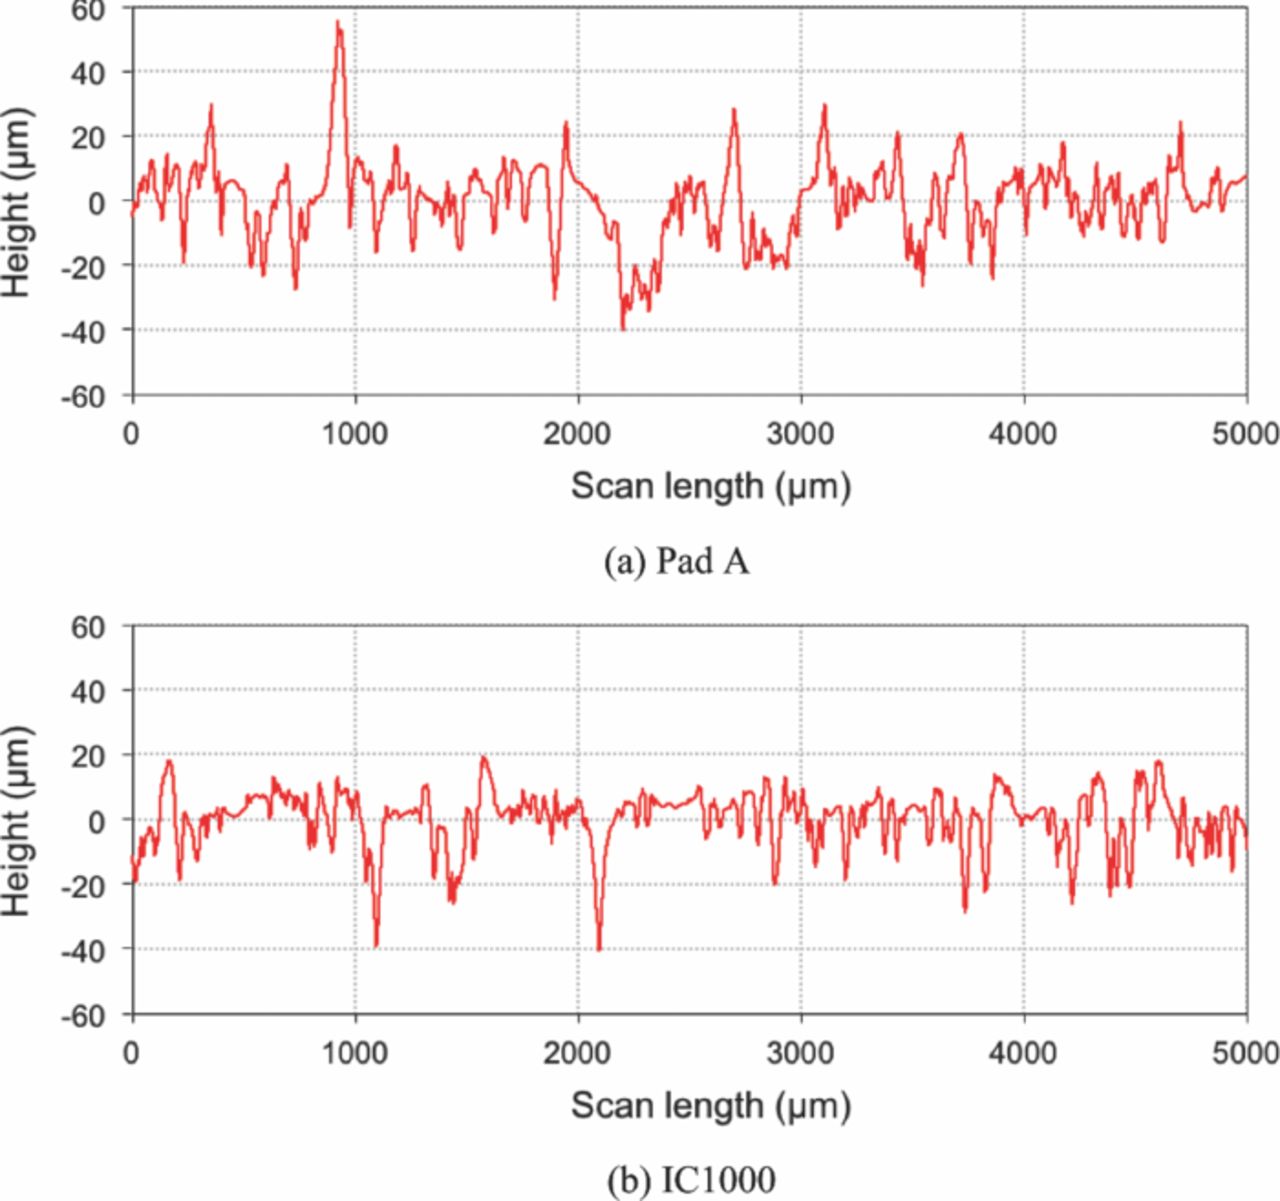
Figure 8. Surface profiles of new CMP pads.
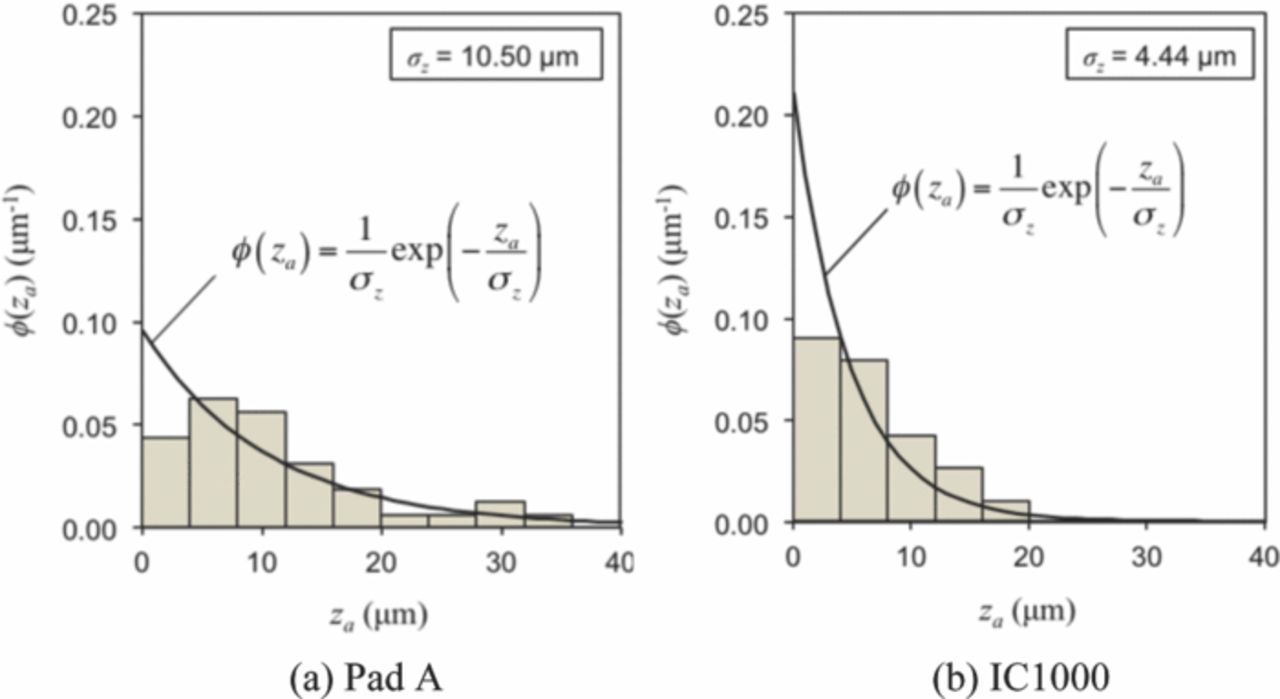
Figure 9. Probability density of asperity heights. The curves are the probability density functions of exponential distribution based on the determined standard deviations.
Determination of the mechanical properties
The Young's modulus and the hardness, of the pad asperities and of the thin-film layers were determined by a Hysitron TriboIndenter, model TI900. Eight different monolithic layers, Al, Cu, SiO2, Si3N4, TiN and three low-k dielectrics, all 1 μm thick and coated on Si wafers, were tested. Over 100 indentations on the pad and 49 indentations on each monolithic surface layer were made. In all cases, a Berkovich indenter was used and the maximum depth of indentation was 90 nm.
Table II lists the statistics of the hardness and modulus. Comparing the average values, not surprisingly the hardness values of the surface layers are much greater than those of the pad asperities. It may be noted, however, that the variation in pad properties is considerably large, probably due to the porosity. It was experimentally shown previously that the Young's modulus and hardness of CMP pads are log-normally distributed.22 Figure 10 shows the probability density of the logarithm of the normalized asperity hardness for both Pad A and IC1000. The data were normalized with the average value. Variation in the properties of Al and Cu is relatively large compared with those of the other layers. Hardness of the surface layers is normally distributed, as shown in Figure 11.
Table II. Statistics of mechanical properties.
| Hardness | Young's modulus | |||||
|---|---|---|---|---|---|---|
| Avg. | Std. Dev. | Avg. | Std. Dev. | |||
| Material | (MPa) | (MPa) | C.V. | (GPa) | (GPa) | C.V. |
| Pad A | 32 | 15 | 0.59 | 0.14 | 0.12 | 0.81 |
| IC1000 | 290 | 220 | 0.76 | 2.21 | 1.59 | 0.72 |
| Al | 970 | 160 | 0.17 | 88.7 | 13.6 | 0.15 |
| Low-k A | 1,360 | 21 | 0.01 | 7.74 | 0.06 | 0.01 |
| Cu | 1,560 | 260 | 0.17 | 126.5 | 12.5 | 0.10 |
| Low-k B | 1,800 | 78 | 0.04 | 23.1 | 0.78 | 0.03 |
| Low-k C | 2,470 | 51 | 0.02 | 25.8 | 0.43 | 0.02 |
| SiO2 | 8,000 | 110 | 0.01 | 69.8 | 0.73 | 0.01 |
| Si3N4 | 9,780 | 160 | 0.02 | 123.2 | 2.79 | 0.02 |
| TiN | 15,400 | 150 | 0.01 | 172.2 | 1.53 | 0.01 |
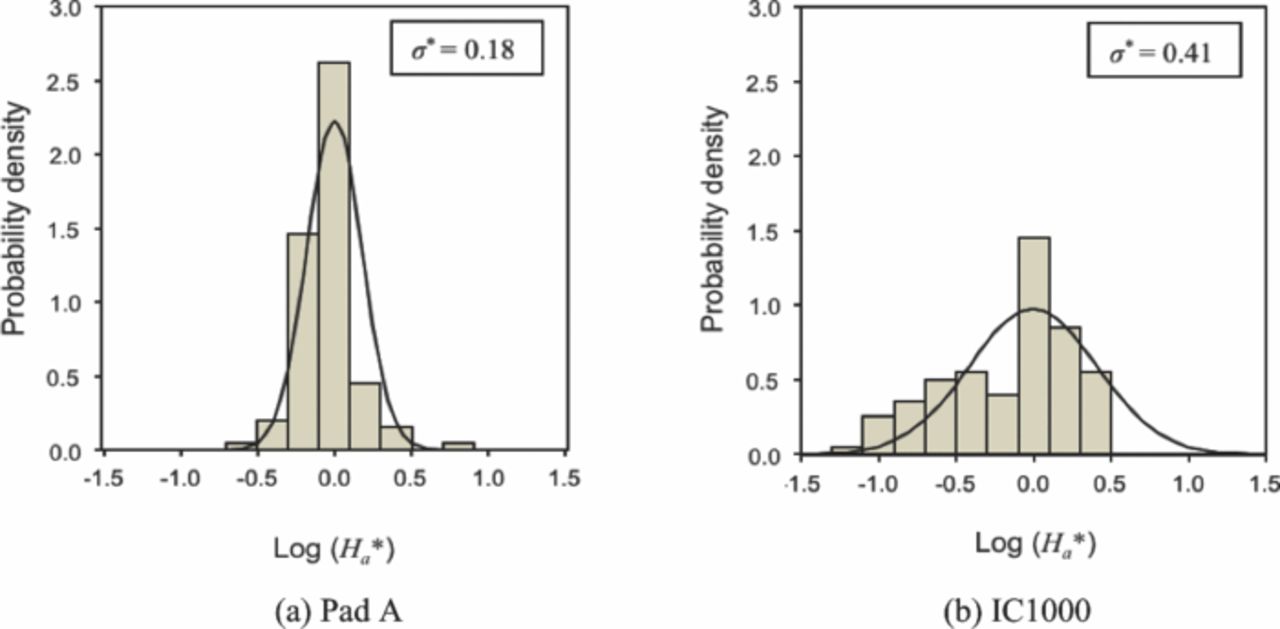
Figure 10. Probability density versus logarithm of normalized hardness of pads A and IC1000. Ha* is the normalized asperity hardness and σ* is the standard deviation of the normalized asperity hardness.
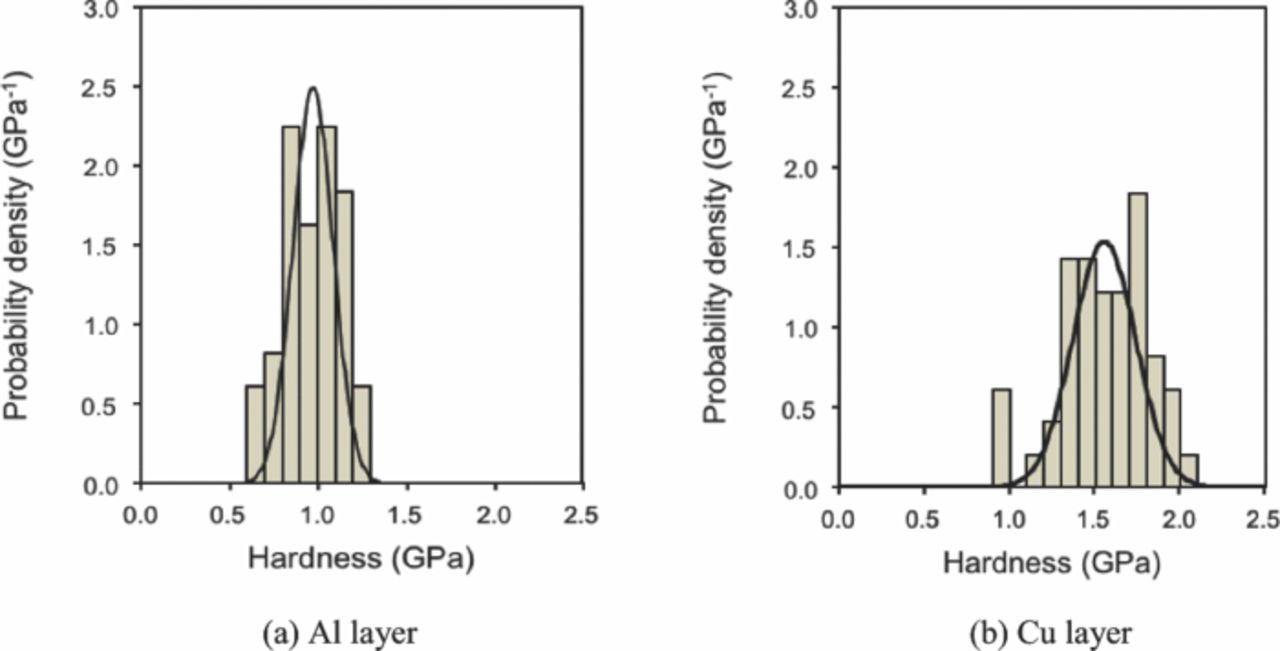
Figure 11. Probability density of the hardness of Al and Cu surface layers.
Plasticity indexes of pad surfaces
Based on the measured topographical and mechanical properties of pad asperities, plasticity indexes of Pad A and IC1000 pad were calculated from Eq. 28 as 3.5 and 4.2, respectively. The probability of asperity deformation modes was estimated by Eq. (27). As listed in Table III, when the pads are pressed against the surface layers over 90% are expected to deform plastically.
Table III. Plasticity indexes, ψ, and estimated proportions of elastic and plastic asperity deformation modes, ne/nc and np/nc, of pad A and IC1000.
| Pad | ψ | ne/nc | np/nc |
|---|---|---|---|
| Pad A | 3.5 | 0.08 | 0.92 |
| IC1000 | 4.2 | 0.06 | 0.94 |
Pad sliding experiments
Figure 12 shows the reciprocating sliding apparatus used for scratching experiments. Circular disks, 20 mm in diameter, of polishing pads were pressed at a normal load of 2 N, which corresponds to an average pressure of 7 kPa, and were slid over the wafers at a velocity of 7 mm/s. All sliding tests were conducted in deionized water, and the number of cycles in each run was 15. The friction between the pads and the surface layers during sliding was monitored by a strain-gage transducer. After each experiment, scratches on the surface layers of the wafer were characterized by optical and scanning electron microscopes.
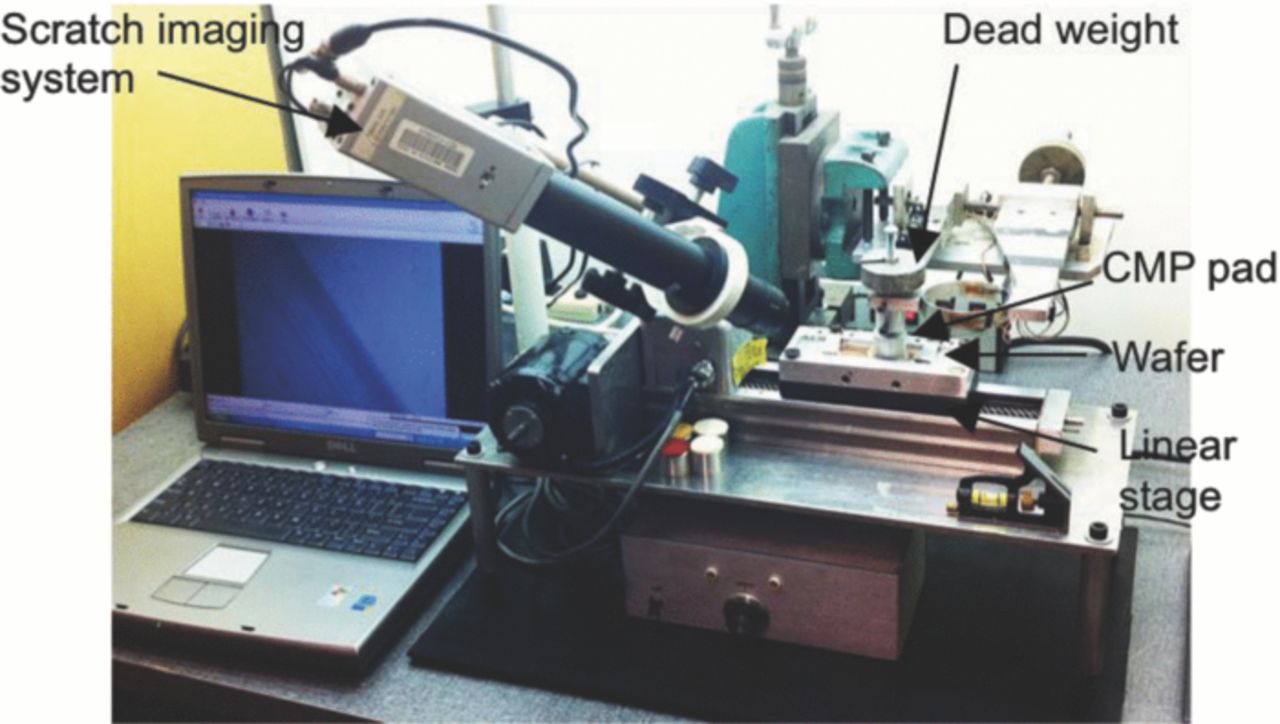
Figure 12. Reciprocating sliding apparatus.
Results and Discussion
As listed in Table III, when the pad is pressed against the thin-film layers, most of the pad asperities deform plastically. Therefore, the pad will scratch the wafer surface if the scratching criteria for plastically deformed asperities, Eq. (23), is satisfied. That is, the pad will scratch when the hardness ratio and the friction coefficient fall in the scratch regime of the scratch-regime map, Figure 4b.
The scratch-regime map for plastically deformed asperities is constructed for Pads A and IC1000, Figures 13a and 14a, respectively, considering the extreme hardness values: i.e., the maximum hardness of pad asperities and the minimum hardness of the surface layers. The reason for considering the extreme values is that scratching may occur when a hardest pad asperity rides over a softest point of the surface layer, even if the layers are not scratched for intermediate values. The minimum hardness values of the surface layers, Hl,min, were estimated as Hl,avg – 3σ, where the average and the standard deviation are listed in Table II. Although the maximum hardness values of pad asperities may be similarly estimated as log(Ha,max*) = log(Ha,avg* + 3σ*), the estimated value of the IC1000 pad was 19 GPa, which is unrealistic for a polyurethane polymer. Therefore, the measured maximum values, Ha,max = 162 MPa for Pad A and Ha,max = 915 MPa for the IC1000 pad were used in the scratch criteria.
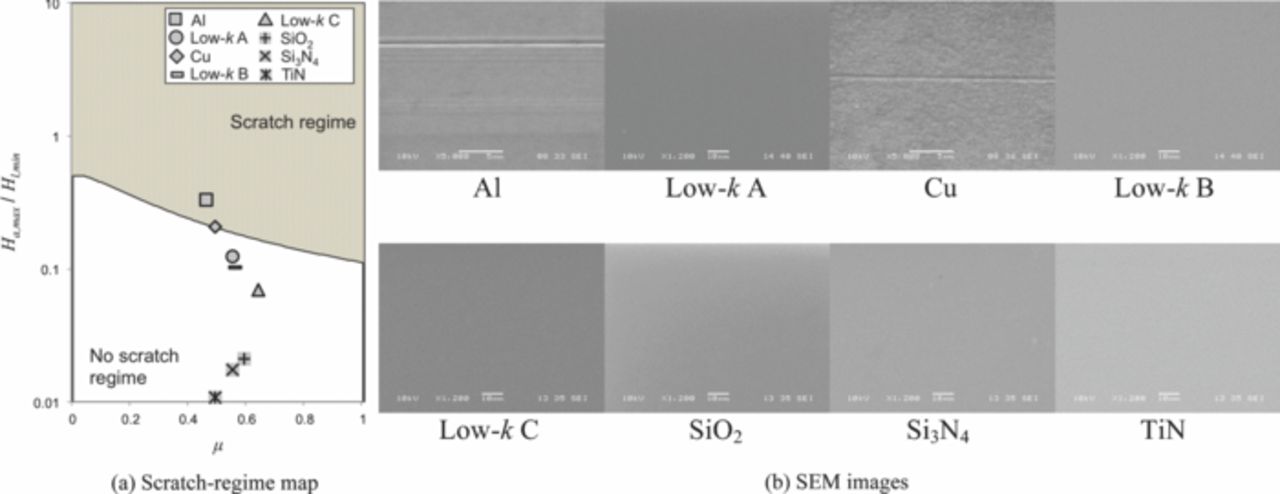
Figure 13. Scratch-regime map for Pad A and SEM images of the surface layers after sliding experiments using Pad A.
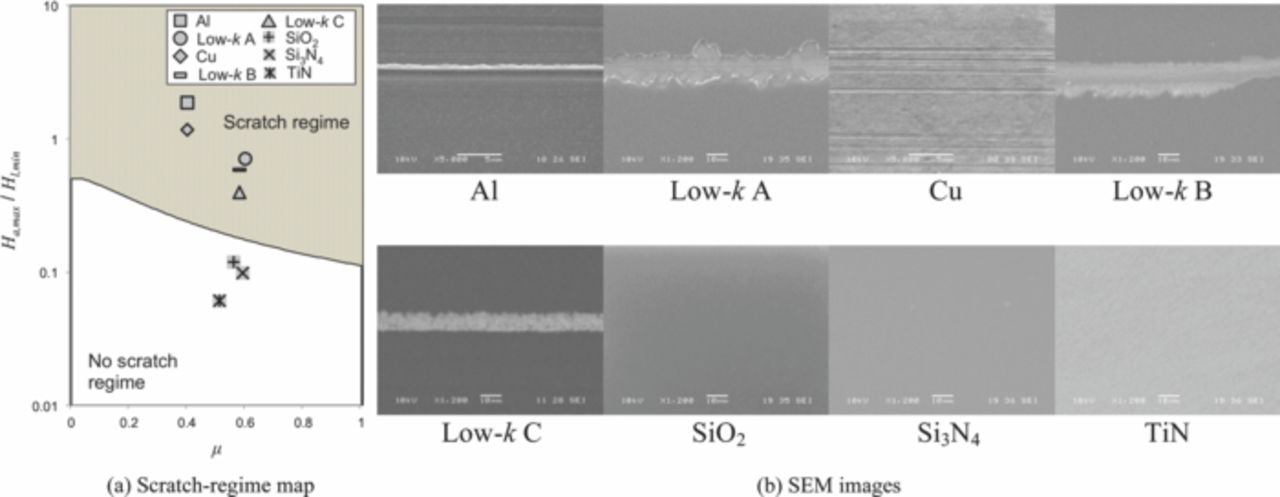
Figure 14. Scratch-regime map for IC1000 and SEM images of the surface layers after sliding experiments using IC1000.
Comparing the experimental results, Figure 13b, Pad A scratches the Al and Cu layers since the combination of the extreme hardness ratio and the friction coefficient fall in the 'scratch regime' of the map. The pad cannot scratch the other surface layers (three low-k dielectrics, SiO2, Si3N4 and TiN) because even the extreme conditions between Pad A and the other layers fall in the 'no-scratch regime'. Similarly, IC1000 pad can scratch only Al, Cu and the three low-k dielectrics, Figure 14b, since their extreme conditions fall in the 'scratch regime', but cannot scratch SiO2, Si3N4 and TiN. It may be noted that due to the greater variation in hardness, Cu layers are more vulnerable to scratching than the low-k layers even though the average hardness and the friction is smaller.
To further quantify pad scratching, the number of scratches generated on the surface layers was determined by optical and scanning electron microscopes. Listed in Table IV are the calculated scratching indexes, αe and αp, for the CMP pads and the surface layers from Eqs. 34, 35 and using the measured hardness values and friction coefficients. For αe and αp calculation, the average asperity hardness and the minimum surface layer hardness are used. As multiple asperities slide over, a scratch may initiate when an asperity encounters the softest points on the layer. In all cases, the αe values are less than unity, which again suggests that, from Eq. 36, only the plastically deformed asperities scratch the surface layer. In addition, the αp values of Pad A and the surface-layer combinations are much less than those between IC1000 and the surface layers primarily due to the low hardness of Pad A. The number of scratches generated on the surface layers by the IC1000 pads are listed in the last column of Table IV and also plotted in Figure 15 according to αp. The number of scratches is small when αp is less than 0.33, but increases as αp exceeds 0.33, which validates the theoretical predictions, Eq. 37.
Table IV. Scratching indexes and results of sliding experiments.
| Pad | Surface layer | Ha /Hl,min | μ | αe | αp | Number of scratches |
|---|---|---|---|---|---|---|
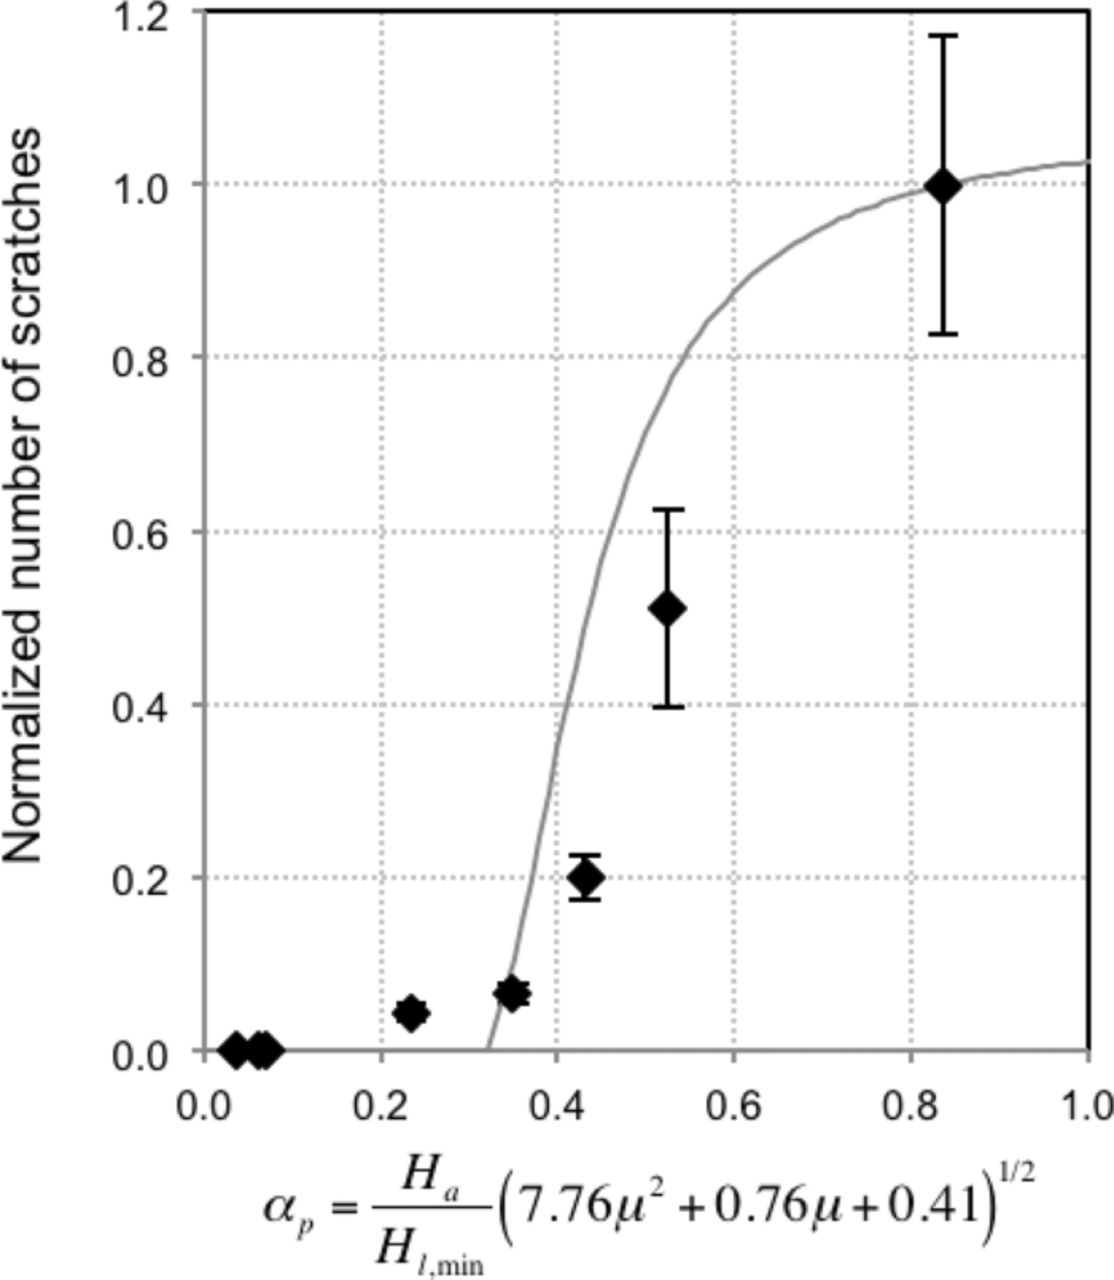
Figure 15. Normalized number of scratches versus αp. The solid line is the theoretical prediction for IC1000 pad, ψ = 4.2. The points are average values and the bars are standard errors of the experimental results.
In summary, both the theoretical models and the experimental results show that to mitigate scratching by the pad asperities on the layer surfaces, the scratching index, αp, should be reduced, i.e., either the hardness ratio, Ha/Hl, or the coefficient of friction between the pad asperity and the surface layer, μ, or both, need to be reduced. Practically, in the CMP of low-hardness layers, such as Al and Cu, softer polishing pads and lubricants should be used to keep αp below 0.33. Furthermore, the scratch-regime maps suggest that scratching by pad asperities can be eliminated if the hardness ratio and the friction coefficient fall in the 'no scratch regime' of the maps. More importantly, not only the average values, but also the variation in the hardness of pad asperities should be tightly controlled so that even the extreme values satisfy such criteria. In addition, the theoretical model, Eq. 37, also suggests that the pad-induced scratching can be mitigated by reducing the plasticity index, ψ, of the pad surface, i.e., by decreasing the modulus-to-hardness ratio of pad asperities, Ea/Ha, and the ratio of standard deviation of asperity height to asperity radius, σz/Ra.45
Conclusions
In the present work, scratching of the relatively hard surface layers by the softer pad asperities in chemical-mechanical polishing was investigated.
- (1)Based on the mechanics of sliding frictional contacts, scratching criteria were developed for the various pad asperity deformation modes: elastic, elastic but at the onset of yielding, elastic-plastic, and fully plastic.
- (2)When multiple pad asperities are in contact, the proportions of the elastic and plastic deformation modes depend on the plasticity index of the pad surface. Typical CMP pads have plasticity index greater than unity, and thus most asperities deform plastically. Therefore, scratch criteria and scratch-regime map for plastically deformed asperities must be considered to determine whether or not the pad asperities can scratch the hard layers.
- (3)For a quantitative analysis of pad scratching, scratching indices in terms of pad-to-layer hardness ratio and the friction coefficient were introduced. The proportions of scratching asperities in contact can be estimated from the scratch index of the pad asperities and the surface layer, and the plasticity index of the pad surface.
- (4)The nano-indentation results showed that CMP pads as well as Cu and Al layers have large variation in hardness compared with hard layers, such as low-k dielectrics, SiO2, Si3N4 and TiN. Accordingly, in constructing the scratch-regime maps the extreme hardness values should be used in the scratch criteria.
- (5)The theoretical models and the experimental results have shown that the number of scratches steeply rises as the scratch index increases beyond 0.33. Only few scratches were found when the scratch index was less than 0.33.
- (6)The present work suggests that to mitigate, or even eliminate, pad scratching, the scratching index, which incorporates the hardness ratio and interfacial friction between pad asperities and the surface layer, should be reduced to preferably less than 0.33. Additionally, local hardness of the asperities and surface layers should also be tightly controlled.
List of Symbols
| Cf–p | = δf–p/δy |
| d | distance between the centerline of pad surface and wafer surface [m] |
| Ea | Young's modulus of asperity [N m−2] |
| El | Young's modulus of surface layer [N m−2] |
| Ha | hardness of asperity [N m−2] |
| Ha* | normalized hardness of asperity |
| Hl | hardness of surface layer [N m−2] |
| n | number of asperities per unit area [m−2] |
| nc | number of asperities in contact per unit area [m−2] |
| ne | number of elastically deformed asperities per unit area [m−2] |
| np | number of plastically deformed asperities per unit area [m−2] |
| ns | number of scratching asperities per unit area [m−2] |
| Pa | asperity load [N] |
| pa | mean asperity contact pressure [N m−2] |
| po | maximum asperity contact pressure [N m−2] |
| ps | mean asperity contact pressure at the onset of surface layer yielding [N m−2] |
| Ra | asperity radius [m] |
| vr | relative velocity [m s−1] |
| za | asperity height [m] |
| αe | scratching index for elastically deformed asperities |
| αp | scratching index for plastically deformed asperities |
| δ | approach of distant points [m] |
| δf–p | approach of distant points at the onset of fully-plastic asperity deformation [m] |
| δs | approach of distant points at the onset of surface layer yielding [m] |
| δs,e | approach of distant points at the onset of surface layer yielding under an elastically deformed asperity in sliding contact [m] |
| δs,p | approach of distant points at the onset of surface layer yielding under a plastically deformed asperity in sliding contact [m] |
| δy | approach of distant points at the onset of asperity yielding [m] |
| μ | coefficient of friction |
| νl | Poisson's ratio of surface layer |
| σM,max | maximum von Mises stress [N m−2] |
| σy,a | yield strength of asperity [N m−2] |
| σy,l | yield strength of surface layer [N m−2] |
| σz | standard deviation of asperity heights [m] |
| τmax | maximum shear stress [N m−2] |
| ψ | plasticity index |
| ϕ(za) | probability density of asperity heights [m−1] |
Acknowledgments
The present study was sponsored by the Samsung Electronics Company.