Abstract
We compare two experimental approaches for measuring the cation transference number in mixtures of polyethylene oxide (PEO) and lithium bis(trifluoromethanesulfonyl)imide (LiTFSI) salt: the well-established current-interrupt method proposed by Ma et al. [J. Electrochem. Soc., 142, 1859 (1995)], and a more recent method based on measuring the steady-state current proposed by Balsara and Newman [J. Electrochem. Soc., 162, A2720 (2015)]. In electrolytes comprised of high molecular weight PEO, the data from the two techniques agree, highlighting the equivalence of these two approaches. However, in lower molecular weight PEO electrolytes the values of the two approaches diverge at low salt concentrations. We posit this is because the approach of Ma et al. requires measurements that are sensitive to the nature of the interface between the electrolyte and the electrode. The transference numbers measured by the approach of Balsara and Newman for both low and high molecular weight samples vary from 0.7 to −0.8 and are within experimental error throughout the entire salt concentration window.
Export citation and abstract BibTeX RIS

This is an open access article distributed under the terms of the Creative Commons Attribution 4.0 License (CC BY, http://creativecommons.org/licenses/by/4.0/), which permits unrestricted reuse of the work in any medium, provided the original work is properly cited.
The development of high energy density rechargeable batteries may enable the widespread adoption of mass market electric vehicles, thereby offering a promising route toward reducing the overall carbon footprint of our economy. The industry standard for rechargeable batteries is the lithium-ion battery, comprised of a graphite anode, a composite cathode, and an organic liquid electrolyte through which lithium ions are shuttled to and from the electrodes during charge and discharge. Next generation battery technology centers around increasing the energy density by employing novel active materials that are generally incompatible with traditional liquid electrolytes. Promising alternatives for liquid electrolytes include those based on polymers such as mixtures of polyethylene oxide (PEO) and lithium bis(trifluoromethanesulfonyl)imide (LiTFSI) salt.1–4 Complete characterization of a battery electrolyte material requires knowledge of three independent transport properties: ionic conductivity, σ, salt diffusion coefficient, D, and cation transference number, t+, in addition to the thermodynamic factor, (1+dlnγ±/dlnm).5 The experimental techniques for accurate measurement of σ and D are well established; data of σ from ac impedance spectroscopy and D from restricted diffusion are prevalent in the literature. In contrast, the best technique for measuring t+ remains a topic of discussion.
The history of the transference number dates back to the 19th century, when Hittorf devised an experimental approach based on passing a known amount of charge through a cell with non-blocking electrodes and measuring the concentration of salt within compartmentalized sections of the electrolyte.6 This technique is straightforward for liquid electrolytes and has been applied to a variety of systems.7 An extension of this approach was later developed for solid electrolytes by Tubandt,8 where the masses of the electrolyte compartments are measured instead of the salt concentration. Since then, a wide variety of approaches for determining the transference number have emerged. Techniques such as the moving boundary method,9 electromotive force measurement,10 and electrophoretic NMR11 are experimentally rigorous, requiring complex experimental setups, special salts, or unique cell architecture. Other techniques commonly used to measure t+ such as impedance spectroscopy12,13 and pulsed-field gradient NMR14,15 rely on assumptions that are invalid for concentrated electrolytes. Due to experimental simplicity, the steady-state current approach outlined by Bruce and Vincent16,17 is perhaps the technique most commonly reported in the literature. In this experiment, a polarization is applied across a symmetric cell with non-blocking electrodes, and the transference number is calculated by the ratio of the steady-state current to the initial current. We refer to this parameter as t+,SS, where the subscript is used to denote the experimental approach. Despite its popularity, t+,SS is derived using ideal solution assumptions.18,19 Values for t+,SS are bounded by zero and one, whereas the transference number has no bounds.
A more rigorous electrochemical approach has been recently identified by Balsara and Newman.19 They use concentrated solution theory to derive the relationship between t+,SS and the transference number of the electrolyte, referred to as t+,Ne. Experimental determination of t+,Ne requires four different electrochemical measurements: σ from ac impedance spectroscopy, D from restricted diffusion, t+,SS from the steady-state current measurement, and U, the potential measured in concentration cells. This technique has been used by Pesko et al. to obtain the transport properties of electrolytes comprised of PEO and LiTFSI salt.20 The observed dependence of t+,Ne on salt concentration was complex, exhibiting negative values at intermediate concentrations.
A similar electrochemical approach has been defined by Ma and coworkers and is also based on concentrated solution theory.21 In this approach, data obtained from current interrupt experiments are combined with measurements of D and U in order to determine t+,CI. Numerous studies have used this approach to measure t+,CI in polymer electrolytes21–24 and liquid electrolytes.25,26 The work of Edman et al., who characterized mixtures of PEO and LiTFSI,27 is of particular relevance to the present study. The results of Edman et al. suggest that t+,CI has a simple, monotonic dependence on salt concentration and is positive at all concentrations. Thus, the results of Pesko et al. and those of Edman et al. for the transference number of PEO/LiTFSI electrolytes are not in agreement. One possible reason for this discrepancy could be the difference of molecular weight of the PEO polymer used in these studies.
We set out to resolve this issue by performing a direct comparison of t+,Ne and t+,CI over a wide range of salt concentrations in two electrolytes: 5 kg/mol and 275 kg/mol PEO mixed with LiTFSI salt. Our results demonstrate the reproducibility of the t+,Ne measurements, and also highlight the experimental factors that may lead to discrepancies between the two techniques.
Experimental
The polymers used in this study are 5 kg/mol and 275 kg/mol polyethylene oxide (PEO) with –OH end groups purchased from Polymer Source, and the salt is lithium bis(trifluoromethanesulfonyl)imide (LiTFSI) purchased from Novalyte. We refer to the 5 kg/mol polymer as PEO-5K and the 275 kg/mol polymer as PEO-275K. All sample preparation was performed inside of an argon glove box where water and oxygen levels remained below 1 and 5 ppm, respectively. Both the polymer and salt were dried thoroughly under vacuum (12 hours at 90°C for PEO, 3 days at 120°C for LiTFSI) in the glove box antechamber before being transferred into the glove box. Electrolytes were prepared by fully dissolving PEO and LiTFSI in anhydrous tetrahydrofuran (THF) at 60°C, then subsequently evaporating the THF to produce a homogeneous polymer/salt mixture. The PEO/LiTFSI electrolytes were dried under vacuum for 12 hours at 90°C to remove any excess solvent.
The salt concentrations of the electrolytes ranged from 0.01 ≤ r ≤ 0.3 for PEO-5K and 0.005 ≤ r ≤ 0.3 for PEO-275K, where r is the molar ratio of lithium ions to ether oxygens, r = [Li+]/[O]. We have previously reported measurements of density, ρ, and calculations of molarity, c, over a wide range of r in mixtures of 5 kg/mol PEO and LiTFSI at 90°C.20 We use these values for ρ and c in both PEO-5K and PEO-275K. The molality, m, of the electrolytes is calculated according to m = r/ MEO, where MEO is the molar mass of the ethylene oxide repeat unit (44.05 g/mol). Table I provides values of ρ, c, and m for all electrolytes in this study.
Table I. Values for density, molarity, and molality of PEO-5K and PEO-275K electrolytes based on r. We assume that these values are the same in both electrolytes.
| r | ρ (g/L) | c (mol/L) | m (mol/kg) |
|---|---|---|---|
| 0.00 | 1128 | 0.00 | 0.00 |
| 0.005* | 1144 | 0.13 | 0.11 |
| 0.01 | 1160 | 0.25 | 0.23 |
| 0.02 | 1180 | 0.47 | 0.45 |
| 0.04 | 1210 | 0.87 | 0.91 |
| 0.06 | 1230 | 1.20 | 1.36 |
| 0.08 | 1330 | 1.59 | 1.81 |
| 0.10 | 1365 | 1.87 | 2.27 |
| 0.12 | 1380 | 2.11 | 2.72 |
| 0.14 | 1430 | 2.38 | 3.17 |
| 0.16 | 1450 | 2.58 | 3.63 |
| 0.18 | 1470 | 2.76 | 4.08 |
| 0.21† | 1516 | 3.05 | 4.76 |
| 0.24 | 1580 | 3.36 | 5.44 |
| 0.27† | 1572 | 3.49 | 6.12 |
| 0.30 | 1640 | 3.78 | 6.80 |
Ionic conductivity was obtained by performing ac impedance spectroscopy on symmetric cells with blocking electrodes. We assembled stainless-steel-polymer-stainless-steel symmetric cells by pressing the PEO/LiTFSI electrolyte into a 508 μm thick silicone spacer and sandwiching between two 200 μm stainless-steel shims. The entire assembly was vacuum sealed in an airtight pouch material (Showa-Denko) with aluminum tabs serving as electrical contacts. Once the sealing was complete, the sample was removed from the glove box for electrochemical characterization. Cells were annealed at 110°C prior to the conductivity measurement which was made at 90°C. Ac impedance spectroscopy was performed with a Biologic VMP3 potentiostat, where complex impedance measurements were acquired for a frequency range of 100 mHz to 1 MHz at an amplitude of 80 mV. The high-frequency minimum on the Nyquist impedance plot is taken to be the bulk electrolyte resistance, Rb, which is used along with electrolyte thickness, L, and electrolyte area, a, to calculate the electrolyte conductivity, σ, according to Eq. 1.
![Equation ([1])](https://content.cld.iop.org/journals/1945-7111/165/13/A3014/revision1/d0001.gif)
The inner diameter of the spacer, 3.175 mm, is used to calculate a. Thickness, L, is taken to be the final thickness of the electrolyte, measured after conductivity measurements were completed.
The steady-state current, restricted diffusion, and current interrupt measurements were performed on lithium-polymer-lithium cells. These samples were prepared by pressing the electrolyte into a 508 μm thick silicone spacer and sandwiching between two 150 μm thick lithium foils purchased from the MTI Corporation. Each lithium electrode was backed with a layer of nickel foil to keep the surface of the lithium pristine and a stainless-steel shim to prevent cell deformation. Nickel tabs were secured to the stainless-steel shims to serve as electrical contacts. The cells were vacuum sealed in pouch material to maintain an air-free environment upon removal from the glove box.
All electrochemical characterization data were obtained using a Biologic VMP3 potentiostat, and the temperature was 90°C. At the beginning of the experiment, cells were annealed for 4 hours to ensure good contact at the lithium-electrolyte interface. Conditioning cycles were performed for 5 charge/discharge cycles at a low current density of 0.02 mA/cm2. Each conditioning cycle consisted of a 4 hour charge, 45 min rest, 4 hour discharge, and 45 min rest. Ac impedance spectroscopy was performed before and after the conditioning cycles, and then again at the end of the electrochemical measurements to track the cell resistances over the course of the experiment. Values for the bulk resistance, Rb, and the interfacial resistance, Ri, were obtained by fitting the data in the form of a Nyquist plot to an equivalent electrical circuit appropriate for a symmetric cell with non-blocking electrodes.20 Figure 1 shows an example of these data obtained from a lithium-polymer-lithium symmetric cell containing a PEO-5K electrolyte with a salt concentration of r = 0.06. In this sample, Ri increased significantly over the course of the experiment with most of the change occurring during the conditioning cycles, whereas Rb was constant throughout the entire experiment. Both the PEO molecular weight and the salt concentration affect the behavior of Ri throughout the experiment.
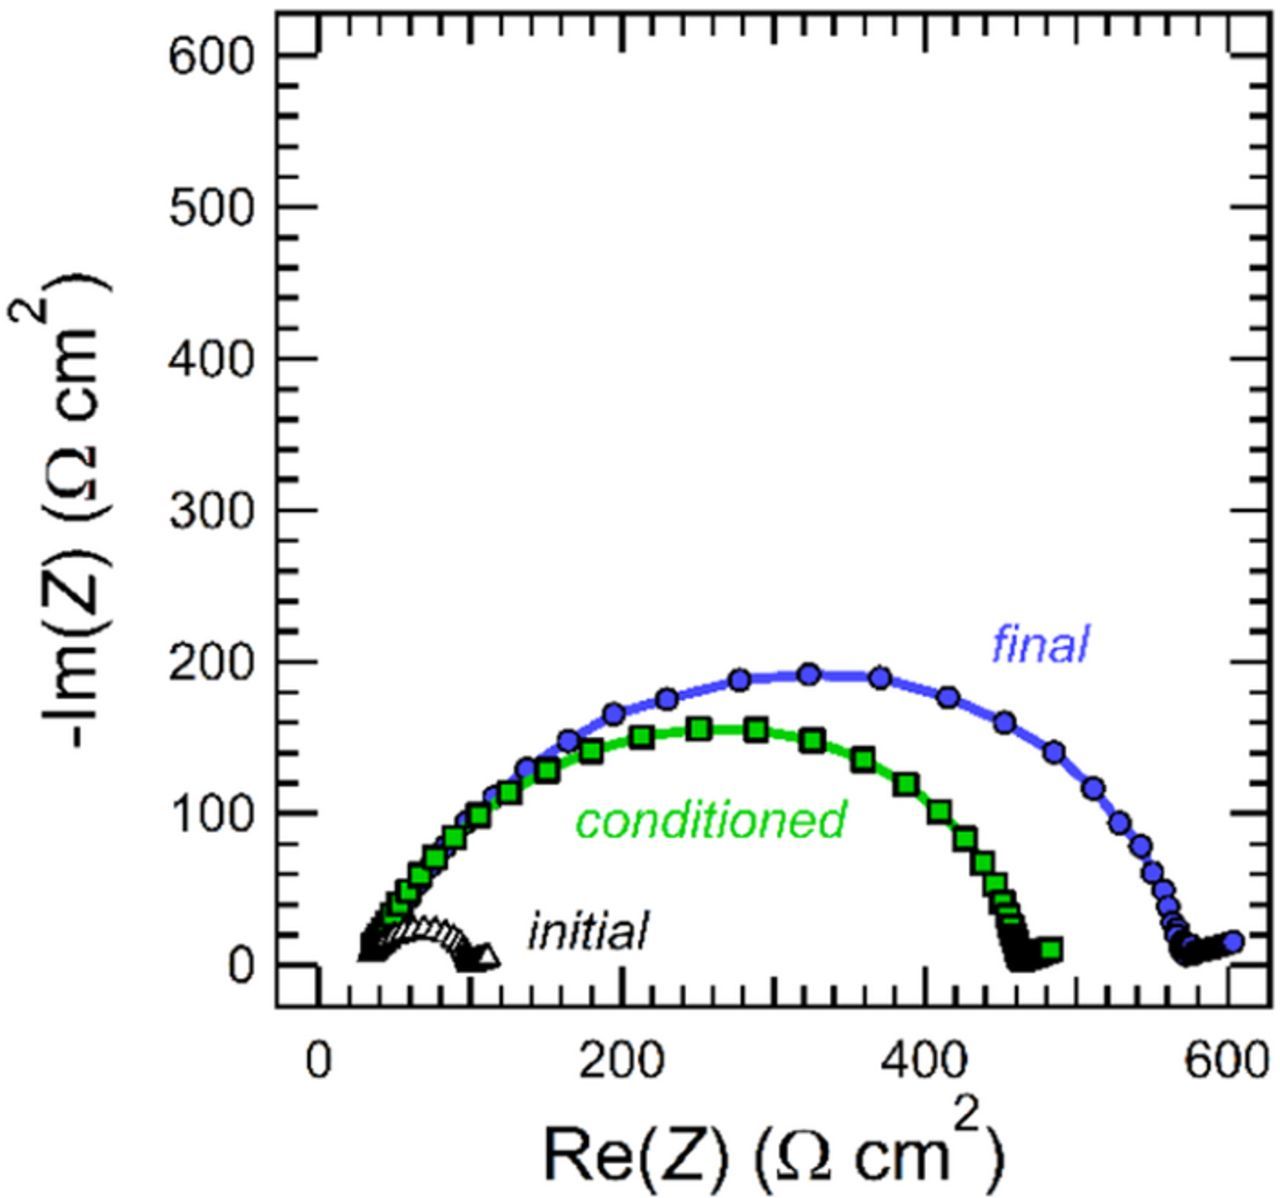
Figure 1. Nyquist plot showing ac impedance measurements from a lithium-polymer-lithium symmetric cell obtained initially, after the cell was conditioned, and at the end of the experiment. This cell contained a PEO-5K electrolyte with r = 0.06. The lines between data points are included for clarity.
Steady-state current and restricted diffusion measurements were performed at potentials of ΔV = 10 mV, −10 mV, 20 mV, and −20 mV to ensure the results were independent of the sign and magnitude of the applied potential. Here, we provide a brief description of these experiments; additional details are included in Reference 20.
The steady-state current experiment was performed by polarizing the cell at constant potential, ΔV, for 4 hours and measuring the current density reached at steady-state, iSS. The resistances of the cell initially (Ri,0 and Rb,0) and at steady-state (Ri,SS and Rb,SS) were measured using impedance spectroscopy. The steady-state current transference number, t+,SS, derived by Bruce and Vincent16,17 is calculated according to the relationship
![Equation ([2])](https://content.cld.iop.org/journals/1945-7111/165/13/A3014/revision1/d0002.gif)
where iΩ is the initial current density calculated according to Ohm's law,28
![Equation ([3])](https://content.cld.iop.org/journals/1945-7111/165/13/A3014/revision1/d0003.gif)
It is important to note that the resistance of the electrode-electrolyte interface is subtracted from the measured data to obtain t+,SS.
Restricted diffusion measurements were obtained using the concentration polarization introduced by the steady-state current experiment. Upon removal of the applied potential, the open-circuit voltage, OCV, of the cell relaxed with time, t. The salt diffusion coefficient, D, is calculated using
![Equation ([4])](https://content.cld.iop.org/journals/1945-7111/165/13/A3014/revision1/d0004.gif)
where the left side of the equation is the slope from the least-squares linear fit of –ln(OCV) vs. t from 5 min ≤ t ≤ 2 hours. L is the thickness of the electrolyte, measured by disassembling each cell subsequent to the completion of the electrochemical experiments.
The current interrupt technique was performed following the details outlined in Reference 21. A polarization was applied to the lithium-polymer-lithium cell at a constant current density, i, for a short period of time: 5 seconds ≤ t ≤ 2 min. The values of i used in this experiment were i = 0.1, 0.2, 0.3, and 0.4 mA/cm2. Upon the interruption of the current, the OCV of the cell was recorded immediately following the discharge of the double layer. A least-squares linear fit of the data plotted in the form of OCV versus it0.5 is used to obtain the slope, mCI, which is the relevant experimental quantity for this technique.
The thermodynamic factor is obtained by measuring the voltage, U, of a concentration cell of the form Li | PEO/LiTFSI (rref) | PEO/LiTFSI (r) | Li. These samples were prepared by creating a channel (approximately 3 cm by 2 mm) in a 508 μm thick silicone spacer, and filling half of the channel with reference electrolyte (rref = 0.06), and the other half with electrolytes at various r. Lithium backed with nickel foil was placed on either end of the channel to serve as electrodes. Nickel tabs were secured as electrical contacts, and the assembly was vacuum sealed in pouch material. Each cell was annealed at 90°C for 20 hours before the value of U was recorded; this length of time ensures the formation of stable interface layers prior to the electrochemical measurement. The diffusion length of 3 cm resulted in a concentration gradient relaxation process that occurred over the course of several days. Two or three concentration cells were prepared for each salt concentration.
For experiments using stainless-steel and lithium symmetric cells (σ, D, t+,SS, and mCI), three samples were prepared, the measurements were averaged, and the standard deviation is reported as the error. The error of t+,Ne and t+,CI is determined through propagation of these errors, not including that of the concentration cell measurements.
Results and Discussion
We measured the ionic conductivity, σ, salt diffusion coefficient, D, steady-state current transference number, t+,SS, and concentration cell potential, U, over a wide range of salt concentrations in 5 kg/mol (PEO-5K) and 275 kg/mol (PEO-275K) PEO electrolytes with LiTFSI salt at 90°C. Here, we use r to denote salt concentration, defined as the molar ratio of lithium ions per ether oxygen on the polymer, r = [Li+]/[O].
Figure 2a shows σ as a function of r, obtained by performing ac impedance spectroscopy on symmetric cells with blocking electrodes. The maximum σ in both polymers is approximately 2 × 10⁻³ S/cm, occurring at r = 0.08 in PEO-5K and r = 0.06 in PEO-275K. The dependence of conductivity on the molecular weight of PEO at r = 0.08 has been previously established by Teran and coworkers.29 At this concentration, conductivity is independent of molecular weight above 5 kg/mol, consistent with our results (Figure 2a). Both PEO-5K and PEO-275K show a non-monotonic dependence of σ on r. The most prominent difference between the concentration dependence of σ in our electrolytes is that PEO-5K has two local maxima at r = 0.08 and r = 0.18, whereas PEO-275K exhibits one broad peak, ranging from r = 0.04 to r = 0.18. At this point, it is not clear from where this difference arises. The data in Figure 2a are largely consistent with previous reports on PEO/LiTFSI electrolytes.30–35

Figure 2. (a) Ionic conductivity, (b) restricted diffusion, (c) steady-state current transference number, and (d) open-circuit potential of concentration cells of 5 kg/mol and 275 kg/mol PEO electrolytes as a function of LiTFSI salt concentration at 90°C.
In Figure 2b, we show D as a function of r, obtained from restricted diffusion measurements using lithium-polymer-lithium cells. The concentration dependence of D in our electrolytes shows two peaks in PEO-5K and one broad peak in PEO-275K, analogous to the concentration dependence of σ observed in Figure 2a. The values of D in PEO-5K are greater than those obtained in PEO-275K throughout most of the concentration range. The maximum D in PEO-5K is 1.3 × 10⁻⁷ cm2/s (r = 0.06), which is approximately double that observed in PEO-275K, 6.9 × 10⁻⁸ cm2/s (r = 0.08). The molecular weight dependence of the salt diffusion coefficient in polymer electrolytes is not well understood. Two previous studies have reported on D in PEO/LiTFSI mixtures with salt concentrations near r = 0.08: Mullin et al. reported D = 1.1 × 10⁻⁷ cm2/s for 27 kg/mol (r = 0.085, 90°C)36 and Edman et al. reported D = 4.6 × 10⁻⁸ cm2/s for 5,000 kg/mol (r = 0.083, 85°C).27 Our measurements of D in PEO-5K fall close to the value reported by Mullin et al., while our measurements of D in PEO-275K are between the values reported by Mullin and Edman. It is clear that D exhibits a significant dependence on molecular weight above 5 kg/mol, in contrast to σ which is independent of molecular weight above 5 kg/mol.
Figure 2c shows t+,SS, the transference number obtained by measuring the steady-state current in lithium-polymer-lithium cells, as functions of r in our PEO electrolytes. It has been established that this is not the rigorously defined transference number.18–20 Nonetheless, t+,SS is an important parameter as it describes the fraction of the initial current that is sustained at steady-state for a given electrolyte. In Figure 2c, the values of t+,SS of PEO-5K and PEO-275K fall within error of one another, with the exception of r = 0.3. In both cases, t+,SS decreases as a function of r until r = 0.16, and then increases monotonically. Our data are in excellent agreement with a previous report of t+,SS in PEO/LiTFSI electrolytes by Pożyczka et al.35
Figure 2d shows U as a function of ln(m), where U is the potential measured in a concentration cell of the form Li | PEO/LiTFSI (rref) | PEO/LiTFSI (r) | Li, and m is the molality of the PEO/LiTFSI (r) electrolyte. The reference salt concentration, rref, was 0.06 in both PEO-5K and PEO-275K. The relevant parameter for our study is dU/dln(m); thus the choice of rref is arbitrary. We take U to be positive when r < rref and negative when r > rref. While there is good agreement between U at high salt concentrations (ln(m) > 0), the values of U in PEO-5K and PEO-275K deviate slightly at lower salt concentrations (ln(m) ≤ 0). Following the approach introduced by Ma et al.,21 each data set is fit to an expression as a function of ln(m). The polynomial expression thus obtained for PEO-5K is
![Equation ([5])](https://content.cld.iop.org/journals/1945-7111/165/13/A3014/revision1/d0005.gif)
and for PEO-275K is
![Equation ([6])](https://content.cld.iop.org/journals/1945-7111/165/13/A3014/revision1/d0006.gif)
These equations are shown as solid curves in Figure 2d. Taking the derivative of Eq. 5 and Eq. 6 gives us the concentration dependence of dU/dln(m) for both PEO polymers, which are consistent with those published by Edman et al. using a 5000 kg/mol PEO/LiTFSI electrolyte.27
The relationship between the electrolyte characteristics shown in Figure 2 and the cation transference number, t+,Ne, has been defined by Newman and coworkers.19,20,37
![Equation ([7])](https://content.cld.iop.org/journals/1945-7111/165/13/A3014/revision1/d0007.gif)
Figure 3a shows t+,Ne as a function of r in PEO-5K and PEO-275K. The concentration dependence of t+,Ne observed in both electrolytes is complex, exhibiting two local maxima at high and low salt concentrations (r = 0.08 and r = 0.21 for PEO-5K, r = 0.06 and r = 0.24 for PEO-275K) and one local minimum at intermediate salt concentrations (r = 0.16). Comparing the values of t+,Ne in both electrolytes, we find that t+,Ne of PEO-275K lies above that of PEO-5K at low salt concentrations (r ≤ 0.06), but there is excellent agreement at intermediate and high salt concentrations (r ≥ 0.08). Further work is required to determine the underpinnings of the molecular weight dependence of t+,Ne at low salt concentrations.
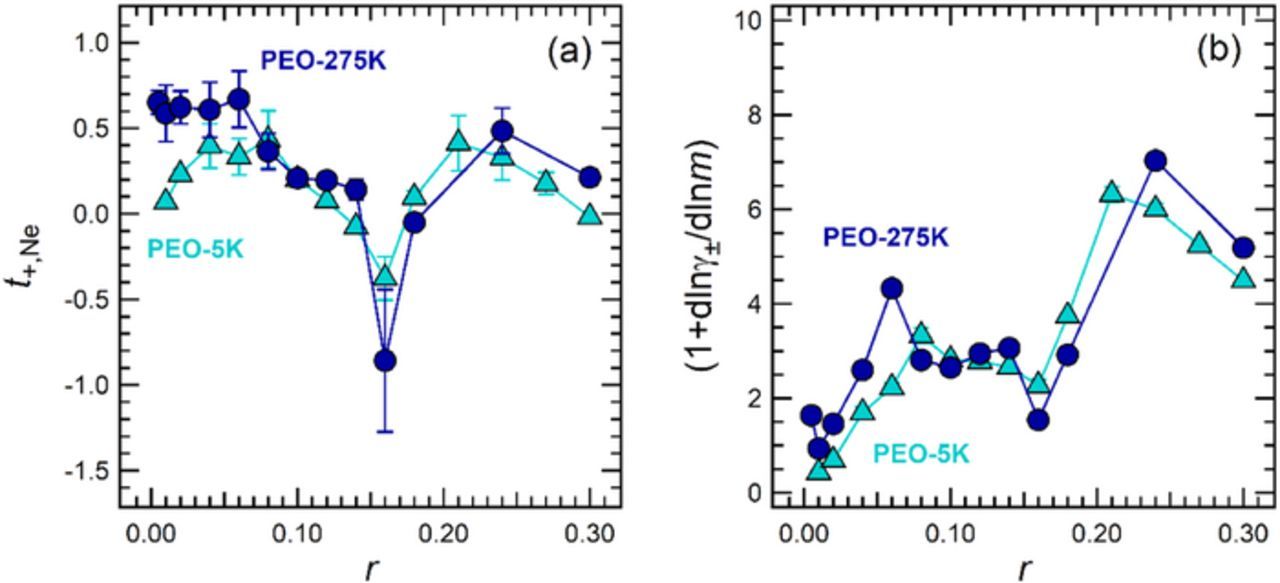
The sign of t+,Ne at r = 0.16 is negative in both PEO electrolytes. The existence of negative transference numbers in polymer electrolytes has been acknowledged in previous literature,21–23 and is the topic of recent work from our group.31,37 The sign of the transference number provides some insight into the ionic speciation in the electrolyte. If all ions in the system exist as free cations and anions, the transference number must be positive. A negative transference number suggests that a majority of ions exist as complex species such as negatively-charged triplets or higher-order aggregates.21 At r = 0.16, the concentration at which t+,Ne exhibits a sharp minimum, the ratio of ether oxygens to Li+ is approximately 6:1. Molecular simulations of PEO/LiTFSI electrolytes indicate that the solvation shell of Li+ comprises six ether oxygens.38,39 Thus, in the vicinity of r = 0.16, all solvation sites on the polymer are likely to be saturated, and one might expect that additional salt molecules dissolved into the electrolyte will form aggregates due to the absence of available solvation sites. Our conclusion is in reasonable agreement with previously published spectroscopic studies of PEO/LiTFSI electrolytes, which have concluded that ionic aggregation is present for r > 0.12.40,41 Further studies are needed to establish the underpinnings of negative transference numbers in polymer electrolytes, as well as the underlying factors that lead to the reemergence of positive transference numbers at high salt concentrations.
The thermodynamic factor, (1+dlnγ±/dlnm), provides information about how the mean molal activity coefficient, γ±, of the electrolyte changes with m of the solution. This quantity is calculated using the following relationship20
![Equation ([8])](https://content.cld.iop.org/journals/1945-7111/165/13/A3014/revision1/d0008.gif)
where t+ is the cation transference number that, in principle, can be determined using a variety of approaches. We use t+,Ne (Figure 3a) and dU/dln(m) (Figure 2d) to calculate (1+dlnγ±/dlnm) as a function of r. In Figure 3b, we report on the thermodynamic factor of PEO-5K and PEO-275K electrolytes. The value for thermodynamic factor in an ideal solution is unity. Given that our data for (1+dlnγ±/dlnm) are greater than one throughout much of the concentration range (Figure 3b), we conclude that our electrolytes are nonideal at most concentrations (r ≥ 0.04). It is clear that the thermodynamic factor in both PEO electrolytes is similar, suggesting that the activity coefficient of PEO/LiTFSI mixtures is independent of polymer molecular weight above 5 kg/mol.
An alternative approach for measuring t+ using concentrated solution theory relies on the current interrupt technique. This technique consists of polarizing a lithium-polymer-lithium cell at current density, i, for time, t, and measuring the open-circuit potential (OCV) of the cell immediately after the current is interrupted. Figure 4a shows typical data obtained from this experiment, plotted in the form of OCV versus it0.5 as suggested by Ma et al.21 These plots are expected to be linear in the limit of small it0.5. The important experimental quantity is the slope, mCI, of the OCV versus it0.5 plot. Comparing the slopes of the data in Figure 4a, at r = 0.08 the slope of the PEO-5K data is larger than that of PEO-275K, while at r = 0.14 the slope of the data from both electrolytes is approximately the same. It is clear that the concentration dependence of mCI is different in PEO-5K and PEO-275K. Figure 4b shows mCI as a function of r for both electrolytes. There is a significant difference between mCI in our electrolytes at low concentrations (r ≤ 0.12), where the values of mCI in PEO-5K are more than double those in PEO-275K at many concentrations. At high concentrations we observe good agreement.
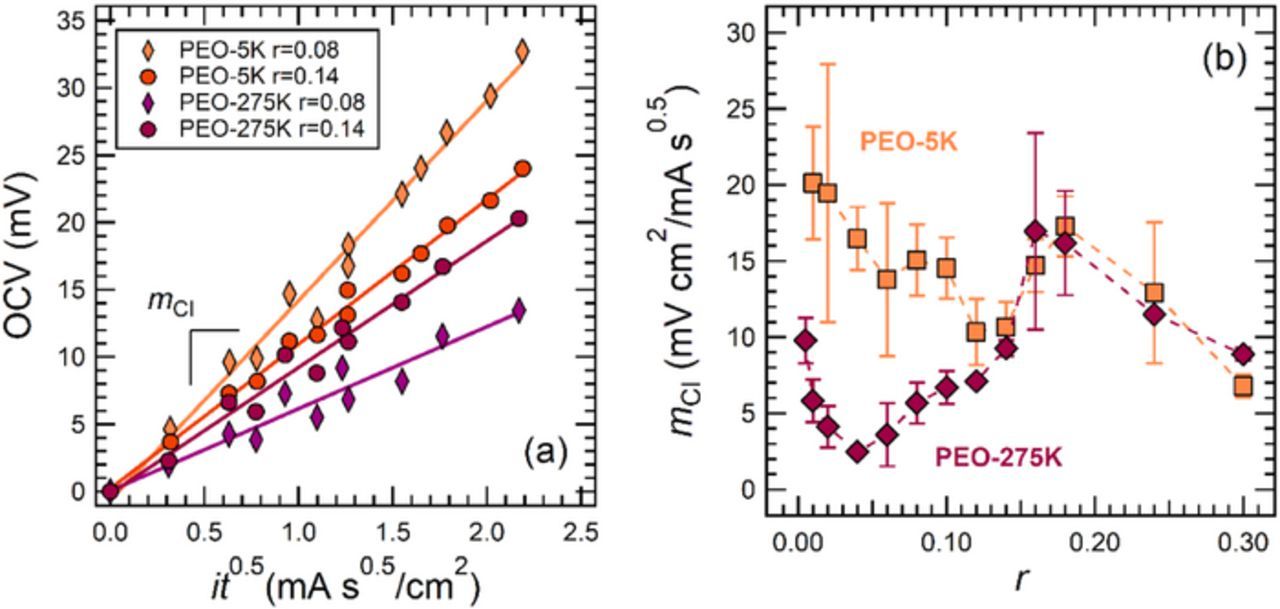
Figure 4. (a) Current interrupt data from 5 kg/mol and 275 kg/mol PEO at r = 0.08 and r = 0.14. Data represent an average of multiple samples; error bars are excluded for clarity. (b) The slope, mCI, of the OCV versus it0.5 plots at all salt concentrations in this study. Error bars represent the standard deviation of the data taken from multiple samples.
We calculate the transference number based on the current interrupt technique, t+,CI, using an equation derived by Ma et al.,21
![Equation ([9])](https://content.cld.iop.org/journals/1945-7111/165/13/A3014/revision1/d0009.gif)
where mCI is given in Figure 4b, D is given in Figure 2b, and dln(c)/dU is obtained by fitting the concentration cell data in Figure 2d in terms of ln(c), instead of ln(m). The dependence of m on c in PEO/LiTFSI is given in Table I.
In Figure 5a, we compare our results for t+,Ne and t+,CI in PEO-275K. The results from both approaches are in excellent agreement and fall within error at most concentrations in this study. The maximum value of t+,CI is 0.65 ± 0.06 (r = 0.04), while that of t+,Ne is 0.67 ± 0.17 (r = 0.06). The minimum value of t+,CI is −0.78 ± 0.30 (r = 0.16), while that of t+,Ne is −0.86 ± 0.42 (r = 0.16). The agreement observed in Figure 5a is noteworthy given the complexity of the dependence of t+ on r. The comparison of t+,Ne and t+,CI in PEO-5K electrolytes is given in Figure 5b. Here we observe significant disagreement between these two parameters, particularly at low salt concentrations. The sign of t+,CI is negative at all values of r with the exception of r = 0.3, whereas the sign of t+,Ne is negative only at r = 0.14, 0.16, and 0.3. The minimum value of t+,CI is −3.0 ± 1.3 (r = 0.02), while that of t+,Ne is −0.38 ± 0.13 (r = 0.16). The reason for this disagreement is an interesting, open question. In theory, both approaches should yield the same results. However, our results show that in some instances experimental factors may lead to a discrepancy between t+,Ne and t+,CI.
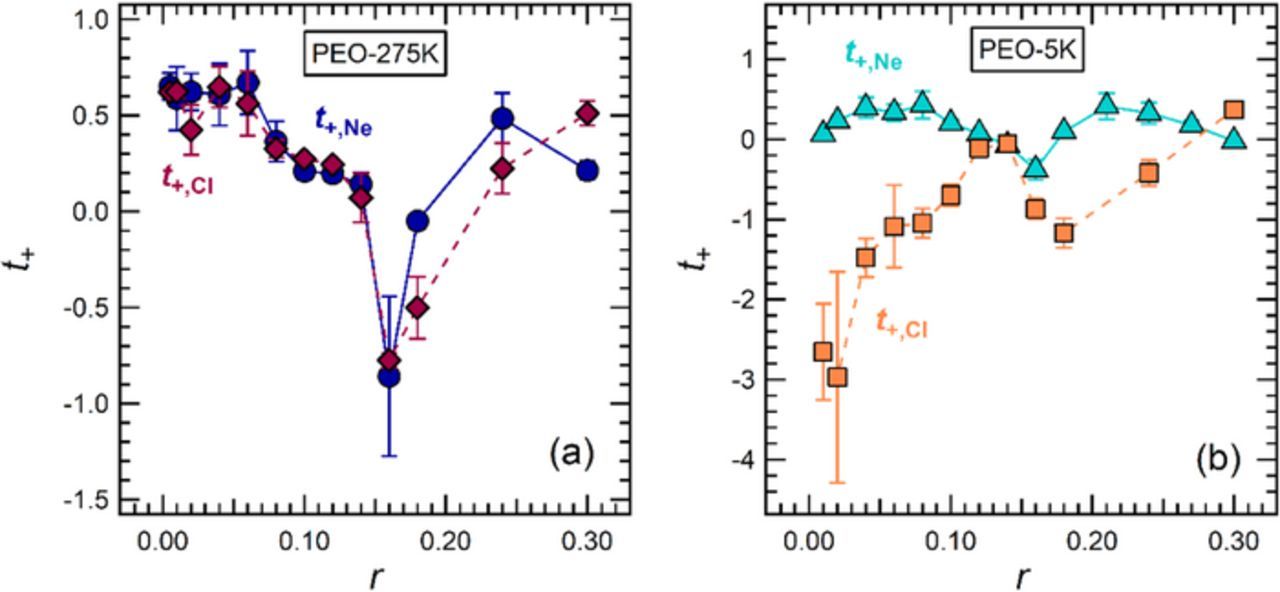
Figure 5. Comparison between different transference number measurements (t+,Ne and t+,CI) for (a) 275 kg/mol and (b) 5 kg/mol PEO electrolytes as a function of LiTFSI salt concentration at 90°C.
We posit that the discrepancy in Figure 5b arises due to differences in the electrode-electrolyte interfaces formed in our lithium-polymer-lithium cells. At the beginning of our experiments, cells were cycled 5 times using a constant current density of 0.02 mA/cm2; we refer to these as conditioning cycles. Our objective was to complete the formation of stable solid electrolyte interface (SEI) layers prior to making electrochemical measurements (D, t+,SS, and mCI). To evaluate the nature of the SEI layers, we perform ac impedance spectroscopy on our lithium-polymer-lithium cells over the course of our experiments. Examples of these measurements are shown in Figure 1. The impedance data exhibited the standard signatures seen in symmetric cells with non-blocking electrodes: a bulk resistance, Rb, reflecting the resistance of ion transport in the polymer electrolyte, and an interfacial resistance, Ri, reflecting the resistance of charge transfer at the polymer-lithium interface. The values of Rb were independent of time and consistent with those expected based on our ac impedance measurements using blocking electrodes (Figure 2a). In contrast, Ri showed a significant dependence on time and salt concentration in some cases. Further analysis of Ri provides insight into the disagreement observed between t+,Ne and t+,CI in Figure 5b.
Measurements of interfacial resistance obtained initially, Ri,0, post conditioning cycles, Ri,c, and at the end of the experiments, Ri,f, are reported for PEO-275K (Figure 6a) and PEO-5K (Figure 6b). Note that Ri,0 is measured after annealing the cells for 4 hours at 90°C; thus, the system is expected to be thermally equilibrated. The dependence of interfacial resistance on salt concentration is clearly affected by polymer molecular weight. In PEO-275K, Ri,0 is a strong non-monotonic function of r, reaching a maximum value of 554 Ωcm2 (r = 0.16). In contrast, in PEO-5K, Ri,0 is nearly independent of r, reaching a maximum value of 51 Ωcm2 (r = 0.16). The underpinnings of this observation are not well understood. In the case of PEO-275K, Ri,0, Ri,c, and Ri,f are within experimental error across the entire salt concentration window (Figure 6a). In the case of PEO-5K, only Ri,c and Ri,f are in agreement at all r, both significantly greater than Ri,0 at low salt concentrations (Figures 6b). It is important to note that the agreement between Ri,c and Ri,f in Figures 6a and 6b demonstrates that the SEI layer has reached steady-state prior to the point where electrochemical measurements are being conducted for both PEO-5K and PEO-275K. To our knowledge, the data in Figure 5 represent the first report of the effect of salt concentration and polymer molecular weight on interfacial impedance.

Figure 6. Interfacial resistance taken initially, Ri,0, after the conditioning cycles, Ri,c, and at the end of the experiment, Ri,f, from lithium-polymer-lithium cells with (a) 275 kg/mol and (b) 5 kg/mol PEO with LiTFSI at 90°C.
Comparing Ri,0 and Ri,c provides information about the evolution of the charge transfer resistance at the lithium-polymer interface over the course of the conditioning cycles. In PEO-275K, the charge transfer resistance is stable during the conditioning cycles, demonstrated by the fact that there is reasonable agreement between Ri,0 and Ri,c in Figure 6a. In PEO-5K however, at many concentrations Ri,c is significantly larger than Ri,0 indicating that the conditioning cycles lead to the formation of resistive electrode-electrolyte interfaces that impede charge transfer. The concentration of chain ends in PEO-5K is significantly higher than that in PEO-275K. The formation of resistive layers in PEO-5K may be attributed to reactions between the end groups and Li metal; the reaction between –OH groups and Li metal is well-established.42 The increase in Ri during conditioning cycles in PEO-5K is most pronounced at low salt concentrations (r < 0.12). Perhaps, the presence of LiTFSI at high concentrations slows down the reaction between –OH groups and Li metal. We note that r < 0.12 is also the concentration range where the differences between t+,Ne and t+,CI in PEO-5K are most significant (Figure 5b). Further study is required to determine the influence of interface layers on the measurements of on t+,CI.
It is important to recognize that t+,Ne is derived from measurements of σ, t+,SS, D and U (see Eq. 7), whereas t+,CI is derived from measurements of mCI, D, and U (see Eq. 9). Thus, discrepancies between these two approaches must originate from the effect of interface layers on σ, t+,SS and mCI; D and U are used in both approaches and the effect of interface layers on these parameters cannot be the cause of the observed discrepancies. One notable difference is the length scales over which the measurements take place. Ac impedance spectroscopy and the steady-state current measurement are both techniques that probe the bulk of the electrolyte: σ is obtained by measuring the bulk resistance in a stainless-steel symmetric cell and t+,SS is obtained by polarizing a lithium-polymer-lithium cell for long periods of time generating concentration gradients that span the electrolyte. In contrast, the current interrupt technique is a more surface-sensitive technique, as mCI is obtained by polarizing a lithium-polymer-lithium cell for short periods of time generating concentration gradients that are localized near the electrode surface. In a perfect system where the electrolyte near the electrode surface is representative of the bulk electrolyte, t+,Ne and t+,CI should be in agreement. This appears to be true for PEO-275K (Figure 5a), and this scenario is shown in Figure 7 (left). However, if the electrolyte near the electrode surface is more resistive than the bulk, as is suspected to be the case for PEO-5K, then there might be a discrepancy between t+,Ne and t+,CI (Figure 5b), and this scenario is shown in Figure 7 (right). We believe t+,Ne to be the more robust approach for measuring the transference number of an electrolyte because the measurements required to determine this parameter are not sensitive functions of interfacial impedance.
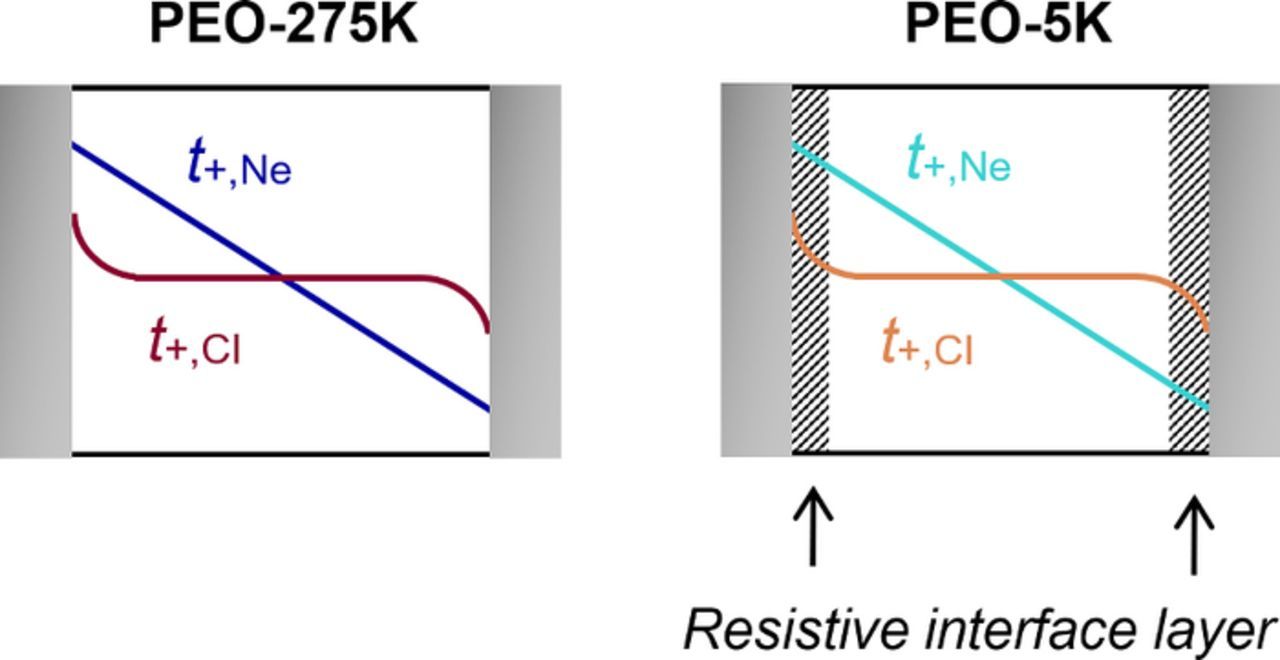
Figure 7. Representation of the length scales over which salt concentration gradients form in the electrolyte during our transference number measurements in lithium-polymer-lithium cells: t+,CI probes the electrolyte near the electrode surface whereas t+,Ne probes the bulk electrolyte. This may explain the discrepancy between t+,Ne and t+,CI in PEO-5K (Figure 5b) where a resistive interfacial layer is thought to be present at the lithium surface.
Conclusions
We have compared two different electrochemical approaches for measuring the transference number of an electrolyte. A new approach proposed by Balsara and Newman19 (t+,Ne) is compared against the well-established approach by Ma et al.21 (t+,CI) using two different electrolytes: 5 kg/mol PEO (PEO-5K) and 275 kg/mol PEO (PEO-275K) mixed with LiTFSI. Both approaches are based on concentrated solution theory and require a combination of electrochemical measurements. Many of the measurements involve symmetric cells with lithium electrodes.
The complex dependence of t+,Ne on salt concentration in PEO-5K and PEO-275K is similar, both exhibiting two maxima at low and high salt concentrations, and a sharp minimum at intermediate salt concentrations where the value of t+,Ne is negative. For PEO-275K, t+,CI and t+,Ne are within error across most of the salt concentration window. In contrast, in PEO-5K there is a substantial difference between the t+,CI and t+,Ne, especially at low salt concentrations. We attribute this to the fact that the parameters measured to obtain t+,CI are sensitive to the nature of the lithium electrode-electrolyte interfaces. In contrast, the parameters measured to obtain t+,Ne are insensitive to the nature of the lithium electrode-electrolyte interfaces. Our work thus suggests that t+,Ne is a more robust measure of the transference number.
List of Symbols
| a | area of electrolyte (cm2) |
| c | salt molarity (mol/L) |
| D | salt diffusion coefficient (cm2/s) |
| F | Faraday's constant (96485 C/mol) |
| i | current density (mA/cm2) |
| iss | steady-state current density (mA/cm2) |
| iΩ | initial current density calculated according to Ohm's law (mA/cm2) |
| L | thickness of the electrolyte (μm) |
| m | salt molality (mol/kg) |
| mCI | slope of the OCV versus it0.5 data (mV cm2/mA s0.5) |
| MEO | molar mass of the ethylene oxide repeat unit (44.05 g/mol) |
| r | molar ratio of lithium ions to ether oxygens, r = [Li+]/[O] |
| rref | reference concentration used in concentration cells |
| R | gas constant (J/mol K) |
| Rb | bulk resistance (Ω cm2) |
| Rb,0 | initial bulk resistance (Ω cm2) |
| Rb,SS | bulk resistance at steady-state (Ω cm2) |
| Ri | interfacial resistance (Ω cm2) |
| Ri,0 | initial interfacial resistance (Ω cm2) |
| Ri,SS | interfacial resistance at steady-state (Ω cm2) |
| Ri,c | interfacial resistance post conditioning cycles (Ω cm2) |
| Ri,f | interfacial resistance at the end of the experiments (Ω cm2) |
| t | time (h) |
| t+ | cation transference number |
| t+,CI | transference number obtained by the approach of Ma et al.19 |
| t+,Ne | transference number obtained by the approach of Balsara and Newman19 |
| t+,SS | transference number obtained using steady-state current method |
| T | temperature (K) |
| U | potential of a concentration cell (mV) |
| v | total number of ions into which the salt dissociates |
| v+, v- | the number of cations and anions into which the salt dissociates |
| z+, z- | charge number of cation and anion |
| 1+dlnγ±/dlnm | thermodynamic factor |
Greek
| σ | ionic conductivity (S/cm) |
| ρ | density (g/L) |
| ΔV | applied potential (mV) |
| γ± | mean molal activity coefficient of the salt |
Acknowledgments
This work was intellectually led by the Joint Center for Energy Storage Research (JCESR), an Energy Innovation Hub funded by the U.S. Department of Energy (DOE), Office of Science, Basic Energy Sciences (BES), under Contract No. DEAC02-06CH11357. The authors declare no competing financial interest.
ORCID
Nitash P. Balsara 0000-0002-0106-5565