Abstract
The electrochemical oxidation of LiPF6-based electrolytes is reported to generate POF3 gas. In order to enable a quantitative analysis of the LiPF6 decomposition reactions, we aimed to establish calibration factors for POF3 and PF5 in on-line electrochemical mass spectrometry (OEMS). Thermal decomposition of dry LiPF6 is expected to yield PF5, but instead all PF5 is detected as POF3 in our OEMS setup, rendering a differentiation of the two gases impossible and presenting an artefact which likely occurs with most on-line mass spectrometry systems due to the high reactivity of PF5. However, we can still determine a cumulative calibration factor for POF3 + PF5 (referred to as "POF3"), which is then used to investigate the evolution of gases during the oxidation of an EC/LiPF6 electrolyte on a carbon black electrode. Mechanistic experiments with protons or water added to EC/LiPF6 electrolyte show that protons trigger the formation of PF5, while the kinetics for the hydrolysis of LiPF6 with water at room temperature are too slow to be detectable. These findings let us conclude that the oxidation of EC generates highly acidic species, which cause the decomposition of PF6− to PF5 and HF; the PF5 is then detected as POF3 in the OEMS.
Export citation and abstract BibTeX RIS

This is an open access article distributed under the terms of the Creative Commons Attribution 4.0 License (CC BY, http://creativecommons.org/licenses/by/4.0/), which permits unrestricted reuse of the work in any medium, provided the original work is properly cited.
Lithium hexafluorophosphate (LiPF6) is commonly used as a salt in Li-ion battery electrolyte solutions due to its high ionic conductivity and passivating properties toward the aluminum cathode current collector.1 However, its thermal instability limits the operating temperature range for Li-ion batteries to < 60°C, whereas its reactivity with water calls for dry-room manufacturing of cells. The corresponding primary decomposition pathways are: i) the thermal dissociation of LiPF6, leading to PF5 and LiF; and, ii) the hydrolysis of LiPF6 or PF5, resulting in the formation of HF and POF3.
A quantitative thermal dissociation of dry LiPF6 occurs between 100 and 200°C, depending on the experimental conditions (i.e., sealed or open containers,2 sample size),3,4 according to the following equilibrium:2–5
![Equation ([1])](https://content.cld.iop.org/journals/1945-7111/165/13/A3022/revision1/d0001.gif)
Common Li-ion battery electrolytes, namely anhydrous solutions of LiPF6 in a mixture of ethylene carbonate (EC) and dialkyl carbonates, show negligible thermal aging up to 60°C.6,7 If storage temperatures of 80°C are exceeded, the electrolyte solution darkens and forms large amounts of gas within days.2,8–11 Next to PF5,2 also alkyl fluorophosphates,2,7,9–14 oligomers of the carbonate solvents,8,10 fluorinated hydrocarbons,2,10,11 POF3,13 and HF13,14 have been found in thermally aged (80–100°C) electrolyte solutions, indicating that not only LiPF6, but also the organic carbonate solvent itself is decomposed. However, the observed quantities differ significantly across studies. Campion et al.9,10 and Guillot et al.11 showed that impurities like alcohols and water increase the amount of side products at high temperatures. Furthermore, electrolytes stored in glass vials between 60–85°C show about 100 times more decomposition products compared to the same electrolytes stored in polymer or aluminum containers,7,14 as the etching of SiO2 by HF generates water, leading to a self-accelerating decomposition of the electrolyte solution.15,16 Hence, it is clear that the purity of the electrolyte and the testing conditions substantially affect the thermal stability of LiPF6-based electrolytes.
The hydrolysis of LiPF6 with trace water in Li-ion battery electrolyte solutions occurs already at room temperature, although a complete conversion needs days to weeks.17–21 The main product of LiPF6 hydrolysis with H2O is HF and POF3 (see Equation 2);21,22 the latter is further hydrolyzed to HPO2F2 according to Equation 3.18,19,23 The first reactions leads to a 2:1 molar ratio of formed HF to consumed water, as recently found by Strmcnik et al.21 At temperatures below 60°C, no reactions between the organic electrolyte solvent with PO2F2− or HF generated from LiPF6 hydrolysis have been reported.19,23
![Equation ([2])](https://content.cld.iop.org/journals/1945-7111/165/13/A3022/revision1/d0002.gif)
![Equation ([3])](https://content.cld.iop.org/journals/1945-7111/165/13/A3022/revision1/d0003.gif)
Besides these two major decomposition pathways, LiPF6 also affects the stability of the electrolyte solvents at high potentials. Density functional theory (DFT) calculations indicate that the oxidation potential of EC-PF6− complexes is lower than for isolated EC, and that HF and PF5 can be formed from the oxidized complexes at room temperature.24,25 Tebbe et al.26 suggested that coordination to PF5 reduces the activation energy for EC dimer formation or ring opening. In fact, PF5 has been reported to slowly react with carbonate electrolytes already at room temperature,8 and alkyl fluorophosphates (the characteristic products of PF5 with organic carbonates) have been found in cells cycled to potentials above 5.2 V vs. Li/Li+.12,27 Still, PF5 has not been observed directly during electrochemical electrolyte oxidation so far. Instead, POF3 has been detected at high potentials in LiPF6-based electrolytes,28–33 where it was ascribed to a reaction of LiPF6 or PF5 with water or other reactive oxygen-containing species formed during the oxidation of the electrolyte solvent. While this is plausible for experiments where water or reactive oxygen species are likely to be formed, i.e., in the presence of oxygen-releasing cathode materials,28,29,34 the quantitative formation of POF3 during electrolyte oxidation on inert materials which do not release oxygen upon charge like high-voltage spinel or carbon black still lacks fundamental understanding.31–36
To understand the origin of PF5 and POF3 at high potentials in LiPF6-based electrolytes, a quantification of the evolved amounts of these gases is essential. Therefore, this work aims at quantifying PF5 and POF3 by on-line electrochemical mass spectrometry (OEMS). As a first step, we investigate the decomposition of dry and wet LiPF6 by thermogravimetric analysis coupled with mass spectrometry (TGA-MS). We then thermally decompose LiPF6 in a modified OEMS cell setup that can be heated up to 250°C. As dry LiPF6 dissociates completely to LiF and PF5 at temperatures >200°C according to our TGA-MS analysis (consistent with the literature),2–5 we thus can now correlate the ion currents at different mass channels to the gas concentration in the cell. The absence of PF5 signals due to its high reactivity with OEMS system components ultimately provides an explanation why PF5 so far has never been detected in on-line mass spectrometric measurements on lithium ion battery cells. Lastly, we investigate the oxidative stability of an EC/LiPF6 electrolyte on a carbon black working electrode, thereby focusing on the POF3 quantification, and resolve the origin of what appears as "POF3" at high potentials in on-line mass spectrometry measurements on Li-ion batteries.
Experimental
Thermogravimetric analysis coupled with mass spectrometry
Thermogravimetric analysis of lithium hexafluorophosphate (LiPF6, BASF SE, Germany) was conducted with a Mettler Toledo TGA coupled to a mass spectrometer (Thermostar TGA-MS, Pfeiffer Vacuum, Germany). Prior to the experiments, the LiPF6 was dried at 70°C for 18 h under dynamic vacuum in a glass oven (Buechi, Switzerland) without exposure to air after the drying step. Then, ∼150 mg LiPF6 were filled into a sapphire crucible inside an Ar-filled glove box (MBraun, Germany) and transferring the crucible into the TGA chamber. For the "dry" experiment, the sample was heated at 10 K/min to 120°C and then held for 1 h at 120°C in a dry argon flow (5.0 purity, 60 mL/min) to remove any traces of H2O. The sample was then ramped up to 350°C at 10 K/min, where the temperature was held for another 10 min to ensure a complete decomposition of LiPF6. For the "wet" experiment, the argon gas (60 mL/min) was saturated with water at room temperature and purged over the LiPF6 sample. After resting for 1 hour at room temperature under the wet argon flow, the sample was heated at a rate of 10 K/min to 350°C, where the temperature was again kept constant for 10 min.
Modified on-line electrochemical mass spectrometry setup
To measure the decomposition of LiPF6 in our on-line electrochemical mass spectrometer (OEMS),37 we designed a modified cell setup (see Figure 1). As pre-tests showed that typical polymer sealings were either not tight at high temperatures or not stable against the evolving PF5 gas, we used a Swagelok T-fitting with two metal end caps. The third opening of the T-cell was equipped with the crimped capillary leak that connects the T-fitting to the mass spectrometer (this is also part of our regular OEMS system and has been described previously).37 All cell parts were dried at 70°C under dynamic vacuum prior to assembly. The modified cell was equipped with a thermocouple to monitor the cell temperature and was wrapped with a heating cord (Horst GmbH, Germany); the entire assembly was thermally insulated by fiber cloth (see red shaded area in Figure 1). Tightness of the modified Ar-filled cell was tested in pre-runs of the actual experiments (i.e., holding the cell at temperatures >200°C during several hours), validating that the mass traces m/z = 28 (N2) and m/z = 32 (O2) remained negligible. For the three here shown LiPF6 decomposition runs, 0.26, 0.96, or 1.08 mg LiPF6 (± 0.04 mg) was weighed into a TGA crucible inside an Ar-filled glove box. The crucible was then transferred into the modified OEMS cell. The cell was closed inside the Ar-filled glove box and connected to the OEMS. After a rest period of 40 min at 25°C, the temperature was increased to 225°C and held there for ∼4 h. The m/z signals were evaluated by dividing the ion current of the respective channel by the ion current of the 36Ar isotope and subtracting the background during the initial rest period at 25°C.
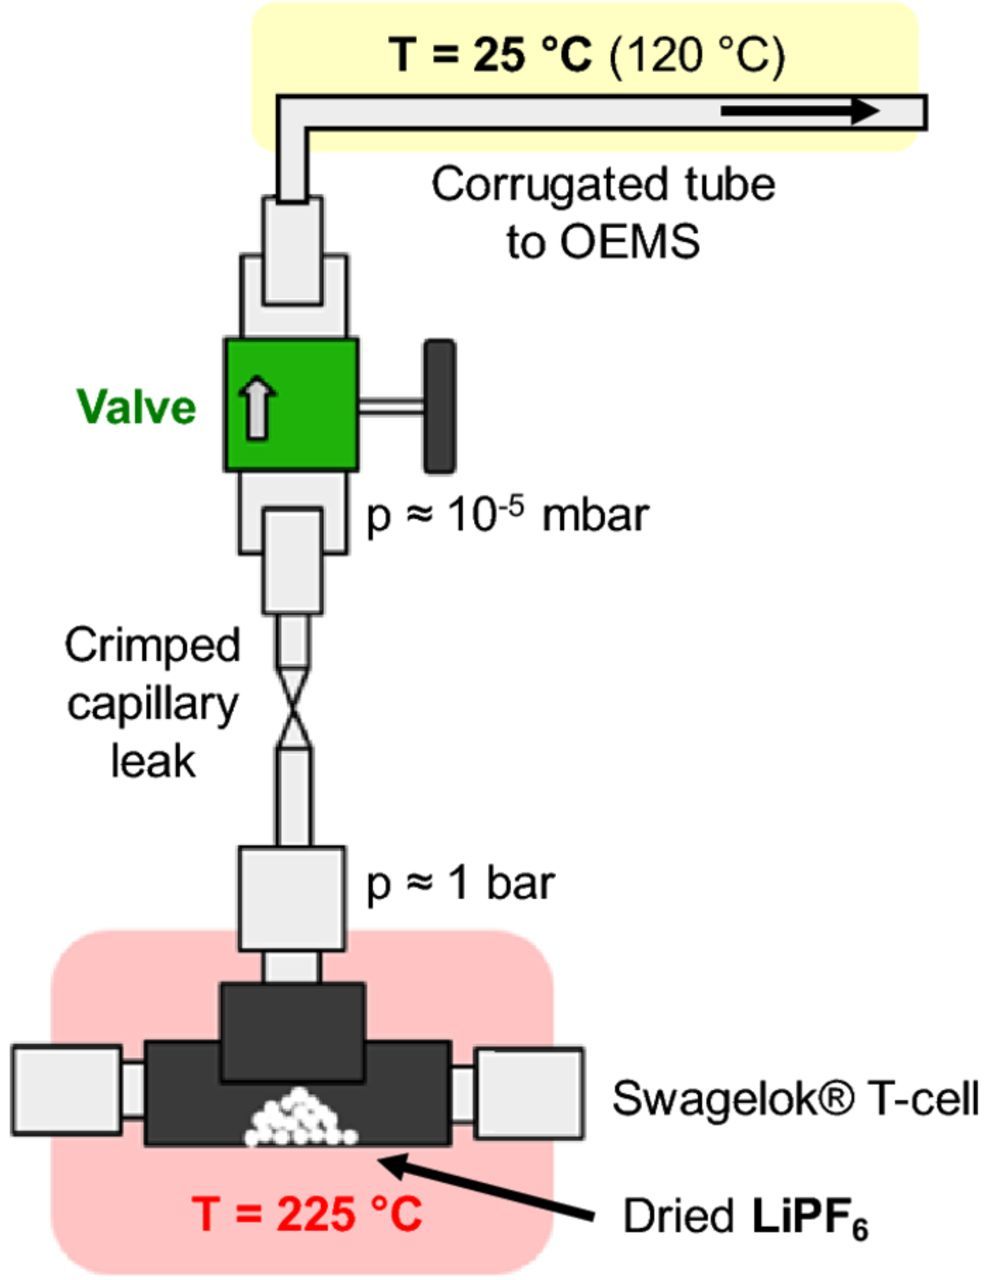
Figure 1. Modified OEMS cell setup used for the thermal decomposition of LiPF6 consisting of a Swagelok T-cell fitted to a crimped capillary tube, which is connected to the mass spectrometer as described in Ref. 37. The T-cell is then heated to 225°C (red shaded area). The corrugated tube connecting the capillary and the OEMS (yellow shaded area) is normally kept at ambient temperature (i.e., 25°C); for the experiment shown in Figure 4c, the corrugated tube was heated to 120°C for 48 h prior to the experiment.
On-line electrochemical mass spectrometry
Hydrolysis and electrochemical oxidation of 1.5 M LiPF6 in ethylene carbonate (EC, BASF SE, Germany) was investigated in our regular OEMS cell setup. Note that this system is unfortunately not able to trace HF, as the mass signal for hydrofluoric acid (m/z = 20) superposes with the signal of the 20Ar isotope. For hydrolysis experiments, 5000 ppm H2O or 5000 ppm methanesufonic acid (99.5%, Sigma-Aldrich, USA) were added to the EC/LiPF6 electrolyte. After stirring for 30 s, 240 μL of the electrolyte were transferred into an empty OEMS cell (without any electrodes or separators present). The cell was then placed into a temperature chamber set to 10°C and connected to the OEMS. In this way, any hydrolysis reactions occurring at room temperature before the start of the experiment were minimized. The temperature chamber was then set to constant temperature hold steps of 10°C, 25°C, 40°C, and 60°C, each for 3 h, as previously described by Metzger et al.38 Finally, the temperature was set to 80°C for 12 h to follow the long-term reactions of LiPF6 decomposition products.
For electrochemical oxidation measurements, 500 mg carbon black (C65, Timcal, Imerys, Switzerland) was mixed with 500 mg polyvinyl difluoride (PVDF, Kynar HSV 900, Arkema, France) and 10 mL N-methyl-pyrrolidone (NMP, anhydrous, Sigma-Aldrich, United States) in a planetary mixer (Thinky Corp., USA) for 15 min at 2000 rpm and coated onto a PET separator (FS 24316, Freudenberg, Germany). After drying at 50°C, 15 mm electrodes (loading 1.8 mgC/cm²) were punched out, dried at 120°C under dynamic vacuum for 12 h, and then transferred to an Ar-filled glove box without exposure to air. The OEMS cell was assembled with a lithium metal counter electrode (450 μm thickness, Rockwood Lithium, USA), the carbon black coating as working electrode, and two 28 mm diameter PET separators (also dried at 120°C) soaked with 150 μL EC + 1.5 M LiPF6. Electrochemical measurements were performed by applying a linear sweep from open circuit voltage (∼3 V) to 5.5 V at a rate of 0.1 mV/s using a VMP-300 potentiostat (Biologic, France) after an initial 4 h OCV period.
Results
Thermal decomposition of dry and wet LiPF6
To understand which conditions are required to produce PF5 or POF3 in quantitative amounts, we first investigate the thermal decomposition of LiPF6 under dry and wet conditions by TGA-MS. The possible fragments of PF5 and POF3 and their corresponding m/z signals are listed in Table I; to evaluate the experiments, we chose m/z = 107 as a unique signal for PF5 and m/z = 85 as a unique signal for POF3.
Table I. Mass signals, corresponding mass fragments, and their relative intensity for PF5 and POF3. Data taken from the NIST Mass Spectrometry Data Center Ref. 39. The m/z = 107 and 85 signals (highlighted in bold) are unique for PF5 and POF3, respectively, and were chosen for the quantitative analysis of the two gases.
| Relative intensity [%] | |||
|---|---|---|---|
| Mass signal [m/z] | PF5 | POF3 | Fragment |
| 47 | - | 2.2 | PO |
| 50 | 4.9 | 4.1 | PF |
| 66 | - | 0.7 | POF |
| 69 | 3.8 | 16.9 | PF2 |
| 85 | - | 85.4 | POF2 |
| 88 | 4.4 | 2.3 | PF3 |
| 104 | - | 100 | POF3 |
| 107 | 100 | - | PF4 |
| 126 | 0.8 | - | PF5 |
Figure 2 shows the TGA-MS run of LiPF6 with a dry argon gas flow. As a sample transfer from the glove box to the TGA instrument under inert gas was not possible, we added a 1 hour isothermal period at 120°C (see 10–70 min in Figure 2) to the ramp of 10 K/min from room temperature to 350°C. Any physisorbed trace water from the sample transfer should be removed during this step. In fact, at the initial ramp from room temperature to 120°C (0–10 min), a small amount of water is released (purple line corresponding to m/z = 18 in Figure 2c) concomitant with a slight endothermic heat flux (orange line in Figure 2b). Both sample mass and heat flow remain constant during the end of the isothermal step at 120°C (10–70 min), meaning that all physisorbed water has been desorbed. Once the temperature in the subsequent ramp from 120 to 350°C (70–93 min) reaches 165°C (see red dotted lines), a significant endothermic mass loss of 83% referenced to the original mass occurs (see Figure 2b). At the same time, a peak in the mass trace m/z = 107 (blue line in Figure 2c) is observed. Both the formation of PF5 and the mass loss of 83% are consistent with the quantitative thermal decomposition of LiPF6 according to Equation 1. Interestingly, the found decomposition onset is 30–60°C higher compared to previous reports with a comparable setup.2,4,5 This could be due to the large sample size (150 mg) used in the present study, as the resulting higher concentration of PF5 leads to a thermodynamic shift of the equilibrium toward LiPF6.2,3
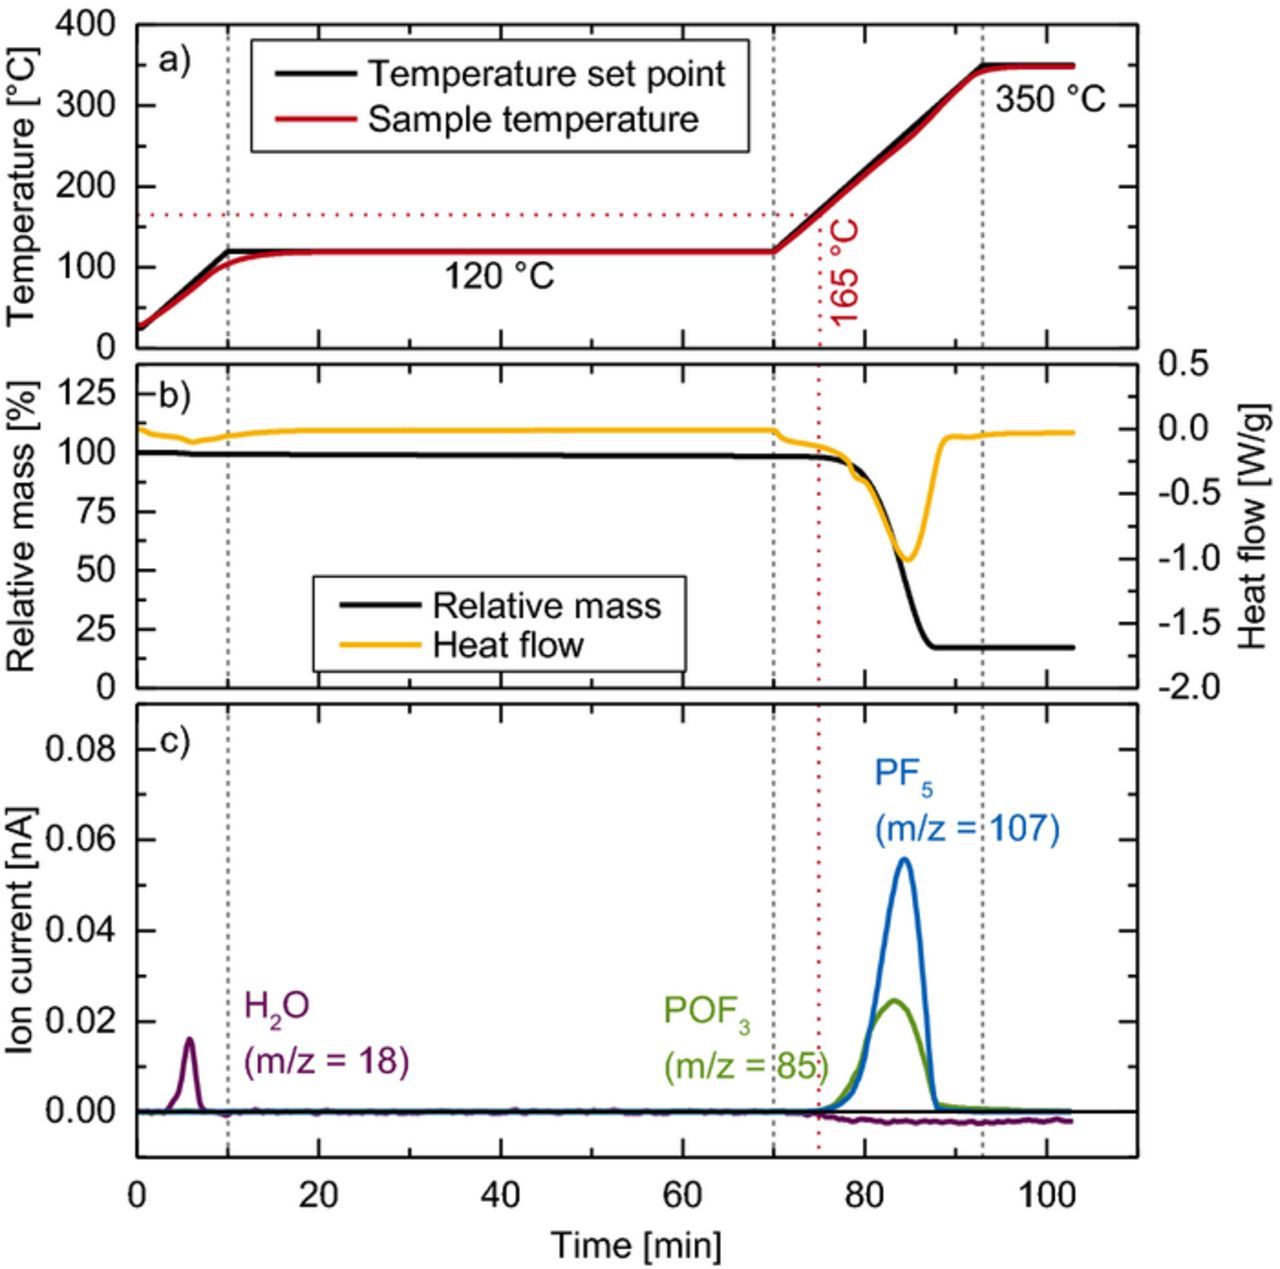
Figure 2. TGA-MS data on the thermal decomposition of dry LiPF6 under dry argon gas flow: a) temperature protocol setpoints (black) and sample temperature (red); b) mass loss (black) and heat flow (orange); c) mass traces of H2O (purple), PF5 (blue), and POF3 (green).
Besides the mass fragments for PF5, we also observe a signal at m/z = 85 (green line in Figure 2c), which belongs to the POF2-moiety of POF3 (see Table I). Furthermore, a slight decrease of the m/z = 18 background can be seen. This suggests that part of the PF5 reacts with trace water in the instrumentation to form POF3 (see Equation 4), despite the initial drying step and the use of dry argon (5.0 purity), illustrating the high reactivity of PF5 with trace water:
![Equation ([4])](https://content.cld.iop.org/journals/1945-7111/165/13/A3022/revision1/d0004.gif)
Figure 3 shows the thermal decomposition of LiPF6 in the presence of water. To achieve a significant "wetting" of the LiPF6, water-saturated argon gas (dewpoint of ∼20°C) is flown over the sample before the temperature ramp is started (0–60 min in Figure 3). During this time, a mass increase of ∼24% is observed (black line in Figure 3b), consistent with the weight gain expected for the formation of an adduct with the nominal stoichiometry of LiPF6 · 2 H2O (note that in this experiment the background of the H2O signal (m/z = 18) was too high to observe any changes in the water concentration). It is to note that the sample weight still increases after the initial 60 min, which implies that a further uptake of water would have been possible if the wetting time was extended; however to stay in the same time scale as in the "dry" experiment shown in Figure 2, we limited the pre-wetting in Figure 3 to one hour. The subsequent ramp from room temperature to 350°C (10 K/min) correlates with a mass loss of only 49% referenced to the original LiPF6 mass, accompanied by a strong endothermic heat flow. This time, no m/z = 107 signal belonging to PF5 was observed (see blue line in Figure 3c); instead, only POF3 (m/z = 85) is detected (green line in Figure 3c). Both the mass loss and the POF3 evolution start around 90°C (see red dotted lines), i.e., 75°C lower compared to the experiment with dry argon gas flow in Figure 2, which is in good agreement with previous reports on the decomposition of intentionally wetted LiPF6.4,5 In contrast to these studies, however, the mass loss in our wet experiment (49%) is much lower than the theoretical mass loss based on a complete conversion to LiF according to Equation 2 (83%). This means that another thermally stable species besides LiF must be produced. It is possible that during the course of the TGA experiment, HPO2F2 is formed according to Equation 3, which then reacts with remaining LiF in the following equilibrium:40
![Equation ([5])](https://content.cld.iop.org/journals/1945-7111/165/13/A3022/revision1/d0005.gif)
With a melting point of 360°C,40 LiPO2F2 will not decompose but contribute to the remaining mass at the end of the TGA experiment; if the conversion of LiPF6 to LiPO2F2 were to be quantitative (the sum of Reactions 2, 3, and 5), the overall mass loss referenced to LiPF6 would be 29%. Thus, if we assume that LiF and LiPO2F2 are the only thermally stable products, the mass loss of 49% would correspond to a composition of 37% LiF and 63% LiPO2F2, based on the molar masses of M(LiF) = 25.9 g/mol and M(LiPO2F2) = 107.9 g/mol. However, a detailed chemical analysis of the sample residue would be necessary to verify this hypothesis.
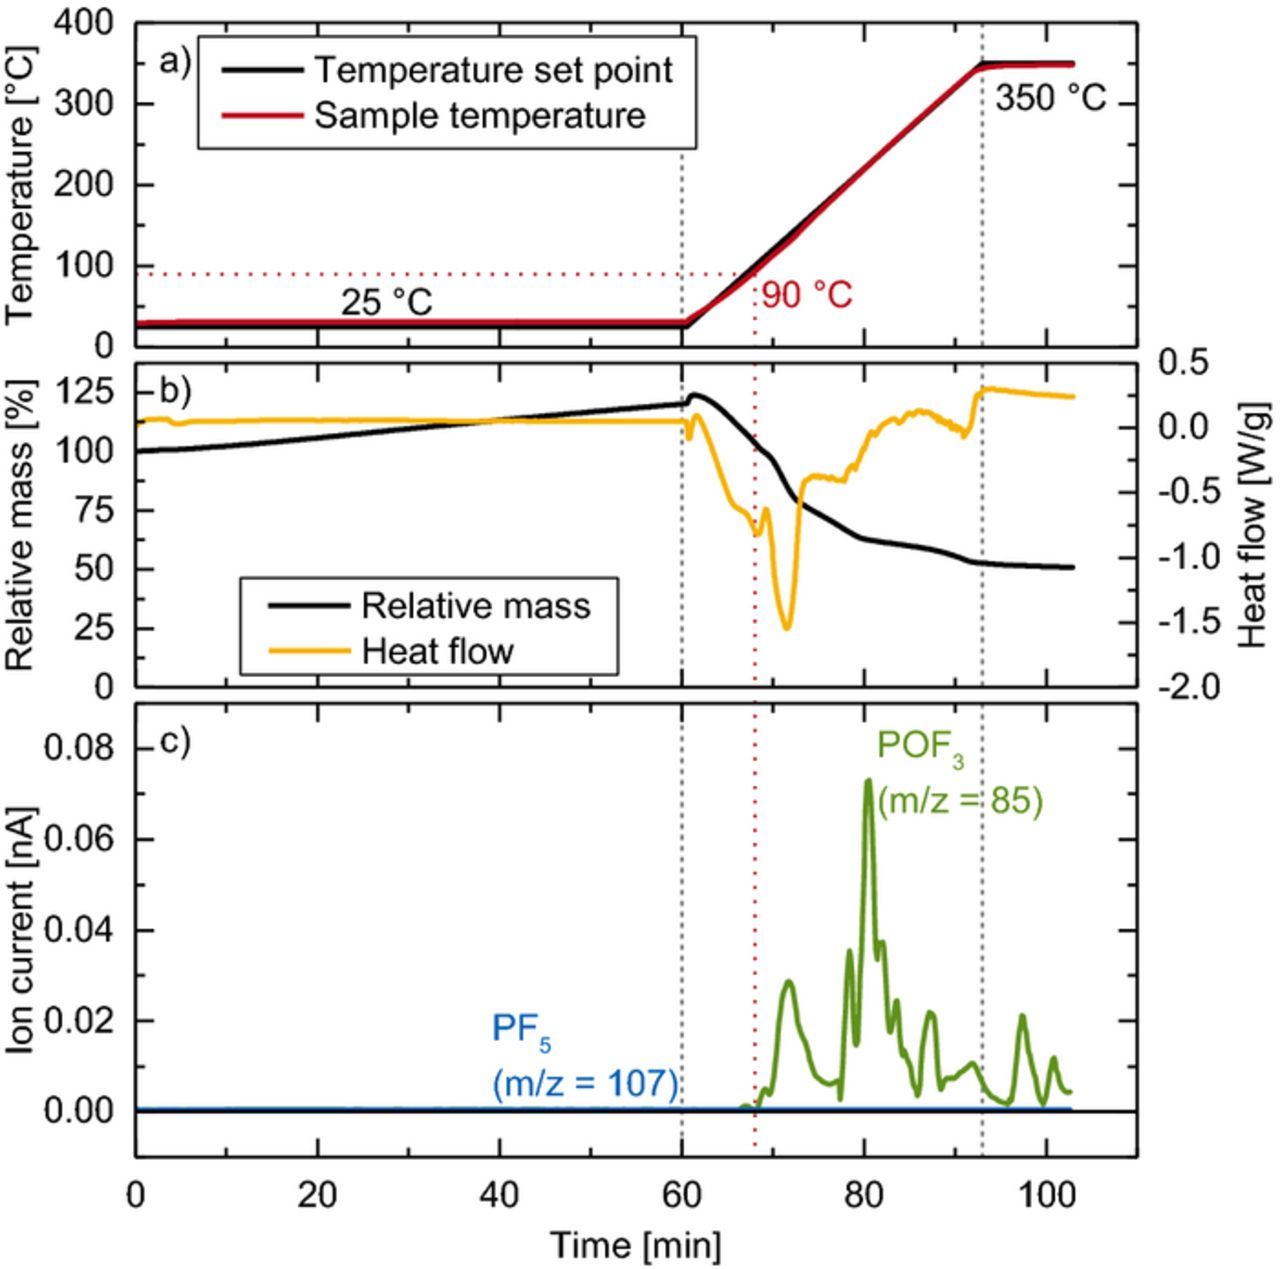
Figure 3. TGA-MS data on the thermal decomposition of dry LiPF6 under wet argon gas flow: a) temperature protocol setpoint (black) and sample temperature (red); b) mass loss (black) and heat flow (orange); c) mass traces of PF5 (blue) and POF3 (green).
Thermal decomposition of LiPF6 by OEMS
To obtain a quantitative relationship between the ion current measured in our OEMS system and the concentration of PF5 or POF3 in the cell headspace, we aimed to thermally decompose LiPF6 inside a cell connected to our OEMS system. Therefore, we assembled a modified OEMS cell which can be heated up to 250°C (see Experimental section and Figure 1 for details). Once the cell would be heated to 225°C, i.e., well above the decomposition temperature of dry LiPF6 at 165°C (see Figure 2), we expected LiPF6 to decompose stoichiometrically to PF5 according to Equation 1. As the expected partial pressure of PF5 is less than 20 mbar, a shift of the equilibrium to the left of Equation 1 can also be neglected. Figure 4 shows the cell temperature and the characteristic mass traces for PF5 (m/z = 107, blue line in Figure 4b) and POF3 (m/z = 85, green line in Figure 4b) during the decomposition of LiPF6 under regular dry conditions in our modified OEMS cell. Surprisingly, only mass traces belonging to POF3 were detected, although all cell pieces and the LiPF6 salt had been dried carefully and the cell assembly was done in an Ar-filled glove box. We repeated the experiment twice with different amounts of LiPF6 (see Figure 5), which however still did not lead to detectable amounts of PF5 on the mass channel m/z = 107. This clearly suggests that the reaction of PF5 produced in the cell with either trace water in the tubing of the high-vacuum side of the capillary or with the native oxide on stainless steel surfaces leads to a quantitative conversion to POF3.
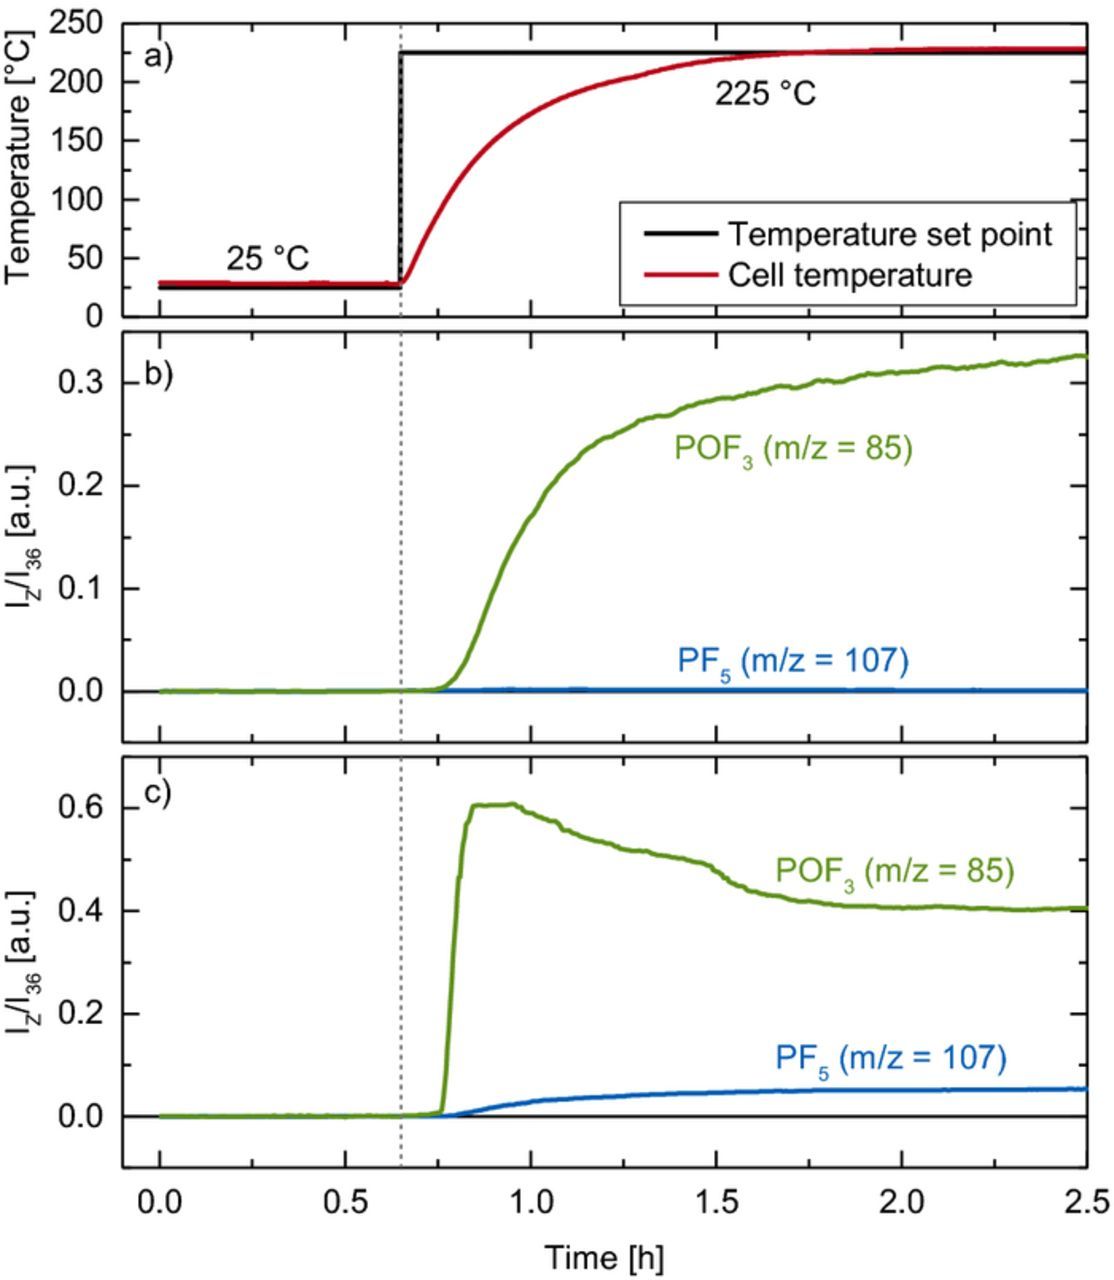
Figure 4. Thermal decomposition experiment with dry LiPF6 in the modified OEMS cell: a) temperature protocol (black) and cell temperature (red); b) mass traces for POF3 (green) and PF5 (blue) from 0.26 mg LiPF6without pre-drying of the OEMS inlet; c) mass traces for POF3 (green) and PF5 (blue) from 0.37 mg after heating of the OEMS inlet at 120°C under vacuum for 48 h before the start of the experiment.
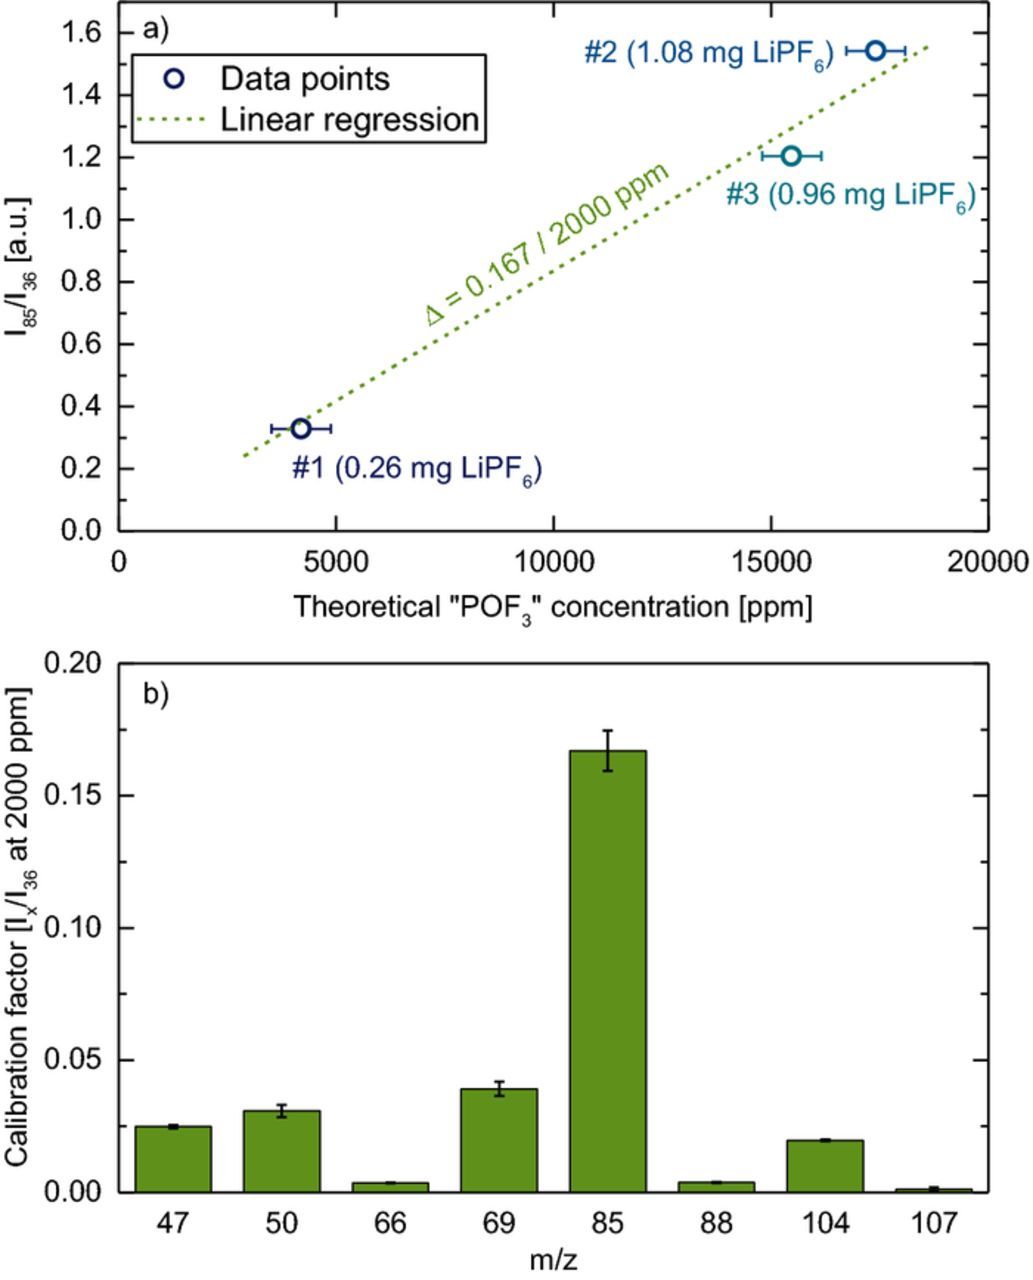
Figure 5. Quantification of the apparent amount of "POF3" (≡ sum of PF5 + POF3) from the thermal decomposition of different amounts of dry LiPF6 at 225°C in the modified OEMS cell. a) Ion current on m/z = 85 normalized to m/z = 36 vs. the theoretical concentration of "POF3"; error bars reflect the weighing accuracy of ± 0.04 mg. The calibration factor is determined by linear regression between the data points (see green dashed line). b) Calibration factor of "POF3" normalized to the 36Ar current and to 2000 ppm (≡Ix/I36 at 2000 ppm "POF3") for different m/z channels obtained from linear regression lines, whereby the error bars represent the standard deviation of the determined slopes. Experiments were conducted with 0.26, 0.96, and 1.08 mg dried LiPF6.
In order to remove any trace water within the tubing of the high-vacuum side of the OEMS setup, we conducted another experiment where the corrugated tube which connects the OEMS capillary with the mass spectrometer was heated to 120°C for 48 h under ultra-high vacuum (see yellow shaded area in Figure 1), while the modified OEMS cell was already attached with the capillary leak closed but kept near room temperature. This allowed to subsequently perform the LiPF6 decomposition experiment with the OEMS inlet perfectly dried prior to initiating the thermal decomposition of LiPF6 in the OEMS cell. The results of this experiment are depicted in Figure 4c. While in this experiment POF3 is still the by far dominant species (green line, m/z = 85), a small amount of PF5 (blue line, m/z = 107) could now be observed. As the partial pressure of PF5 in the tubes beyond the capillary is ∼108 times lower than in the OEMS cell (10−5 vs. 103 mbar),37 very low amounts of adsorbed water or oxides on the stainless steel tubing surface are obviously sufficient to convert most of the thermally formed PF5 to POF3 before it reaches the quadrupole. The apparent decrease of POF3 in the beginning of the experiment (1.0–1.5 h in Figure 4c) is thus most likely because PF5 emerging through the capillary reacts with initially present trace amounts of water in the OEMS inlet, leading to a relatively higher POF3 signal at m/z = 85; after depletion of trace water, increasing amounts of PF5 at m/z = 107 can be observed, concomitant with a simultaneously lower POF3 signal.
This experiment shows that even if PF5 were to form during conventional OEMS experiments in our setup, it will react with trace water (see Equation 4) and/or surface oxides on the stainless steel tubes within the OEMS inlet and thus will predominantly be detected as POF3. Consequently, at least in our OEMS setup, the above experiment shows that we are not able to differentiate between POF3 and PF5 in our measurements. For this reason, it is quite likely that at least part of the m/z = 85 signals which previously had been assigned to POF3 by our group31,32 may actually have been due to PF5. While we do not know whether this artefact might also be occurring with other on-line mass spectrometry systems used for the study of lithium ion batteries, the above experiments certainly suggest that it would be worthwhile to examine the extent of the PF5 to POF3 conversion for each system.
Although we cannot distinguish between PF5 and POF3 in our OEMS setup, we can still establish an at least semi-quantitative calibration factor for the apparent amount of "POF3", representing the sum of PF5 + POF3. This will be done by correlating the amount of thermally decomposed LiPF6 with the measured ion currents, evaluating the ion currents on all significant mass channels once they stayed constant, which was typically 3–4 h after the start of the heating experiment. We only considered the experiments where all PF5 was converted to POF3 (i.e., without heated tubing), as this would be the default case for all OEMS measurements conducted in our laboratory. Figure 5a depicts the ion current on m/z = 85 normalized to the 36Ar isotope (I85/I36, y-axis) vs. the theoretical concentration of "POF3" (referring to apparent POF3) from the thermal decomposition of LiPF6 (x-axis) for the three measurements with 0.26, 0.96, and 1.08 mg LiPF6 (± 0.04 mg, corresponding to 4200, 15500, and 17400 ppm "POF3"). Calibration factors were determined by the linear regression slope between the three data points shown in Figure 5a, which was then referenced to 2000 ppm "POF3". Figure 5b shows the thus determined calibration factors corresponding to 2000 ppm of "POF3" for the different POF3 mass channels after normalizing their ion currents to the ion current for 36Ar (Ix/I36) signals. It can be seen that the fragment on m/z = 85 (POF2) has the highest intensity, corresponding to a calibration factor of 0.167 ( ≡I85/I36 at 2000 ppm "POF3"), while the fragments with m/z = 47 (PO), m/z = 50 (PF), m/z = 69 (PF2), and m/z = 104 (POF3) all have much lower relative intensities. Note that this differs significantly from the fragmentation reported by the National Institute of Standards and Technology (NIST) for the same ionization energy of 70 eV (see Table I),39 which we ascribe to the fact that the ionization chamber in our instrument is heated at 120°C.37 Table II shows the calibration factors for H2, C2H4, CO, and CO2 (determined by purging the cell with a test gas containing 2000 ppm of each species), along with the newly determined calibration factor for "POF3", which lies within the same range (0.1–0.7) as the other calibration factors. Thus, when only POF3 related signals are observed in our OEMS setup, the sum of PF5 + POF3 can be quantified, even though their distribution cannot be determined.
Table II. Mass signal channels and calibration factors for the quantification of different gases for our OEMS system. The calibration factors are referenced to the 36Ar signal and normalized to 2000 ppm of the respective gas. Data for H2, C2H4, CO, and CO2 is taken from Ref. 41, whereas the calibration factor for "POF3" was determined in this work.
| Gas | Mass signal m/z | Calibration factor [Ix/I36 at 2000 ppm] |
|---|---|---|
| H2 | 2 | 0.15 |
| C2H4 | 26 | 0.38 |
| CO | 28 | 0.64 |
| CO2 | 44 | 0.58 |
| "POF3" | 85 | 0.17 |
Electrochemical oxidation of LiPF6 electrolyte
As already mentioned, POF3 has been observed at high positive potentials on cathode active materials or on carbon electrodes in LiPF6-containing electrolytes at room temperature, but its amount has never been quantified.29–32 Therefore, we examined the oxidation reactions of an EC + 1.5 M LiPF6 electrolyte on a carbon black working electrode vs. a lithium counter electrode, focusing on the evolution and quantification of LiPF6 decomposition species. Figure 6 shows the current density (a) and the gas evolution (b) during a linear potential sweep from OCV to 5.5 V vs. Li+/Li, whereby all signals have been quantified using the calibration factors given in Table II (note that only signals related to POF3 were observed, so that a quantification of "POF3" is possible). Around 4.2 V vs. Li+/Li, the evolution of "POF3" (i.e., POF3 + PF5, green line in Figure 6b) sets in, together with the formation of H2 (orange line in Figure 6b). Starting at 4.95 V vs. Li+/Li, a significant oxidation current (black line in Figure 6a) and the simultaneous evolution of CO2 (dark blue line in Figure 6b) are observed, as previously reported from the oxidation of EC-based electrolytes,35,42,43 along with an enhanced formation of H2 and "POF3". Density functional theory calculations by Borodin et al.24 and Li et al.25 have pointed out that upon EC oxidation (i.e., after the first electron transfer), the abstraction of a proton by a neighboring PF6− anion would occur in LiPF6-based electrolytes, leading to HF and PF5 formation, and ultimately to the release of CO2 and a vinyl alcoholate radical (see reaction pathway (1) in Scheme 1). The produced PF5 would then detected as "POF3" in our OEMS setup, while the reduction of HF at the Li metal counter electrode21 would result in the evolution of H2:
![Equation ([6])](https://content.cld.iop.org/journals/1945-7111/165/13/A3022/revision1/d0006.gif)
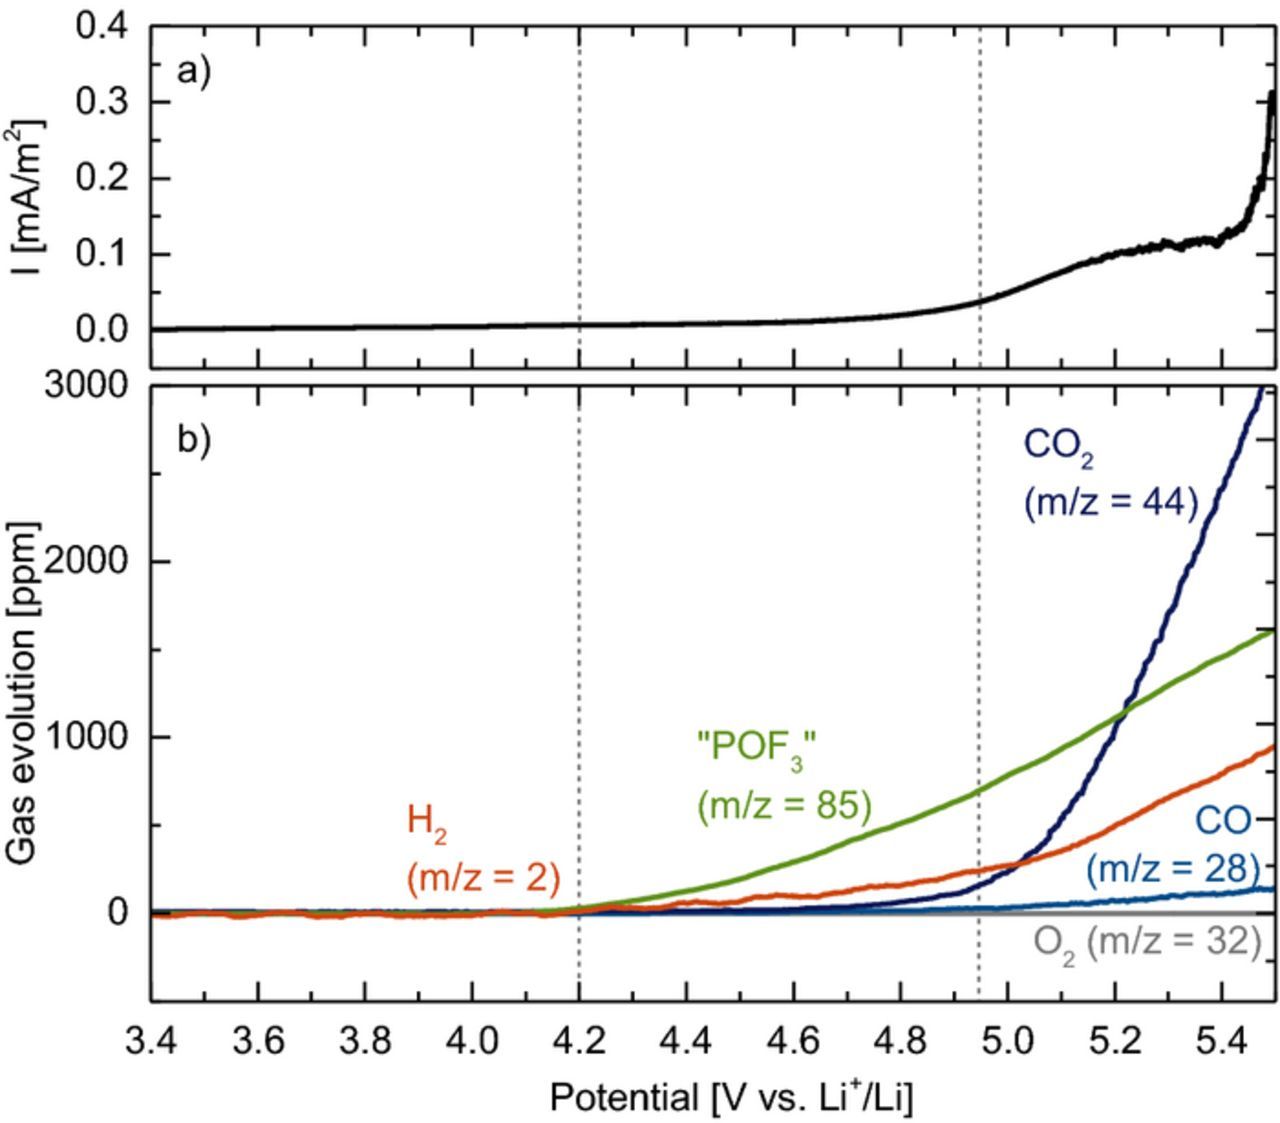
Figure 6. a) Current density and b) gas evolution during a linear oxidative potential scan of a carbon black electrode in EC + 1.5 M LiPF6 electrolyte. The vertical dashed lines at 4.2 V and 4.95 V mark the approximate onset for the oxidation of ethylene glycol and ethylene carbonate, respectively. The mass signals were converted into concentrations using the calibration factors given in Table II.
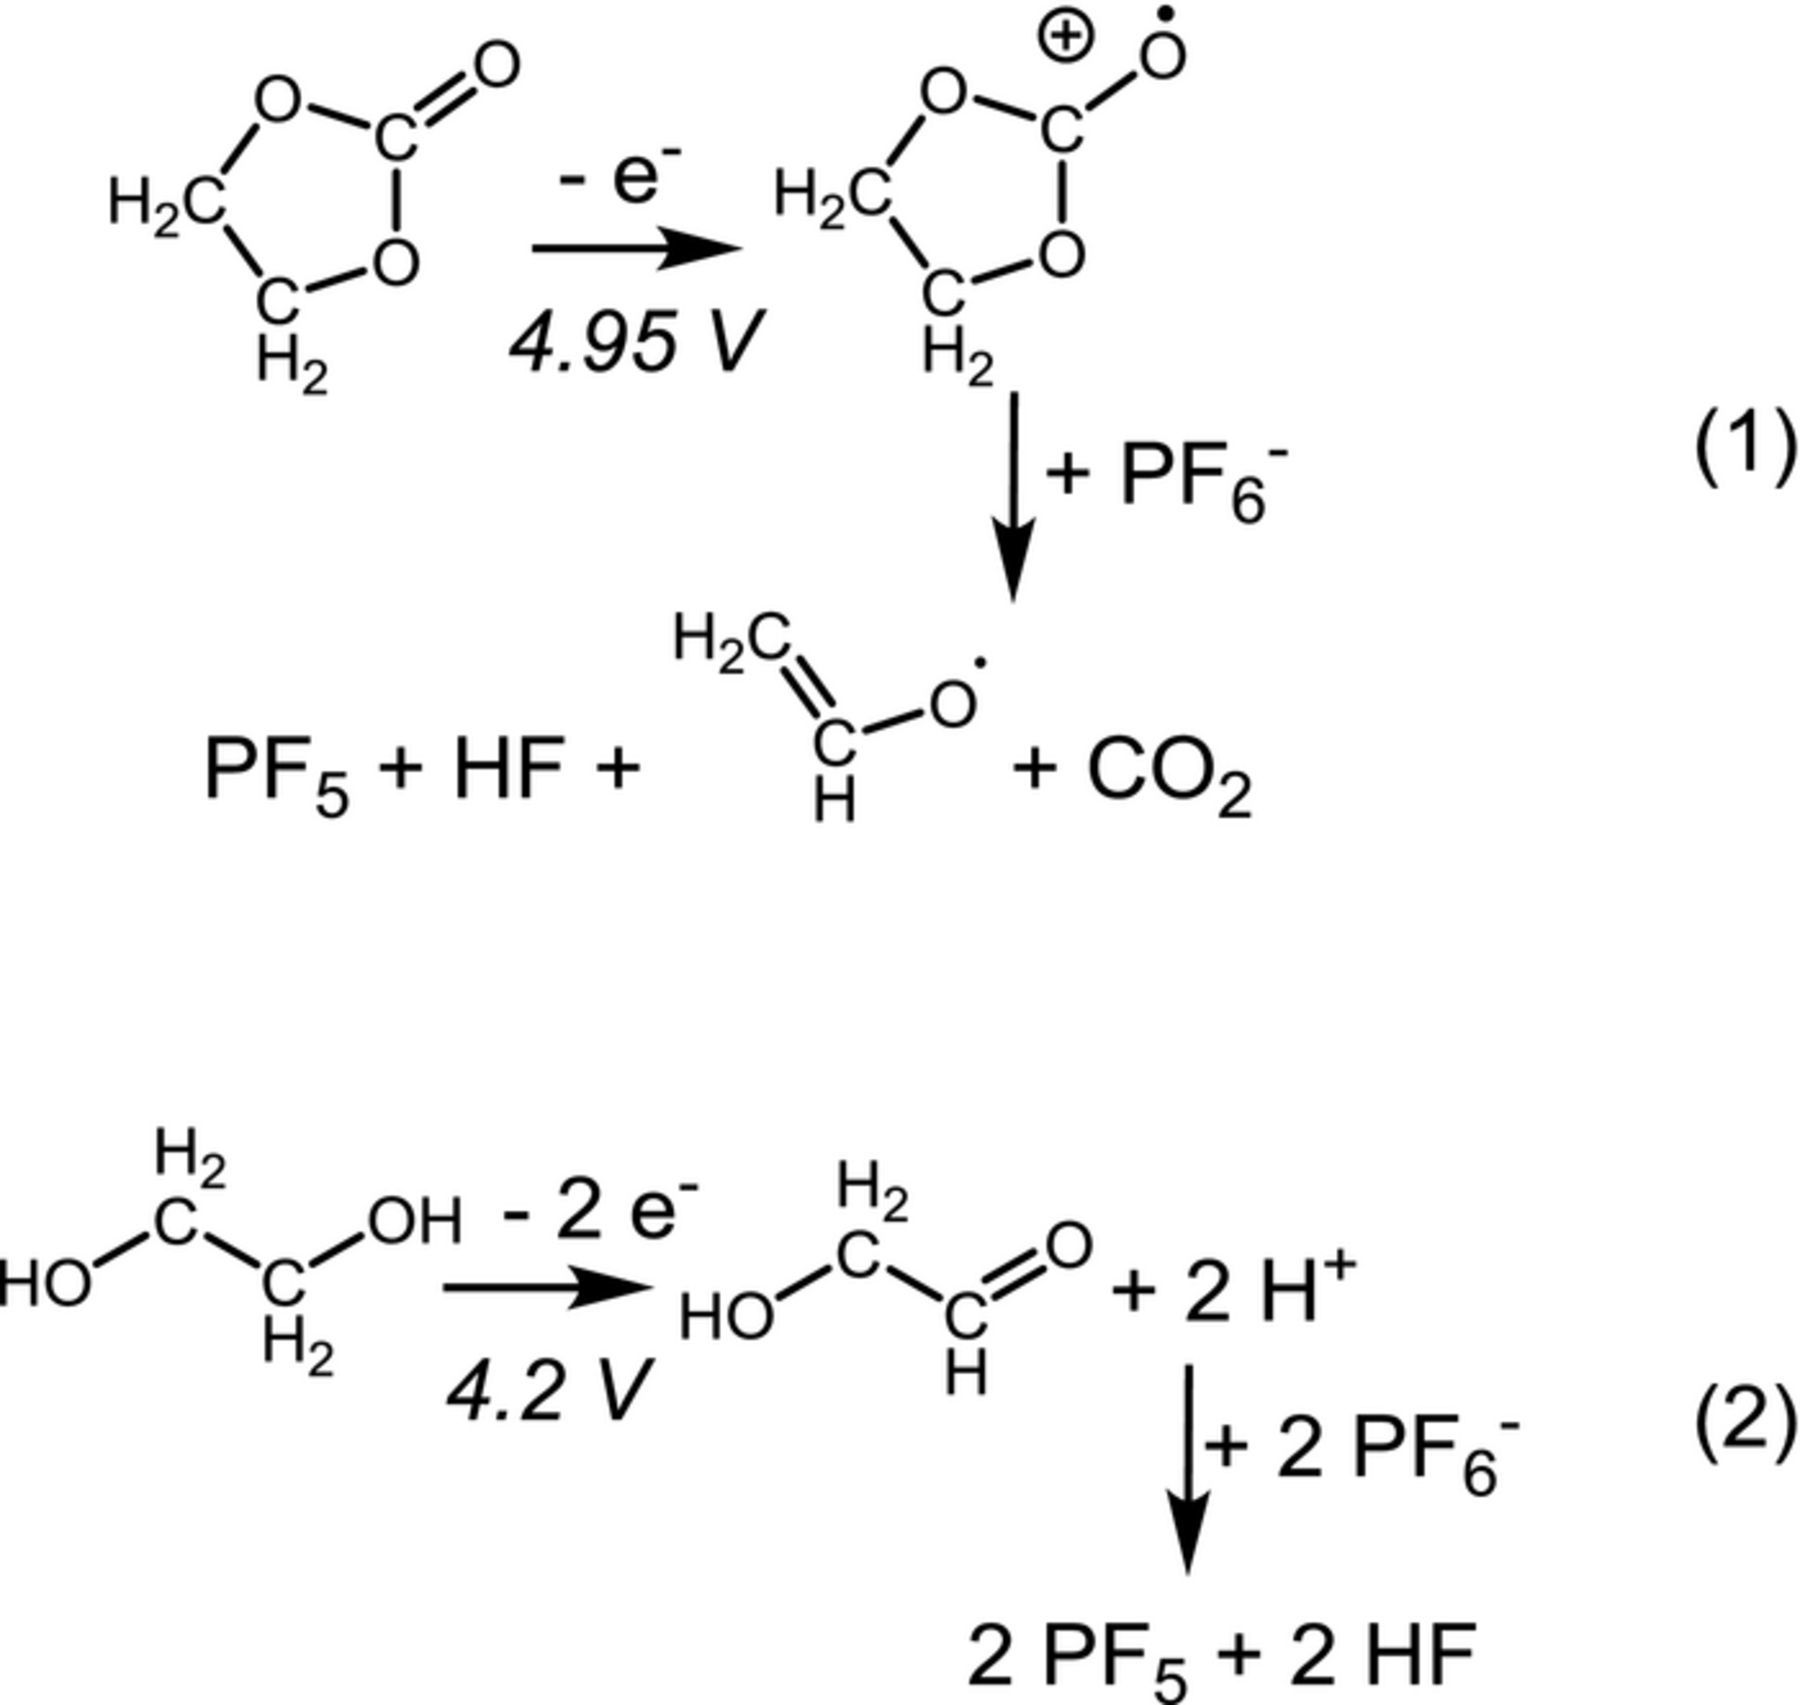
Scheme 1. (1) Oxidation mechanism of EC in the presence of PF6−, based on Refs. 25,48. (2) Oxidation of ethylene glycol according to Refs. 44,45.
However, contrary to this mechanisms, the evolution of H2 and "POF3" between 4.2–4.95 V occurs without the simultaneous formation of CO2, suggesting that a different process is taking place in this potential range. As trace amounts of water gradually react with EC to form ethylene glycol,22,38 the latter is a likely impurity in EC present at ppm levels (unfortunately below the NMR detection level). The oxidation of ethylene glycol in aqueous electrolytes leads to the formation of protons,44,45 which could also react with PF6− to HF and PF5 (see pathway (2) in Scheme 1). In fact, the amounts of H2 and "POF3" evolved up to 4.95 V would correspond to the oxidation of ∼20 ppm ethylene glycol, which is a probable concentration for this impurity.
For either mechanism (1) or (2) in Scheme 1, the predicted molar ratio of PF5/HF would be 1/1, so that the experimental molar ratio of "POF3" (representing PF5) and H2 should be 2/1 (since the reduction of 1 HF produces 0.5 H2; see reaction 6). This is in good agreement with the data in Figure 6, where the amount of H2 is indeed about 50% compared to that of "POF3". In summary, the data shown in Figure 6 lead us to the following hypothesis: a) protons or acidic species from EC or ethylene glycol impurity oxidation lead to a fast dissociation of PF6− to HF and PF5 already at room temperature, and b) POF3 observed at oxidative potentials in OEMS experiments on a carbon black electrode is in fact mainly PF5 rather than POF3 as we had assumed previously.32
To verify whether the formation of acidic species (e.g., HF or H+) can lead to a significant dissociation of LiPF6 at room temperature within the timescale of an OEMS experiment, we investigated the reaction of an EC + 1.5 M LiPF6 electrolyte with 5000 ppm methanesulfonic acid (MSA, pKA = 8.3 in propylene carbonate).46 With this electrolyte, we performed a similar experiment as described by Metzger et al.,38 namely monitoring the gas evolution while gradually increasing the temperature of the electrolyte from 10°C to 80°C. Note that for this type of experimental procedure no active electrodes or lithium are present, so that it only probes purely chemical reactions of the electrolyte. The cell temperature and the resulting gas evolution are shown in Figures 7a and 7b. A significant amount of "POF3" (POF3 + PF5, green line in Figure 7b) is already formed at 25°C, leveling off at ∼1000 ppm. Going to higher temperatures, the overall "POF3" concentration increases further (from ∼3000 ppm at 40°C to ∼11000 ppm at 80°C); however, in contrast to the constant steady-state concentration reached at 25°C, at higher temperatures the "POF3" evolution reaches a maximum within ∼1 hour at the respective temperature step and thereafter decreases gradually (a more detailed discussion follows below). CO2 (navy line in Figure 7b) is only evolved above 60°C, but remains at a much lower concentration compared to "POF3"; at 80°C, the amount of CO2 increases continuously.
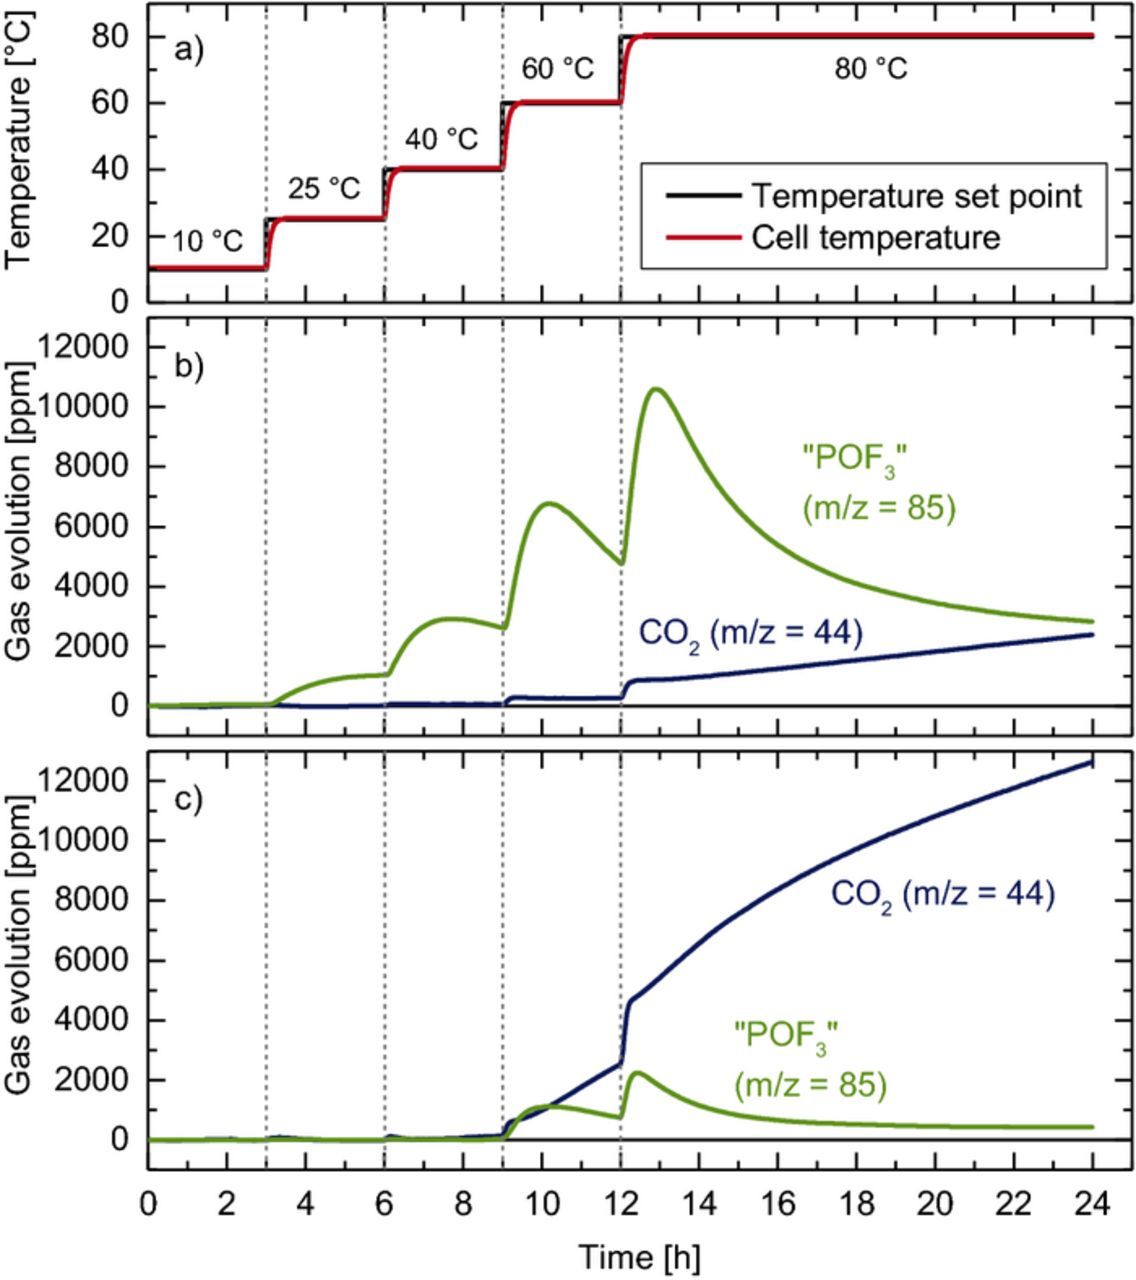
Figure 7. Temperature induced decomposition of EC + 1.5 M LiPF6 electrolyte, measured in an OEMS cell by stepping the temperature from 10 to 80°C: a) temperature protocol (black) and cell temperature (red); b) "POF3" and CO2 evolution in the presence of 5000 ppm methanesulfonic acid; c) "POF3" and CO2 evolution in the presence of 5000 ppm water. The mass signals were converted into concentrations using the calibration factors given in Table II.
Clearly, the detection of "POF3" at 25°C in the MSA-containing electrolyte demonstrates that protons can rapidly and substantially shift the dissociation of PF6− toward PF5 and HF (see Equation 7). This is in good agreement with Freire et al.,47 who found that PF6-based ionic liquids hydrolyze in aqueous solutions with pH = 3 at room temperature, but not under neutral conditions.
![Equation ([7])](https://content.cld.iop.org/journals/1945-7111/165/13/A3022/revision1/d0007.gif)
At 25°C, the establishment of a steady-state "POF3" concentration and the absence of CO2 indicate that at this low temperature no PF5 is consumed in a reaction with the electrolyte or that this reaction is too slow to be detected within the timescale of the OEMS experiment (∼3 h). In contrast, the decreasing concentrations of "POF3" during the second half of the temperature step at >40°C are likely a result of PF5 reacting with the electrolyte to oligomers8 or alkyl fluorophosphates.2,7,9–11 As the rate of chemical PF5 consumption will depend on both temperature and the concentration of PF5 dissolved in the electrolyte (which is by Henry's law proportional to the amount of PF5 in the headspace of the cell), a faster consumption of POF3 is expected at 60°C and 80°C, where both temperature and overall "POF3" concentration are higher. Additionally, a stepwise increase of the temperature can cause the desorption of PF5 or POF3 from the inner surface of the steel tubing, which leads to a peak in the detected "POF3" concentration at the initial phase of each temperature step.
Interestingly, the extent of CO2 formation in Figure 7b is very similar to that observed with an EC/LiClO4 electrolyte with < 20 ppm water reported by Metzger at el.38 (see Figure 1 in Ref. 36), which means that the direct reaction of PF5 with EC does not generate additional CO2. For comparison, Figure 7c shows the same experiment with 5000 ppm of added water instead of MSA. Up to 40°C, neither "POF3" (green line in Figure 7c) nor CO2 (navy line in Figure 7c) are observed. Only at temperatures 60°C and above, low amounts (< 2000 ppm) of "POF3" are detected, in this case likely due to the formation of POF3 rather than PF5 (this, however, cannot be discerned in our OEMS experiments). At the same time, the CO2 concentration increases linearly at 60°C and 80°C to above 12000 ppm, in agreement with previous experiments on the water-driven hydrolysis of EC in LiClO4-based electrolytes.38
Comparing the results of Figures 7b and 7c, it becomes apparent that only highly acidic species can trigger the formation of PF5 at room temperature. Accordingly, the oxidation of an EC/LiPF6 electrolyte (see Figure 6) must be leading to the formation of species which act as proton donors or Brønsted acids, which is consistent with the mechanism proposed by Borodin et al.24 and Li et al.25 (see Scheme 1). Furthermore, the release of PF5 might explain the strong temperature dependence of the oxidative stability of LiPF6-based electrolytes.33 In this context, the use of proton-scavenging additives, i.e., bases,9,18 could be a successful strategy to prevent the dissociation of PF6− at high potentials, thereby suppressing HF formation and electrolyte degradation.
Conclusions
In this work, we have investigated the thermal and oxidative decomposition reactions of LiPF6 in Li-ion battery electrolytes. The decomposition onsets of dry and wet LiPF6 were determined by TGA-MS to be 165°C and 90°C, respectively. While dry LiPF6 is known to decompose to PF5 and HF, some POF3 was observed by TGA-MS due to trace water impurities in the dry argon carrier gas. On the other hand, the thermal decomposition of wet LiPF6 in water-saturated argon carrier gas resulted in the formation of POF3, HF, and LiPO2F2.
Analyzing the thermal decomposition of dry LiPF6 in the on-line electrochemical mass spectrometry (OEMS) system developed by our group, we found that all of the thermally released PF5 is actually detected as POF3 (m/z = 85) under standard experimental conditions, so that it is not possible to distinguish between PF5 and POF3 in OEMS experiments. As this might also apply to other on-line mass spectrometry systems developed for the study of lithium ion batteries, the calibration of these systems for their ability to distinguish between these two gases is advisable. This information is crucial for mechanistic studies, as otherwise experimental on-line mass spectrometry data may be mis-interpreted. However, by decomposing specific amounts of LiPF6, we could establish a calibration factor for the sum of POF3 + PF5 (referred to as "POF3"), allowing us to quantify the amount of the sum of both gases in our OEMS experiments.
Subsequently, we investigated the oxidation of an EC/LiPF6 electrolyte on a carbon black electrode. Next to CO2, we observed "POF3" and H2 in a ratio of 2:1, suggesting that PF6− is decomposed by protic species formed during electrolyte oxidation to PF5 and HF, whereby the latter is reduced to H2 on the lithium counter electrode. OEMS studies on the thermal stability of EC/LiPF6 electrolytes with intentionally added protons (in the form of methanesulfonic acid) or water showed that protons can indeed trigger the formation of PF5 at room temperature, whereas the reaction of LiPF6 with water is too slow at 25°C to be sensed by OEMS. Hence, we confirmed that the oxidation products of battery electrolytes act as Brønsted acids and trigger the decomposition of PF6− to PF5 and HF already at room temperature.
Acknowledgments
The authors gratefully acknowledge the BASF Battery Research Network for financial support. We also thank Anna Freiberg for fruitful discussions and advice.
ORCID
Sophie Solchenbach 0000-0001-6517-8094
Michael Metzger 0000-0002-5512-8541