Abstract
This work presents an approach to tailor the properties of the graphene oxide- silver nanoparticle (GO-AgNPs) composite using room temperature atmospheric plasma treatment. In particular, the aerosolized deposition of graphene oxide-silver nanoparticle composite (GO-AgNPs), the rapid reduction of GO at room temperature, and AgNPs surface excitation are investigated in this work. The plasma treatment of aerosolized GO leads to the reduced graphene oxide (rGO) formation which is observed from the increase in D to G band ratio from 0.65 for GO to 1.2 for rGO in the Raman spectra. Scanning Electron Microscopy, Transmission Electron Microscopy, and Selected Area Electron Diffraction patterns show that the plasma treatment leads to the morphological changes and the Electrochemical Impedance spectroscopy results show the improvement in the conductivity of the rGO-AgNP composite. To demonstrate the efficacy of the technique, plasma treated GO and silver nanoparticles (AgNPs) composite is used for the electrode surface modification of the commercial screen-printed electrodes for the cortisol detection. The cyclic voltammetry scans to detect cortisol shows that the sensitivity of the surface modified electrodes is increased after plasma treatment. This room temperature atmospheric plasma annealing technique is of specific interest for rapid processing of nanoparticles on flexible surfaces without subjecting them to elevated temperatures.
Export citation and abstract BibTeX RIS

This is an open access article distributed under the terms of the Creative Commons Attribution Non-Commercial No Derivatives 4.0 License (CC BY-NC-ND, http://creativecommons.org/licenses/by-nc-nd/4.0/), which permits non-commercial reuse, distribution, and reproduction in any medium, provided the original work is not changed in any way and is properly cited. For permission for commercial reuse, please email: oa@electrochem.org.
The graphene-based technologies have attracted significant interest, due to the better electrical, mechanical, thermal properties of graphene leading to better performance.1 Graphene oxide (GO) is one of the easily available derivatives of graphene which is used in its reduced form to enhance the electrical, and electrochemical responses. The reduction of GO is achieved by the exfoliation method wherein the oxygenated groups from the GO surface are removed to enhance the electron transfer properties. The defects present in the rGO makes the electrolyte penetration easier than that of pure graphene.2 There are several methods used to perform the GO reduction such as, thermal reduction,3 chemical reduction,4 electrochemical reduction5 and plasma reduction.6 However, these methods involve the complex experimental assembly and require the use of additional chemicals such as paraffin oil, CH4 gas insertion, chloroauric acid which are responsible for the reduction reaction. The chemical reduction methods involve the use of carcinogenic agents such as hydrazine.7 Moreover, the strong acids used in the reduction methods require to neutralize the pH according to the desired applications. The above techniques are multistep reduction techniques and are time consuming. The plasma assisted GO reduction technique adapted in this work consists of simple assembly with no additional reacting agent involved in the reduction process.
Plasmonic nanoparticles, like silver nanoparticles (AgNPs), are responsible for the electromagnetic enhancement in the biosensing due to the charge transfer between molecules and the surface.8 The AgNPs have low sintering temperature and high stability, which make their application area wider in bio-sensing devices, conductive ink, in textile and many more.9,10 Due to the rich electronic and catalytic properties, AgNPs have been used to detect biomolecules through electrochemical signals.11 Although direct detection of biomarkers using conventional electrochemical reactions is possible, various methods have been successfully adapted where nanocomposites boost the sensitivity of biosensors. The reduced graphene oxide modified electrodes comprise of the desired defects on the surface to encapture the nanoparticles which provide the active binding sites for biosensing.12,13 The Argon plasma generated in the presented work has the active hydrogen and argon radicals which are responsible for the GO reduction. The physical plasma bombardment accounts for the broken sp3 bonds in the GO structure to increase the defects. In this work, the enhancement in the sensitivity of the biosensor due to plasma assisted electrode surface modification is demonstrated by detecting the cortisol molecules. Cortisol is a vital stress hormone and its level in many physiological functions such as fat mobilization for metabolism, immune suppression, several health conditions, including cardiovascular disease, autoimmune disorders, infectious diseases, and mental illness makes it an important biomarker in health-monitoring.14
The enhanced electrical performance of plasma treated rGO-AgNPs modified electrodes as against untreated GO-AgNPs is studied and the results are correlated to the well dispersed AgNPs embedded on the rGO defect sites. Comprehensive electrochemical and optical characterization is used to compare the properties of rGO with GO in terms of structure, defect content and morphologies by SEM and TEM imaging. Further, the effect of plasma treatment on the encaptured AgNPs in GO matrix is investigated by observing the change in morphological and electrical properties. The plasma assisted alteration in crystallinity of AgNPs embedded into the rGO layers is examined through SAED patterns. The aerosolized GO and AgNPs deposition and plasma reduction technique is derived from the previous work of Dey et al.,15 and can be used in the applications where flexible substrates are desired. The technique used in this work is capable of rapid reduction of GO at room temperature, atmospheric pressure and with the simple experimental setup.
Materials and Methods
Experimental set up
Figure 1 shows the two experimental setups used for Graphene Oxide (GO) and Silver Nanoparticle (AgNPs) deposition (Figure 1a) and plasma treatment (Figures 1b and 1c). For the GO/AgNPs deposition, an ultrasonic nebulizer was used to create an aerosol of GO/AgNPs solution and was then ensembled with the quartz tube to provide a desired path to the aerosol. The ultrasonic nebulizer has one inlet for Argon (Ar) gas and one outlet to connect it to the quartz tube with an outer diameter of 6mm and the inner diameter of 3mm. The glass capillary with a 1mm inner diameter was inserted into the quartz tube. The other inlet of the Ar gas was connected to the midway point of the quartz tube and was controlled by the Mass Flow Controller (MFC). The moisture blocker was placed before the MFC outlet in the quartz tube in order to absorb the excess moisture created from the aerosol in the path before the deposition. For the plasma treatment, the high voltage supply (variable output 1–20kV, variable frequency 20–60kHz, 20–30mA) was connected to two copper rings on the quartz tube to generate plasma. The MFC controlled Ar gas flow was supplied to the quartz tube to form stable Ar cold plasma.
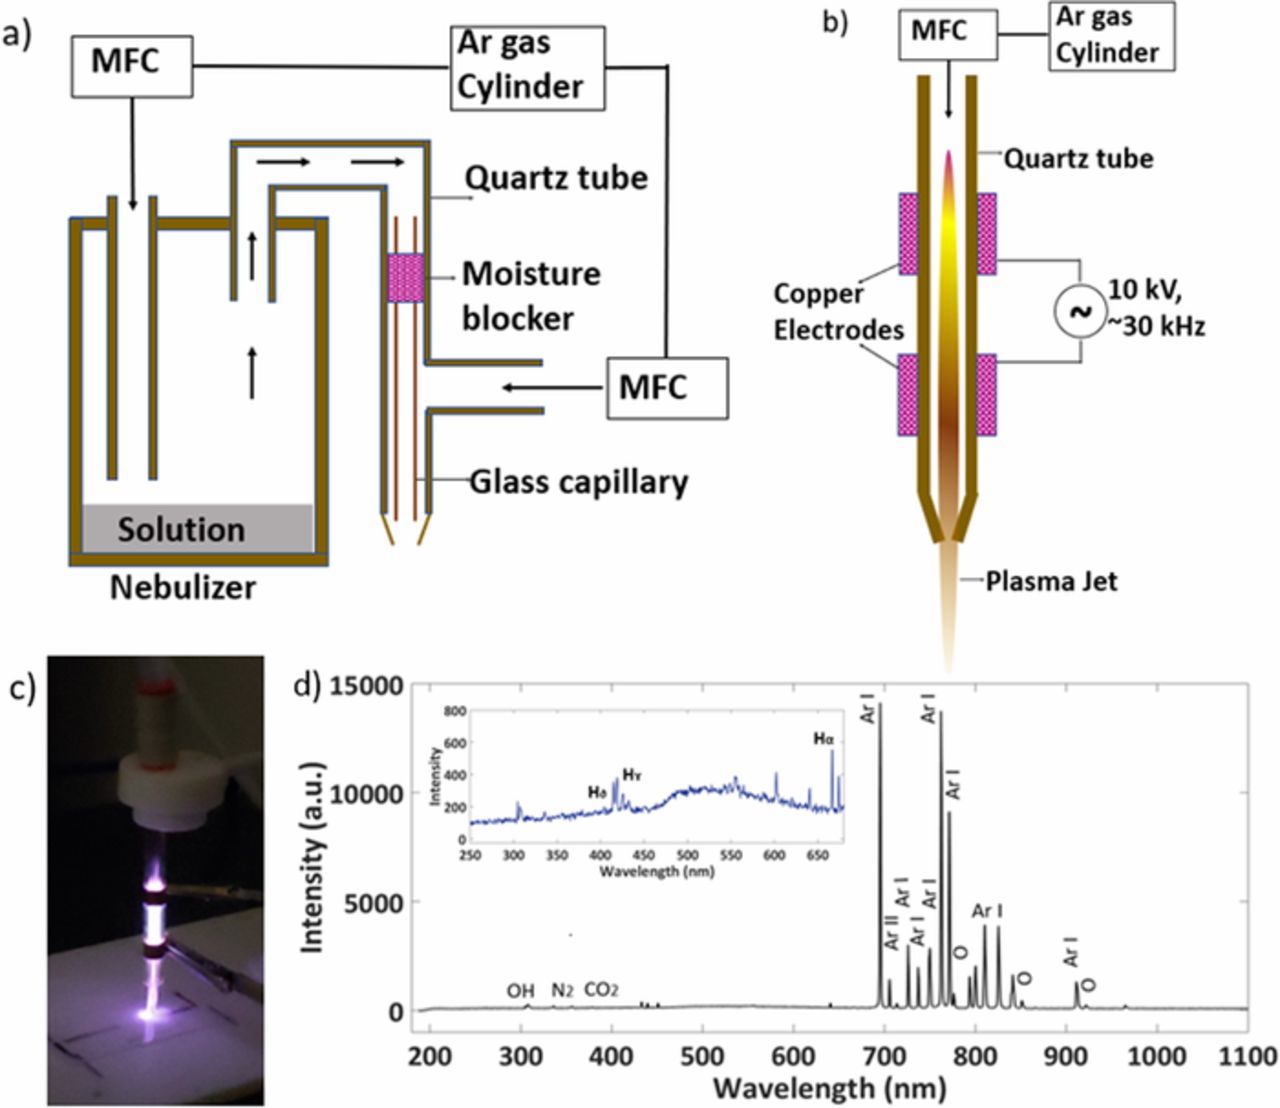
Figure 1. Schematic of experimental setup for a) GO and AgNPs deposition and b) cold atmospheric plasma; c) image and d) OES characterization of cold plasma system.
GO and AgNPs deposition
The GO sheets (1mg/ml) dispersion in water and AgNPs of an average size of 10nm were purchased from Sigma-Aldrich. A 0.02mg/ml solution of GO and AgNPs was prepared in deionized water. The AgNPs purchased were bi Polyethylenimine (BPEI) functionalized to make the stable dispensed Ag NPs solution. The solution was poured into the nebulizer to create aerosol consisting of GO/AgNPs. The aerosol generated was carried upwards by an Ar gas stream of ∼15 SCCM, which was supplied to the inlet of the nebulizer and obtained by the path through the quartz tube and the capillary inside. The Ar gas supplied to the midway of the quartz tube confined the flow of the material coming to get the film deposition as required. The concentrated GO was carried through the capillary and were deposited on the quartz slides for SPR detection, on silicon for SEM imaging and SERS characterization; and on copper grids for TEM imaging. The AgNPs were deposited on the untreated and treated GO using the same set up for SEM imaging and cortisol electrochemical detection.
Plasma treatment
The external high voltage electric field of 10kV was supplied to the copper electrodes surrounded by the quartz tube. The Ar gas flow was maintained at 2 l/min through the attached gas flowmeter to create a plasma. The plasma set up and downstream is shown in Figures 1b and 1c. The quartz tube was used to maintain the dielectric and the electrodes were placed 1 cm apart, based on the calculated Debye length for the cold plasma, 75 μm.16 The high voltage supply was turned on and the impedance was adjusted such that the voltage supplied, and the variable frequency reached the point where the plasma became stable. The voltage supply and gas flow were turned off after the treatment.
Plasma characterization
The Optical Emission Spectra (OES) was recorded for the Ar atmosphere in room temperature plasma, as shown in Figure 1d. The Optical Emission Spectrometer from Ocean Optics HR2000+ES was used to obtain the intensity counts for the downstream plasma, as shown in Figure 2d.17,18 The intensities for the Ar transitions were also identified.18–20 Using the ratio method and Saha Boltzmann method, the electron temperature and electron density of the downstream plasma were calculated as Te = 1.08eV and ne = 1.90 × 1011 cm−3 respectively.21,22
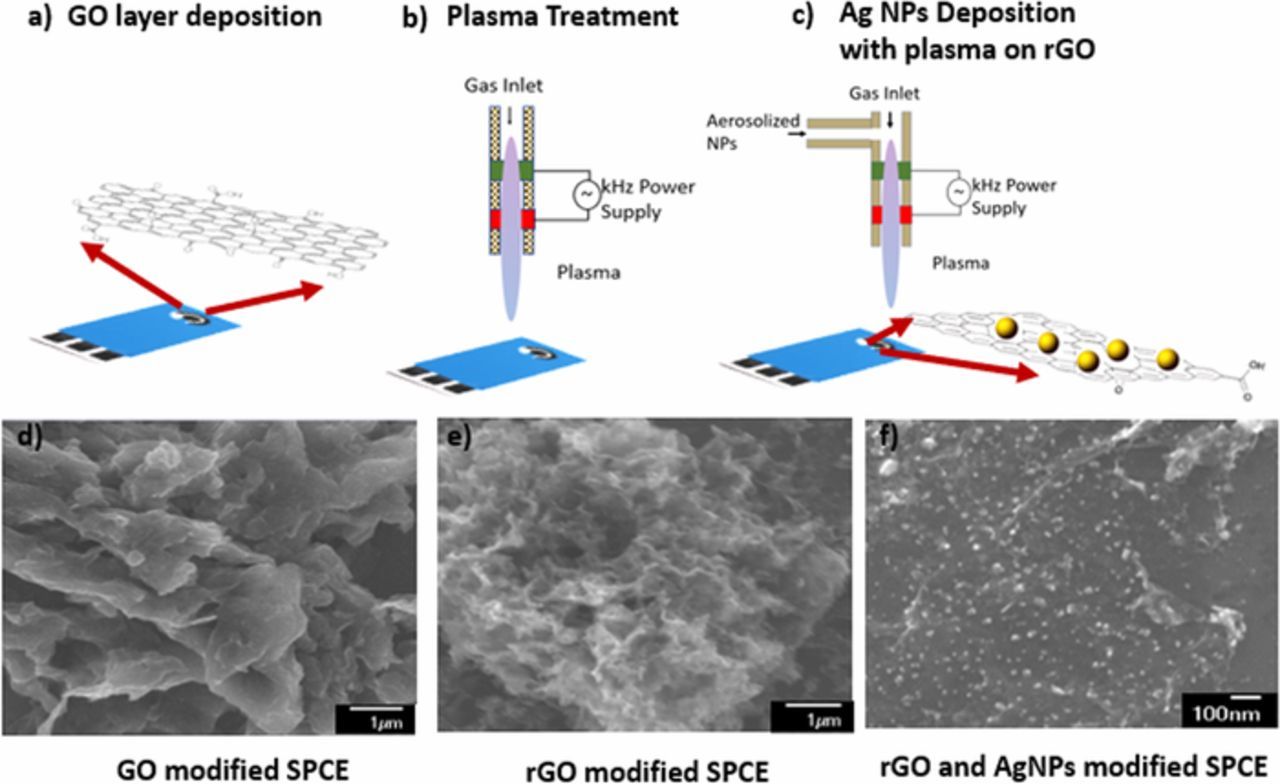
Figure 2. Schematic illustration of rGO sensor fabrication process a) GO deposition, b) Plasma treatment, and c) Ag NPs deposition on rGO layer and SEM images of morphological changes during each step of the sensor fabrication for cortisol detection [d), e) and f)].
Fabrication of rGO sensors for cortisol measurement
The Zensor Screen-Printed Carbon electrodes (SPCE) from eDAQ were used to deposit GO layers using the experimental setup described in Experimental set up section. This deposition was confined to the working electrode surface of SPCE as shown in Figure 2. Two types of electrodes were fabricated. i) (untreated GO-AgNPs): The 5μl of GO solution was drop-casted on the working electrode surface of SPCE and left them to dry completely. 5μl AgNPs were deposited on the GO modified SPCE and left to dry.
ii) (rGO-AgNPs): The GO was deposited on SPCE and then treated with plasma for 3 mins by placing the electrode below the plasma assembly as shown in Figure 2b. The GO was reduced by plasma treatment. The AgNPs were deposited on this reduced graphene oxide (rGO) modified SPCE using the material deposition assembly described in Experimental set up section. and dispersion of AgNPs was achieved by keeping the plasma ON while AgNPs deposition.
The morphology of as prepared samples is shown in Figures 2d, 2e, and 2f. Untreated GO exhibited two-dimensional planar, packed layer structure and aggregated sheets closely associated to form a continuous structure, whereas the plasma modified GO possessed the wrinkled, folded structure. The comparatively continuous, soft morphology of GO layers was possibly due to the presence of hydroxyl or carboxyl groups.23 The observed change in surface roughness attributed to the rGO due to the plasma bombardment.24 The distribution of AgNPs on the wrinkled GO layer can be observed from Figure 2f. The observed modification due to the plasma treatment encouraged to use the plasma modified rGO-AgNPs for the electrochemical detection of biomolecules.
Electrochemical measurements
The electrochemical measurement was conducted using a CHI 1230 analyzer using surface modified Zensor SPCEs to compare the electrochemical response of GO and rGO working electrodes. 5mM Ferro/Ferricyanide K3[Fe (CN)6])/ K4[Fe (CN)6] (1:1, 5 mM) was prepared in a Phosphate buffer solution (pH-7.2) (PBS). The cyclic voltammograms (CV) were obtained from a 5μl of K3[Fe (CN)6])/ K4[Fe (CN)6] at 50mV/sec scan rate. The standard cortisol solutions of 0.012 ug/dl, 0.037 μg/dl, 0.111μg/dl, 0.333 μg/dl and 1 μg/dl were prepared with Hydrocortisone-H0888 (cortisol) that was purchased from Sigma Aldrich and were used to take the electrochemical response of rGO and AgNPs modified SPCEs. The CVs were recorded after adding 5ul of the different concentrations between −1 V to +1 V potential swing to detect the corresponding oxidation and reduction current values using CHI 1230. The stability of the rGO-AgNPs modified electrodes was studied by potential cycling of PBS solution scanned at 50 mV/sec. The Electrochemical Impedance Spectroscopy was carried out for GO, rGO, GO-AgNPs and rGO-AgNPs modified electrodes using Metrohm Autolab analyzer in 5mM [Fe (CN)6]3−/4− containing 0.1M KCl solutions.
Surface enhanced raman spectroscopy
GO layers were deposited on silicon substrates to record the SERS. The different samples were then treated with plasma for 2 min, 5 mins and 7 mins to capture the SERS response using a LabRAM HR spectrometer. The spectral position was calibrated at a 520.5 cm−1 peak of Si/SiO2.
The Gaussian-Lorentzian peak detection was used after subtracting the noise from the signal in 15 acquisitions.
Surface plasmon resonance
Samples for SPR were prepared by depositing GO on quartz slides followed by the plasma treatment for 5 minutes. SPR signals were recorded for the prepared samples using an Evolution 300 UV-Vis spectrometer from Thermo Fisher.
Scanning Electron Microscope (SEM)/ Transmission Electron Microscope (TEM) Imaging
The untreated and plasma treated GO modified SPCEs were examined using JOEL SEM 7000 a Scanning Electrode Microscope (SEM) operating at 10kV emission voltage and 9μA probe current. The AgNPs deposition on plasma treated GO was also imaged by SEM. The AgNPs were deposited on untreated GO and then plasma treated GO samples and AgNPs on plasma treated GO were further treated with and TEM images were captured to compare the morphological changes and NP distribution on GO layers. The TEM images of deposited AgNPs were captured using PHILIPS CM200 TEM at 200kV excitation voltage and the diffraction pattern was obtained for untreated and plasma treated AgNPs films.
Results and Discussion
Plasma assisted graphene oxide reduction
Surface enhanced raman spectroscopy
The SERS response of untreated, 2 mins, 5 mins and 7 mins plasma treated GO on silicon substrates were obtained as shown in Figure 3a. The Raman spectra of GO typically consists of two peaks, D band and G band. The G band originates from the sp3 vibrations of photons and the D band corresponds to the sp2 rings. Generally, out of plane vibrations, sp2 requires a defect for its activation. The aerosolized untreated GO sample shows (Figure 3a) G peak at 1602 cm−1 and D peak at 1318 cm−1. The ratio between the D and G band is a measure of the defect levels of the graphene. The ratio obtained for the untreated GO sample was 0.655 and which increased to 0.997, 1.068 and 1.243 for 2 mins, 5 mins and 7 mins plasma treated samples respectively. This consistent increase in the ID/IG ratio can be correlated with Stankovich et al.,25 where the increase in the ratio is an indication of the reduced GO. The increase in the ratio with the corresponding cold plasma treatment duration is shown in Figure 3b. In the Raman spectrum of GO, the prominent D band indicates the reduction in size of the in-plane sp2 domains because of the extensive oxidation. The increase in ID/IG ratio in Raman spectrum of the reduced GO compared to that in GO suggests a decrease in the average size of the sp2 domains due to the reduction of GO. The increase in the peak intensity in the rGO occurs due to the restoring of sp2 domains after the reduction.26,27
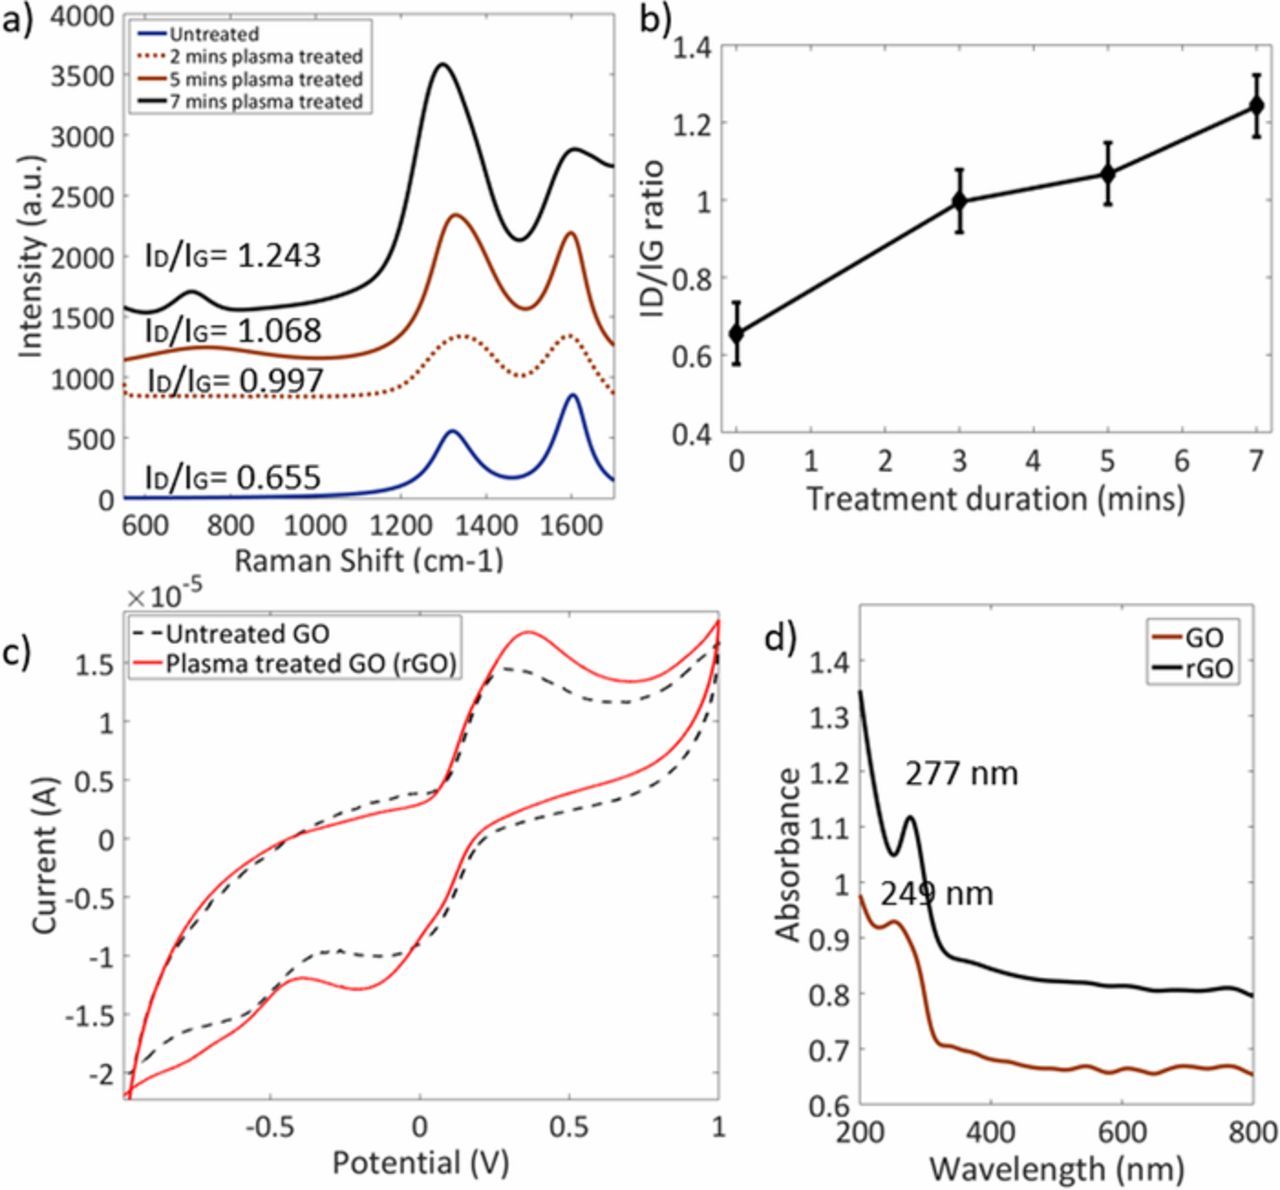
Figure 3. a) Raman Shift, b) ID/IG ratio, c) Electrochemical response (5mM [Fe (CN)6]3−/4− on untreated and plasma treated GO) and d) SPR obtained for untreated (GO) and plasma treated GO (rGO) deposited substrate.
For the optical emission spectra (OES) of Ar plasma, the intense lines corresponding to Ar are observed in the range of 700nm to 800nm and Hydrogen species are at 410.2nm, 434nm and 656.5nm.28 The presence of excited species in the cold atmospheric Ar plasma contributed to the deoxygenation of GO. When the GO deposited samples interacts with the ions, radicals and neutral molecules present in the plasma, deoxygenation starts. In pure Ar gas, high energy electrons or ions (Ar+) by ionization account for the deoxygenation, due to physical bombardment.24,29 The duration of plasma treatment affects the exposure to these species. The presence of excited hydrogen in the downstream plasma may also account for the reduction of the GO. The hydrogen radicals present in the downstream plasma, interacts with the oxygen bonds and efficiently results into the plasma reduced graphene. The oxygen content was found to be decreased as treatment time increased, and the defects in the GO structure tend to increase.15 This study showed the efficient reduction of GO and an increase in the electrochemical performance of the plasma reduced graphene modified SPCE.
Electrochemical performance
The electrochemical performance of GO and rGO in 5mM K3[Fe (CN)6])/ K4[Fe (CN)6] (1:1), as shown in Figure 3c. There are CV curves with a three-electrode system for untreated and 3 mins plasma treated GO. As the redox reaction of [Fe (CN)6]3−/4− are quasireversible, it was used to characterize the electrochemical properties of modified SPCEs.30 The oxidation and reduction current peak values of untreated GO were less as compared to that of the reduced GO modified SPCEs. This shows that the conductivity of GO SPCE is less due to the presence of oxygen bonds in sp3 domain. The redox peaks for GO were obtained at 0.29V and −0.06V and they were shifted for rGO modified SPCEs to 0.35V and −0.17V respectively.
The oxygen-containing functional groups remain on the surface of plasma treated GO (rGO) sheets are mainly accountable for the redox peaks in CV curves. These change in rGO modified SPCE's redox peaks indicate the reduction and oxidation caused by the electrochemically active oxygenated groups. From Figure 3c, it was observed that compared to untreated GO SPCE at scanning rate of 50mV/s the current response of rGO SPCE was strengthened. Therefore, the capacitive behavior was observed to be enhanced in rGO SPCE.31 The oxygen content in GO affects the electrical conductivity, hence removal of the oxygen functional group in rGO increases the conductivity.30 Moreover, the increase in oxidation peak signifies the increase in the active sites on basal plane of graphene. The delocalized electrons within the sp2 domains gives a low resistant channel for the charge transfer in the SPCE system,1 enables an increased current passing through it. The conductivity increases with increase in the plasma treatment duration.
Surface plasmon resonance
The UV-Visible spectra of GO and rGO are shown in Figure 3d. The absorbance spectra of GO has an absorption peak at 249nm. However, the peak of rGO is shifted to 277nm is due to the change in configuration in graphene layer due to the reduction of GO. Moreover, it is due to a decrease in oxygen functional groups and an increase in aromatic rings which led electrons to get excited at a lower energy.4 The absorbance peak of GO at 249 nm showed the transition of aromatic C-C ring and the peak of rGO at 277nm credited the transition of C-O bonds, giving the evidence of GO reduction.32
Morphology and structures
AgNPs were deposited on the untreated GO and rGO structure on SPCEs and characterization was performed to study the suitability of GO-AgNPs composite in biosensing. The morphology and crystal structure of the untreated and plasma treated GO-AgNPs composite were investigated by TEM images as shown in Figure 4. Figure 4a illustrates the GO flake with Ag NPs deposited on it and Figure 4b showed the 3 mins plasma treated rGO-AgNPs, where the AgNPs were well embedded into the folded 3D rGO structure. The untreated GO-AgNPs composite shown in Figure 4a has a random distribution of AgNPs in the GO layer. The AgNPs deposited on GO layer were agglomerated at some areas and some of the area was with the absence AgNPs. However, the treated rGO-AgNPs composite showed the encaptured AgNPs such as they fill out the defects in rGO and form a structure as if they are a part of rGO layer.
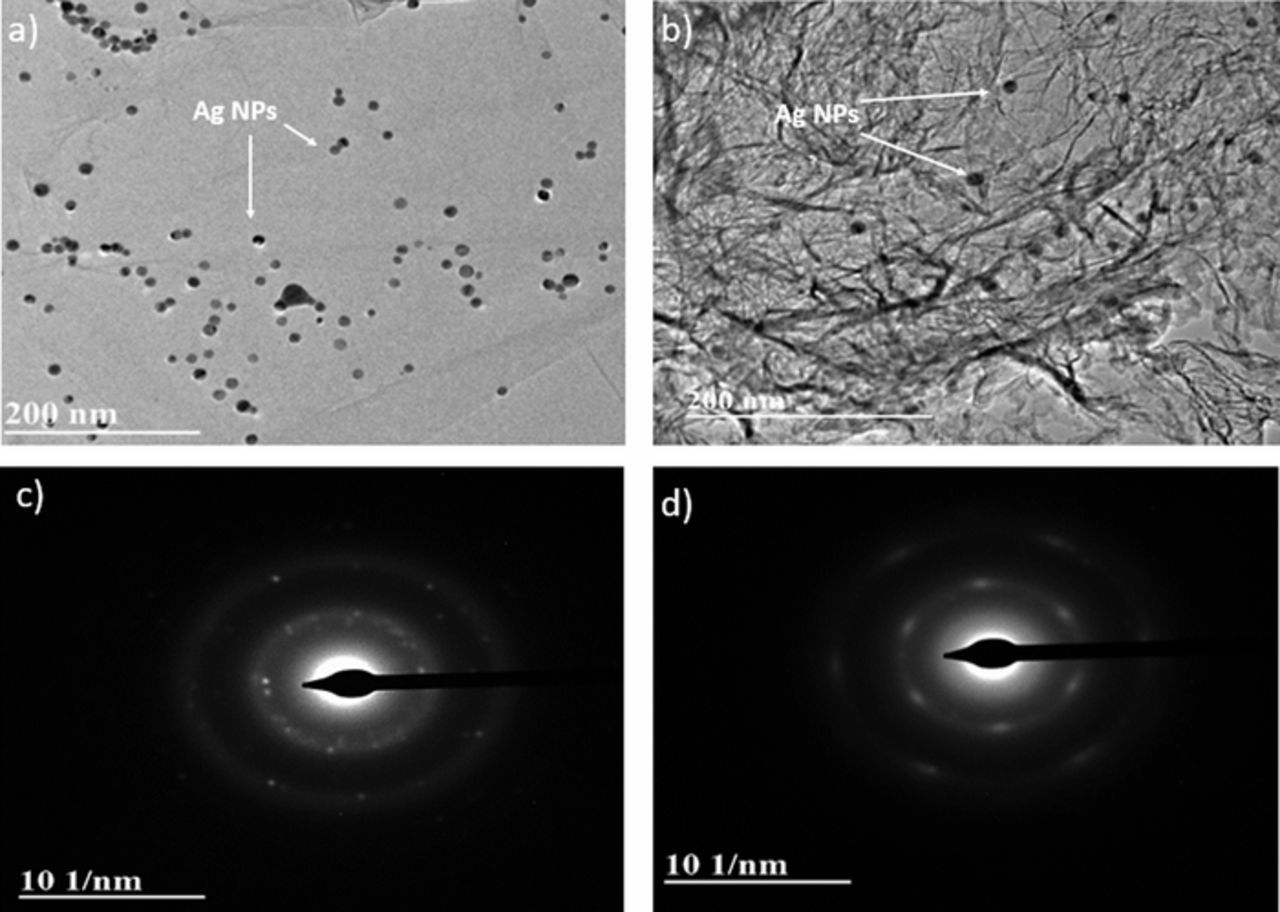
Figure 4. TEM images and SAED patterns of a), c) untreated GO-AgNPs composite and b), d) 3mins plasma treated rGO-AgNPs composite.
The comparative crystallographic structure study was performed by SAED pattern of GO-AgNPs and rGO-AgNPs as shown in Figures 4c and 4d respectively. The untreated GO-AgNPs shows the diffused diffraction rings corresponding to a group of lattice planes of GO layer with the distinct bright spots (some spots making up a ring), indicating the poly-nanocrystallanity of AgNPs in GO layer.3 The SAED of treated rGO-AgNPs shows the nanocrystalline bright spots aligned and diffused into the distinct rings of rGO layer. This indicates that the treated rGO-AgNPs may be forming an embedded structure of AgNPs into the defects formed in GO layer due to the plasma treatment. The plasma treatment led to the wrinkled structure of rGO combined with the AgNPs crystallinity alteration such as the AgNPs get encaptured into the rGO layer as if their atomic planes coincide with that of rGO. The crystallinity of the rGO-AgNPs composite gets altered by plasma treatment. The plasma treatment accounts for comparatively dispersed nanoparticle distribution on rGO surface. This reduces the out of plane orientations on NPs on the rGO layer and hence change in the SAED patterns.
Electrochemical characterization of rGO-AgNPs electrodes
The electrochemical behavior of different surface modified electrodes was investigated by obtaining 5mM [Fe (CN)6]3−/4− CV responses for untreated GO-AgNPs and plasma treated rGO-AgNPs composites modified SPCEs as shown in Figure 5a. The rGO-AgNPs modified SPCE showed the enhanced current response than that of the untreated GO-AgNPs. The significant amplification in the current response in rGO-AgNPs SPCE was obtained due to the active binding sites provided by AgNPs embedded into the vacancies created on the surface of rGO and due to the more surface excitation energy provided to AgNPs in rGO-AgNPs composite while deposition.
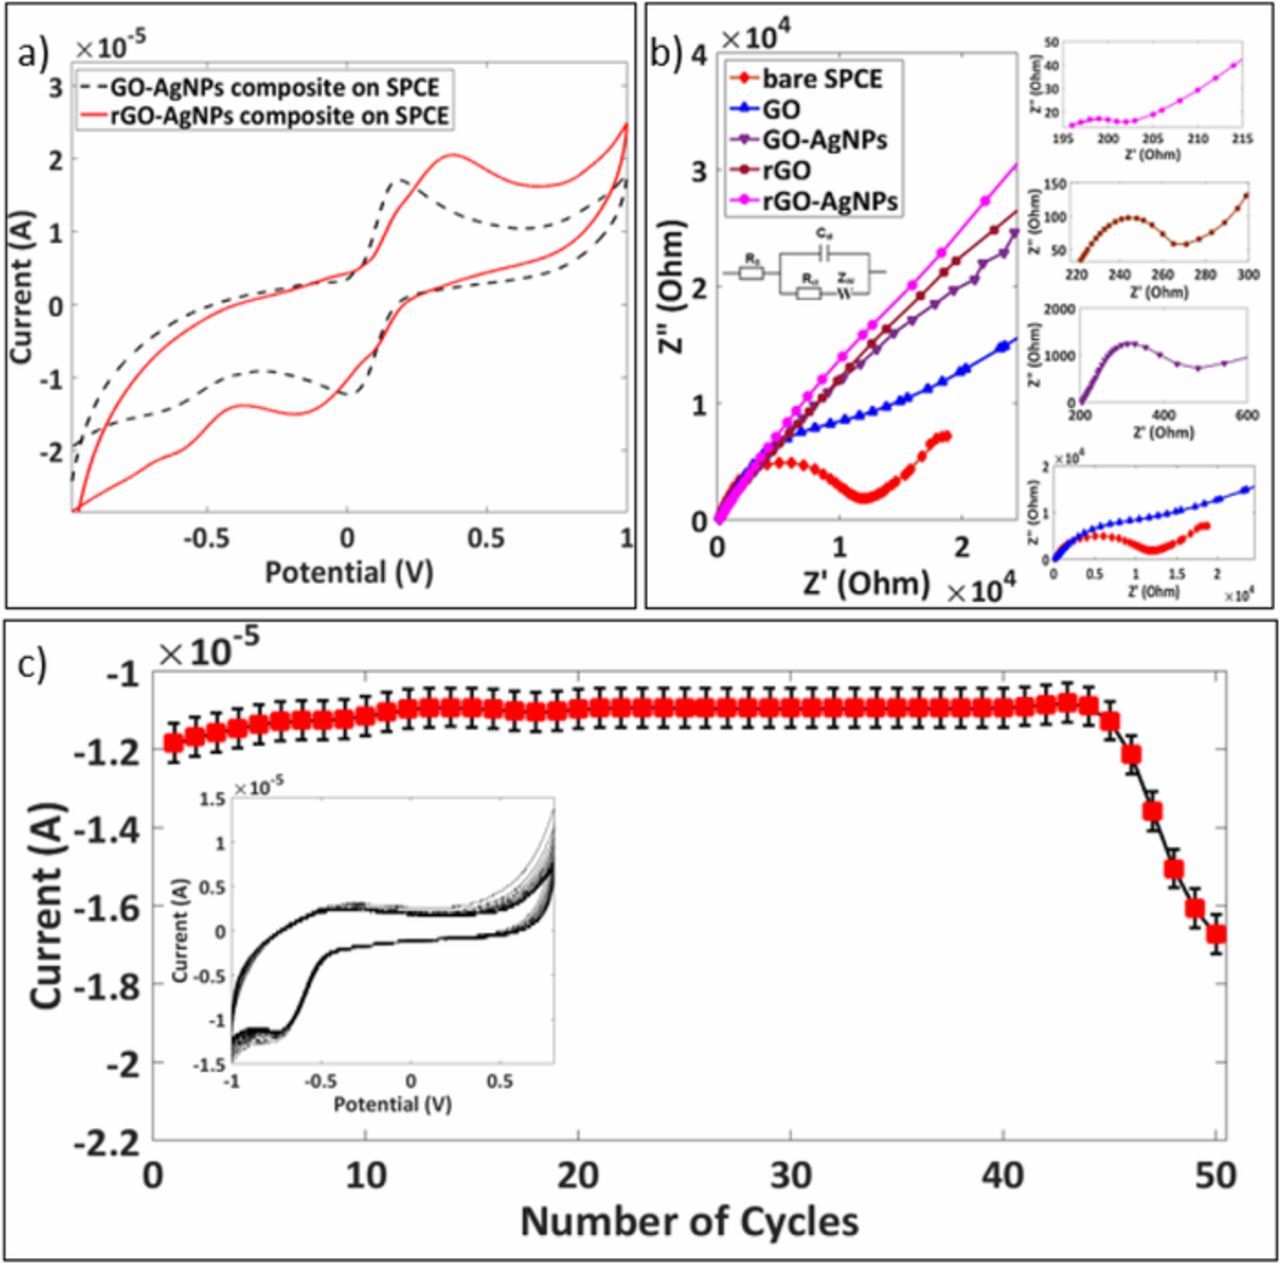
Figure 5. a) Cyclic Voltammogram of a) 5mM [Fe (CN)6]3−/4−; b) Nyquist plots of bare SPCE, GO, Plasma treated GO (rGO), GO-AgNPs and rGO-AgNPs modified SPCE in the presence of 5mM [Fe (CN)6]3−/4− (1:1) by applying an AC impedance with 50 mV amplitude in a frequency range from 0.01Hz to 100kHz under open-circuit potential conditions show the comparatively higher conductivity of plasma assisted electrodes and c) The reduction peak current per number of cycles in PBS (pH-7.8) with consecutive cyclic voltammograms in inset.
Nyquist plots were used to analyze the EIS data as shown in Figure 5b with the Randles equivalent circuit inset. The analyzed results provide the information on the impedance changes of the electrode surface as the modification carried out. The semicircle observed in the plot is due to the parallel combination of electron transfer resistance (Rct) and double layer capacitance (Cdl) suggesting that the bare and GO modified SPCEs have low conductive nature which opposes the interfacial charge transfer.33 The linear portion is due to Warburg impedance (Zw) indicates the ion exchange/diffusion in the electrolyte. The decrease in the semicircle diameter in rGO, GO-AgNPs and rGO-AgNPs indicates the higher conductivity and accelerated electron transfer between electrode surface and [Fe (CN)6]3−/4−. The increase in the electrochemical response was observed after the deposition of AgNPs on GO and rGO. Moreover, the rGO-AgNPs modified electrode has lowest Rct of 7 Ω and hence exhibit highest conductivity as compared to other electrodes.
The stability of the rGO-AgNPs modified electrodes was evaluated using consecutive cyclic voltammetry in PBS and was plotted against the number of cycles. Five rGO-AgNPs electrodes were used to investigate the repeatability of the electrodes. As can be seen, a reduction peak of rGO-AgNPs modified electrodes in PBS was stable for 45 consecutive cycles as shown in Figure 5c and the value of peak current dropped slowly after that. The results show good repeatability which suggest the promising applications in Point of Care (POC) sensing.
Electrochemical detection of cortisol by modified SPCE
The CV responses in Figures 6a and 6c were obtained in the presence of 1 μg/dl cortisol at a scan rate of 50 mV/sec. The untreated GO-AgNPs modified SPCE showed a prominent oxidation peak for Ag (Ag0 to Ag+) at 0.06V.34 However, for plasma treated rGO-AgNPs showed suppressed Ag peak at 0.06V, indicating the well embedded AgNPs in rGO-AgNPs composite. A weak reduction peak current response for cortisol at −0.5 V was observed for untreated GO-AgNPs than that of rGO-AgNPs. The result indicates that cortisol peak was enhanced because of plasma treatment. This electrochemical activity enhancement of rGO-AgNPs composites toward cortisol is a result of the improved effective AgNPs sites formed on the surface area of rGO.31,35 The peak current increase in the presence of cortisol than that of PBS can be due to the reduction of cortisol molecules traces adsorbed on rGO-AgNPs surface.36 As these modified SPCEs showed the effective detection of cortisol, they were used to detect the different concentrations of cortisol to study the physisorption of cortisol molecules on surface AgNPs of rGO.
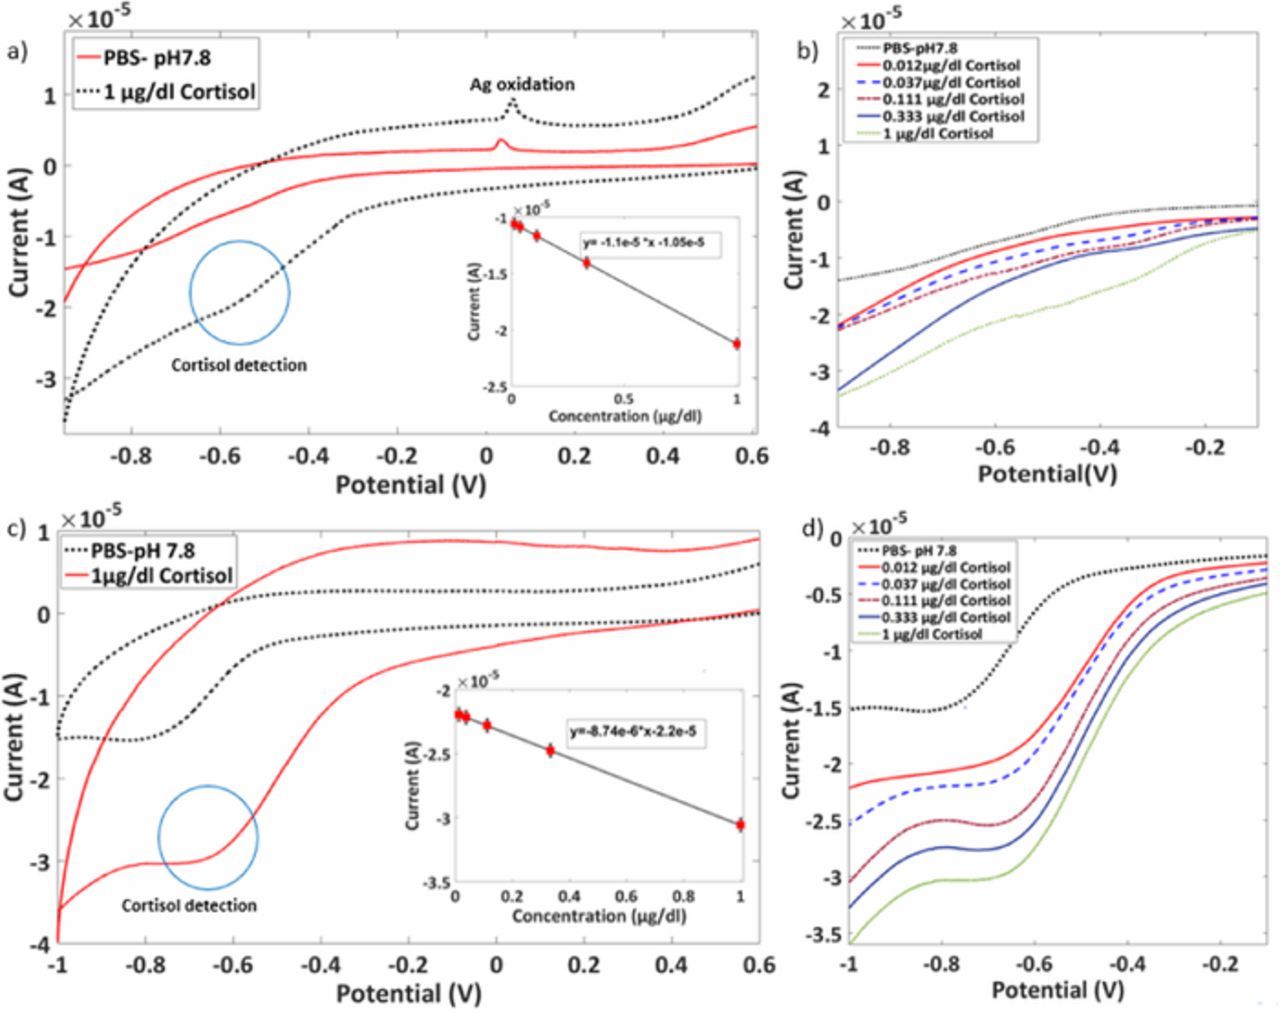
Figure 6. Cortisol detection cyclic voltammogram with calibration plots in insets of GO-AgNPs and rGO-AgNPs modified SPCEs a), c); different concentrations of cortisol on untreated GO-AgNPs composite modified SPCE and on rGO-AgNPs composite modified SPCE showing an increase in sensitivity b), d).
Figures 6b and 6d show CV for 0.012μg/dl, 0.037μg/dl, 0.111μg/dl and 0.333μg/dl of cortisol on GO-AgNPs and rGO-AgNPs modified SPCEs. The sequential increase in the cathodic current with an increase in the cortisol concentrations shows the absorption of cortisol molecules on the binding sites provided on modified SPCEs. The rGO-AgNPs composite shows higher activity than that of untreated GO-AgNPs due to the enhancement in the electronic properties. The insets show the calibration curves and the slopes of the calibration curves for GO-AgNPs and rGO-AgNPs modified electrodes are evaluated as 1.1 × 10⁻⁵ and 8.74 × 10⁻⁶ respectively. The higher sensitivity was observed after the plasma treatment.
Once the GO comes in contact with the downstream plasma, it gets reduced due to the presence of hydrogen species. After the AgNPs are treated with the plasma, the oxygen species present react with them to form a surface oxide, and the size of AgNPs gets decreased. Ultimately, increased the surface energy of AgNPs to enhance the electrochemical properties. The particles then arrange themselves to acquire vacancies at defects present in rGO layers. Therefore, the study confirmed the effective cortisol detection using the plasma treated rGO-AgNPs composite modified SPCE. The rGO-AgNPs showed the enhanced sensitivity toward the cortisol molecules than the GO-AgNPs proved the added surface excitation to AgNPs by plasma treatment.
Conclusions
The GO reduction by plasma treatment is successfully demonstrated at room temperature. The SPR, SERS and CV results showed that during plasma treatment, the oxygen species at the surface of GO are reduced. The enhancement in the electrical conductivity was observed in plasma treated GO and rGO-AgNPs composite. The plasma treatment induced the increase in the electrical sensitivity of the modified electrodes. The SEM and TEM images showed the change in morphology of rGO-AgNPs composite, suitable for effective electrochemical detection. The proposed technique has advantages over other thermal processing, chemical reduction techniques, and bulky plasma reduction setups that are being used. In addition, this method offers the approach in sensor fabrication toward improvising the electrochemical response of biomolecule detection. The desired material deposition and plasma treatment can be achieved on the flexible substrates for various applications as electrochemical sensors, supercapacitors, batteries, and POC systems.
ORCID
Apurva Sonawane 0000-0001-6593-3125
Mubarak A. Mujawar 0000-0003-2857-8309
Shekhar Bhansali 0000-0001-5871-9163