Abstract
Polymer nanocomposites are potential materials for three dimensional (3d) printing of functional components. For effective 3d printing, besides ensuring high conductivity of the nanocomposites, their flow characteristics also need careful adjustment. To satisfy the contradictory requirements, multiwalled carbon nanotubes (MWCNT) have emerged as an attractive option. As the dispersion of the MWCNT is believed to strongly influence the properties of the nanocomposites, we compared nanocomposites prepared using melt mixing and solution casting. The MWCNT endow the nanocomposites with appreciable conductivity even at relatively low loadings. At these loadings, the low frequency storage modulus indicates that the MWCNT impart solid-like character to the nanocomposites. While the conductivity percolation threshold of the nanocomposites prepared by melt mixing was lower, at higher loadings the conductivity of the nanocomposites prepared by the two methods were similar. Fitting the electrical conductivity and the linear viscoelastic storage modulus to power-laws, the obtained critical exponents for the two methods were close to each other and to the percolation theory predictions for the conductivity exponent. Our findings suggest that for MWCNT/ABS polymer nanocomposites, simple melt mixing can yield conductivities that are similar to that obtained by solution casting and close to the highest values reported in the literature.
Export citation and abstract BibTeX RIS

This is an open access article distributed under the terms of the Creative Commons Attribution 4.0 License (CC BY, http://creativecommons.org/licenses/by/4.0/), which permits unrestricted reuse of the work in any medium, provided the original work is properly cited.
The name three dimensional (3d) printing conjures the image of sending a digital file to a printer which "prints" the desired 3d object. The reality is not far from this image as the 3d object is built by the successive deposition or printing of thin layers of a suitable material, layer upon layer. The characteristics of each layer can be specified using computer-aided design and stored in a digital file. The stored file and a 3d printer can be used for the rapid fabrication of three dimensional objects from the bottom-up in a timely and cost-effective manner.1,2 The layers involved in 3d printing an object can be produced in several ways leading to the different methods of 3d printing in current use. A method popular among both professionals and hobbyists is fused deposition modeling or extrusion printing.3,4 In this method, a pressure difference is used to extrude a thin filament of a molten material, typically a thermoplastic polymer, through a heated nozzle onto a platform. The extruded material cools and in the process adheres to the previously deposited layers that have already cooled sufficiently to build up the desired 3d object.1–4
Recently, 3d printing has been used to print conductive microstructures for circuits,5 sensors6–8 and other functional9 and microelectromechanical applications.10 However, the major obstacle hindering greater use of 3d printing for functional applications is the dearth of 3d printable functional materials appropriate for a given application.11,12 Therefore, one of our long term goals is to develop novel polymer nanocomposites endowed with the following two characteristics: (1) sufficient electrical conductivity such that filaments produced from these conductive polymer nanocomposites can be used to 3D print novel functional components and devices, and (2) sufficient extrudability such that filaments produced from these conductive polymer nanocomposites can be used in unmodified, conventional 3D printers. These turn out to be severe constraints necessitating careful selection of the appropriate polymeric material to use as the matrix and the appropriate filler material that can impart electrical conductivity without adversely affecting the flow characteristics.
The two polymers whose filaments are the most widely used for 3D printing are poly(lactic acid) (PLA), a homopolymer,13 and acrylonitrile butadiene styrene (ABS), a copolymer.14 PLA, with a glass transition temperature of 60°C, will rapidly deform, especially when subjected to a load, as the use temperature approaches its glass transition temperature. ABS, with a typical glass transition temperature of 105°C, is better suited for applications where temperatures close to or larger than 60°C can be routinely expected. As electrical conduction leads to Joule heating, the internal temperature of the polymer nanocomposite is likely to increase during use. While the temperatures reached during actual use are unknown at this stage, it is clear thermal stability is an important consideration in our choice of the matrix material. Given its better thermal stability, we initially focus our attention on using ABS as the matrix material.
The three monomers that constitute ABS impart specific advantages to the resin: acrylonitrile imparts thermal stability and chemical resistance; butadiene imparts toughness and impact resistance; while styrene imparts rigidity, hardness and glossiness. ABS is an amorphous thermoplastic whose typical glass transition temperature of 105°C is similar to that of poly(styrene).14 To an extent, the glass transition temperature can be adjusted by varying the composition of the copolymer. The main determinant of the morphology of ABS copolymers is the microphase separation of the rubbery poly(butadiene) component.15 The poly(butadiene) exists as roughly spherical particles in a matrix of poly(styrene-co-acrylonitrile).15 The particles, typically micron-sized, of the rubbery polybutadiene can undergo crazing and thereby impart toughness to the material. In part due to its excellent toughness, ABS is widely used for 3D printing.
Typically, polymeric materials are endowed with electrical conductivity through the addition of conductive fillers.16–18 The conducting (and other) properties of composites have been rationalized using percolation theory,19 with varying degrees of success.20 The variation of the conductivity of the composite, σ, with the filler volume fraction, ϕ, is typically s-shaped comprising three distinct regimes: (1) At low ϕ, the interparticle distance between the filler particles is large and the σ is dominated by the conductivity of the matrix. As the conductivity of the matrix polymer is low, σ is also low. (2) Upon further addition of the filler, σ exhibits a rapid increase at a certain ϕ due to the formation of a conducting path spanning the entire sample. The conducting path, composed of the filler particles, is statistically self-similar and exhibits a fractal structure.19 This value of ϕ is referred to as the percolation threshold, ϕc. (3) At ϕ≫ϕc, multiple conducting paths exist in the sample and the conductivity remains high. However, the increase in conductivity with the filler volume fraction is more gradual. For a great variety of conductive composites and for ϕ⩾ϕc, the dependence of σ on ϕ follows a power-law,
![Equation ([1])](https://content.cld.iop.org/journals/1945-7111/166/9/B3091/revision1/d0001.gif)
Here, the proportionality factor σ0 depends on several factors including the conductivity of the filler, the topology of the conducting paths and the nature of the contact resistance. For the critical exponent, t, percolation theory predicts t≈1.33 in two dimensions and t≈2 in three dimensions but experimentally values as high as 10 have been observed.20 While several reasons have been hypothesized to explain the observed deviation from universality, the issue remains complex and unresolved.18,20
Similarly to the electrical conductivity, the linear rheology of the composite is also affected by the addition of the filler. In a dynamic viscoelasticity measurement, the effect can be clearly seen in the storage modulus, G'.21–24 As ϕ increases, the high frequency G' increases but not significantly, typically by less than a factor of 10. In contrast, the low frequency G' progressively increases with ϕ by up to several orders of magnitude.21–25 In addition, the G' begins to exhibit a plateau-like region and becomes independent of frequency, suggesting that the rheological response of the composite is becoming solid-like.21–25 The origin of this solid-like response can be linked to the formation of a cluster sufficiently large to contain a conducting path spanning the entire sample, corresponding to the regime (2) mentioned earlier. As the ϕ increases further, the mesh size of the filler network progressively becomes smaller and leads to further increase in the low frequency G'. While considerations based on percolation theory are purely geometrical, in real systems, interactions between the polymer and the filler also need to be considered. Such interactions can influence filler aggregation and the structure of the resulting aggregates. Any such structure formation is likely to affect the rheology of polymer composites, especially at low-frequencies. Therefore, rheology can also be used as a sensitive tool to probe the dispersion of the filler in polymer composites.21,26
Extensive work exists in the literature using carbon black as the filler.27–29 A serious disadvantage in using carbon black to endow ABS with electrical conductivity is that the volume fractions necessary to achieve the desired conductivity is sufficiently large30 to deleteriously affect the flow characteristics. To overcome this disadvantage, ideas from percolation theory suggest the use of high aspect ratio particles.24 Graphene, whose individual sheets are plate-like,23 is reported to yield a significantly lower percolation threshold than that of carbon black in some cases31,32 but not in others.33 However, even when the percolation threshold is low, the achievable conductivity is not comparable to that achievable using other high-aspect ratio fillers (see below).31–33 According to percolation theory, long slender rod-like particles are also expected to possess an extremely low percolation threshold.24 This suggests the use of carbon fibers, where aspect ratios of the order of 500 are common. In spite of the expectations from theory, ABS/Carbon fiber composites exhibit a higher percolation threshold34 than that of graphene and hence high filler volume fractions are needed to achieve sufficient conductivity. Past work indicates that, carbon nanotubes (CNT), which also possess high aspect ratios (although not as high as that of the carbon fibers) can impart significant increases in electrical conductivity even at low filler volume fractions.35 Therefore, we have chosen multiwalled carbon nanotubes as the conductive filler.
Typically, carbon nanotubes are dispersed in the polymer matrix using solution casting.36 Solution casting can achieve excellent dispersion of the carbon nanotubes in the polymer matrix and realize extremely low percolation thresholds. However, sample preparation is time consuming and involves large quantities of solvent that require proper disposal. A complementary method is melt mixing, where the carbon nanotubes are dispersed by applying shear deformation in the molten thermoplastic polymer at high temperatures. The shear deformation can be applied using an extruder (single-screw or twin-screw)37–39 or an internal melt mixer.40,41,33 While extruders are widely used for melt mixing in the industry, internal melt mixers remain the workhorse of the academic laboratory, partly due to the significantly smaller sample quantities involved.
For the preparation of polymer nanocomposites, melt mixing is likely to be more convenient, especially on an industrial scale. However, concerns regarding the extent to which the filler can be dispersed in the polymer matrix using melt mixing and consequently, the σ that can be achieved remain. As is clear from the literature cited above, both solution casting and melt mixing have been used to produce ABS/CNT nanocomposites. However, systematic investigations of the two methods of sample preparation, with reference to both the electrical conductivity and the rheological characteristics of the composites remain few. In addition, while linear viscoelasticity does not provide direct information regarding either the aggregation of the MWCNT or its dispersion in the polymer matrix, careful consideration of the data can lead us to useful information or at least productive hypotheses about the state of dispersion of the MWCNT in the polymer matrix. Therefore, starting with the same matrix material and conductive filler, both melt mixing and solution casting were used to prepare MWCNT/ABS nanocomposites at several filler loadings. The electrical conductivity and the linear rheology of the prepared nanocomposites were measured as a function of the filler loading and the results analyzed using percolation theory.
Experimental
Materials
A commercially available, ready-to-use, 3D printing filament (Beijing Tiertime Technology, P. R. China) made of ABS terpolymer was used as the matrix material. Multiwalled carbon nanotubes (MWCNT) (NC7000, Nanocyl SA, Belgium) were used to impart conductivity to the polymer nanocomposites. These high carbon purity (>90%) nanotubes were produced by catalytic chemical vapor deposition. The nanotubes can be visualized as layers of graphitic carbon rolled into seamless cylinders. As the name implies, individual nanotubes are long, thin objects. However, they are endowed with flexibility, albeit limited. Hence, to a first approximation, they can be considered to be similar to other flexible one dimensional nanoscale structures such as polymers. Therefore, at the scale of its diameter, the local static structure of these MWCNTs resembles a disordered wire mesh, similar to that of polymer melts or polymer gels. According to the manufacturer, the average outer diameter of the nanotube was approximately 10 nm.41
The length distribution of the MWCNT, measured using transmission electron microscopy, was found to be broad and right-skewed with the right tail extending to several micrometers.38 The average length specified by the manufacturer was 1.5 μm and is consistent with the length distribution reported in the literature.38 Consequently, the aspect ratio, defined as the length divided by the diameter, of these nanotubes is approximately 150. The as-received bulk MWCNT was in the form of a black powder. This is attributed to aggregation induced by the van der Waals attraction between the carbon nanotubes. The volume conductivity of the MWCNT in powder form is approximately 104 S/cm. While this conductivity value sets the upper limit that can be achieved by the use of this filler to impart conductivity to a polymer nanocomposite, the actual conductivities thus far achieved are approximately four orders of magnitude lower.
Fabrication of the ABS/MWCNT nanocomposites
The ABS filaments were used as received except for drying at 80°C over night. The MWCNTs were used as received. The nanocomposites were prepared using two methods: (1) solution casting and (2) melt mixing. Nanocomposites were produced at the following MWCNT volume fractions (in %): 0, 0.113, 0.227, 0.341, 0.456, 1.36, 2.27, 3.41 and 4.54.
Solution casting
First, the MWCNT was dispersed in 20 ml of chloroform (Wako Chemicals, Japan) using an ultrasonicator (Digital Sonifier Model 450, Branson Ultrasonics, USA) at a power of 400 W, a frequency of 20 kHz and an amplitude of 47 μm. The ultrasonic waves were applied for a total time of 10 minutes in 20 second pulses. A pause of 10 seconds was introduced between the pulses to prevent overheating. Next, ABS already dissolved in 50 ml of chloromethane (Wako chemicals, Japan) was introduced into the MWCNT/chloroform mixture and the earlier ultrasonic pulse sequence was repeated for the same time. The prepared mixture was left standing at room temperature for 12 hours and then dried in a vacuum oven for 3 hours at 120°C. To check the dependence of the MWCNT dispersion on the strength of the applied ultrasonic waves, another set of samples were prepared by following the procedure indicated above except that the power was reduced to 200 W and the frequency increased to 35 kHz.
Melt mixing
The MWCNT and the ABS were blended at 200°C using a batch type internal melt mixer (Labo Plastomill, Toyo Seiki Seisakusho, Japan) equipped with twin rollers. The ABS was first introduced into the mixer and softened at a roller speed of 10 rpm for 3 minutes. After introducing the MWCNT, the roller speed was increased to 50 rpm and the ABS and CNT were mixed for 10 minutes. As the mixing temperature was sufficiently above the glass transition temperature of ABS (∼100°C), the viscosity of the ABS was sufficiently low to enable flow but sufficiently high for the shear forces to be adequate to ensure effective mixing of the ABS and the MWCNT.
Characterization of the polymer nanocomposites
The electrical conductivities of the samples were measured using a digital multimeter (Keithley 2110, Tektronix, USA). As we were interested in characterizing samples with widely varying conductivities, including those with high conductivities, eliminating the influence of the resistance from the leads and the contacts was desirable. Therefore, the conductivities were measured using the four-point probe method.42,43
Dynamic viscoelastic measurements were performed using a rheometer (Physica MCR-301, Anton Paar, Austria). In order to avoid complications pertaining to sample loading during the measurement arising from the presence of the fillers, parallel plate geometry was chosen for the measurements. The gap between the plates was approximately 1 mm and the diameter of the plates was 25 mm. The maximum strain for linear viscoelastic regime was determined using a strain sweep. While ensuring that the applied shear strain remained in the linear viscoelastic regime, the linear viscoelastic storage (G') and loss (G'') moduli were obtained at 200°C as a function of angular frequency, ω, for 10−2 s−1 ⩽ ω ⩽ 102 s−1.
Results and Discussion
Electrical conductivity and conductivity percolation
Figure 1 shows the variation of the electrical conductivity of the nanocomposite, σ, with the MWCNT volume fraction, ϕ (in %). The σ of pure ABS is approximately 10−16 S/cm. Upon addition of the MWCNT and similarly to past research on using ABS29,32,33 and other polymers39,20,44 as the matrix, σ exhibits a rapid increase at a certain ϕ for both the melt mixed and the solution cast samples. Upon further addition of the MWCNT, the rapid increase in σ becomes more gradual. At a first glance, there is very little difference between the σ obtained using melt mixing and solution casting at 400 W. This suggests that melt mixing can achieve both a low ϕc and excellent σ, comparable to that achievable using solution casting. In the present case, melt mixing was performed using a laboratory scale internal melt mixer. The mixer is equipped with two rollers that rotate in opposite directions. The rotation of the rollers can apply shear stress and result in large shear deformation of the material caught between the two rollers. However, unlike in an extruder, the material experiences little elongational deformation. Therefore, any dispersion must necessarily be a consequence of only the applied shear deformation. Hence, the dispersion achievable in an internal mixer had remained a concern. Seen in this light, it is reassuring that the polymer nanocomposite prepared using an internal mixer can achieve σ comparable to that achievable using solution casting. In addition, it is germane to note that the σ achieved in this work is comparable to the largest values reported in the literature.29,32,33 However, this has been achieved without any special measures to enhance the dispersion of the CNT in ABS – neither surface modification of the CNT nor elaborate procedures for melt mixing were necessary.
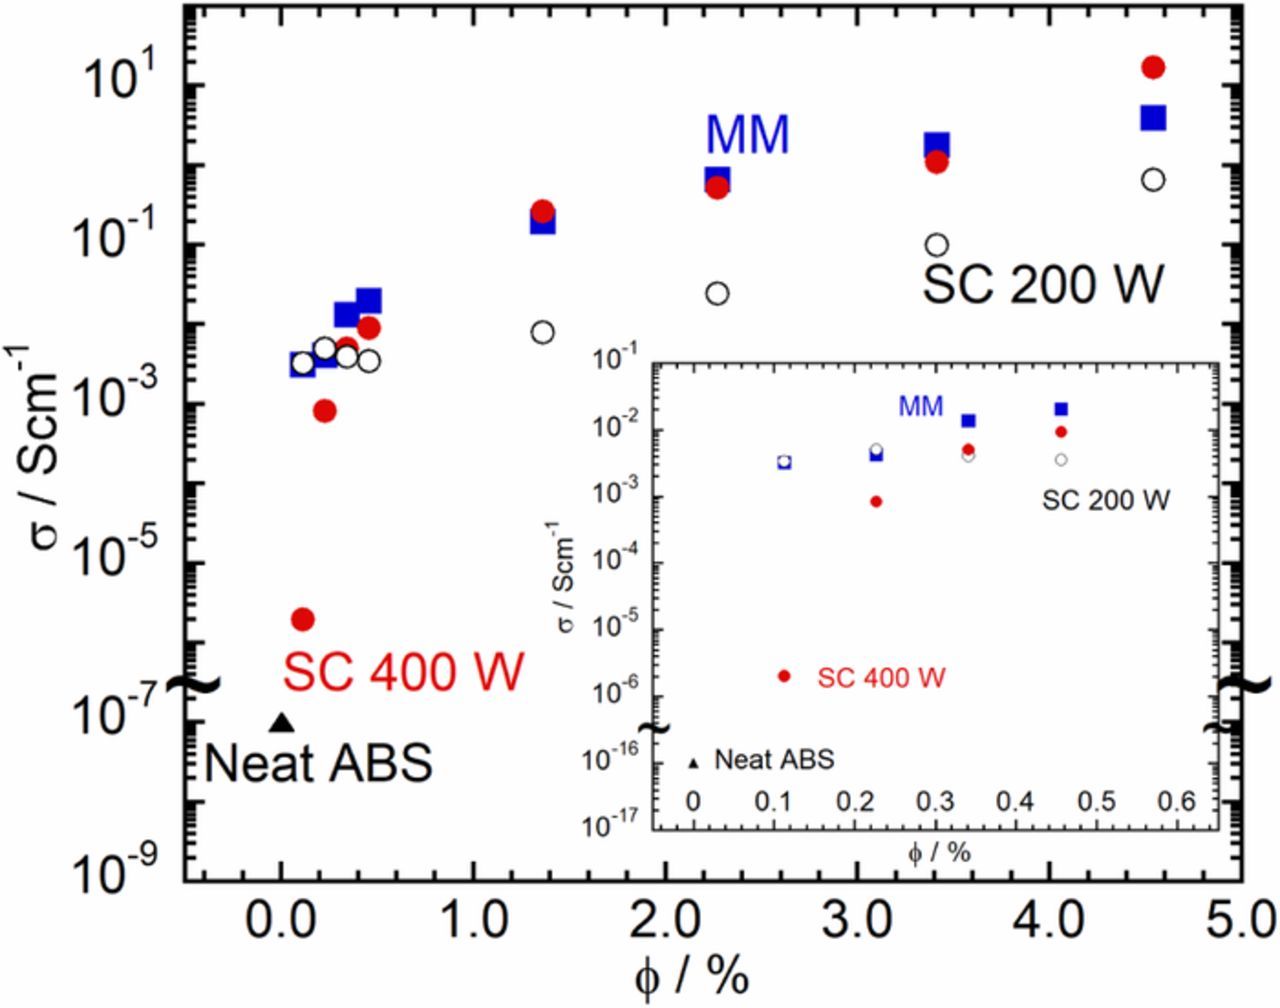
Figure 1. Variation of σ with ϕ: comparison of the nanocomposites prepared by melt mixing (MM;  ); and solution casting at 400 W(SC 400 W;
  ) and at 200 W (SC 200 W; ○).
From Figure 1, it appears that the variation of σ with ϕ essentially follows the expectation from percolation theory. We confirmed this by fitting the data in Figure 1 to Equation 1. As can be seen from Figure 2, the variation of σ with ϕ can be described using the power-law dependence predicted by percolation theory. The fits yield similar values for the critical exponent, t≈1.9 for melt mixing and t≈1.8 for solution casting at 400 W. While widely varying values for t have been reported in the literature,20 the values we obtained were close to t≈2.0 predicted by percolation theory. Percolation theory assumes that structures emerge from the random placement of the filler particles in a matrix. Particle-particle interactions and particle-matrix interactions are not considered but these can influence the aggregation of the MWCNT and consequently, its dispersion in the matrix. As mentioned earlier, the value of t can depend on the specific fractal structure of the conducting paths in the percolating filler cluster. The t values found in this work suggests that the conducting paths in the nanocomposites prepared by both melt mixing and solution casting at 400 W are similar to each other and, to a first approximation, can be assumed to be similar to that envisioned by percolation theory.
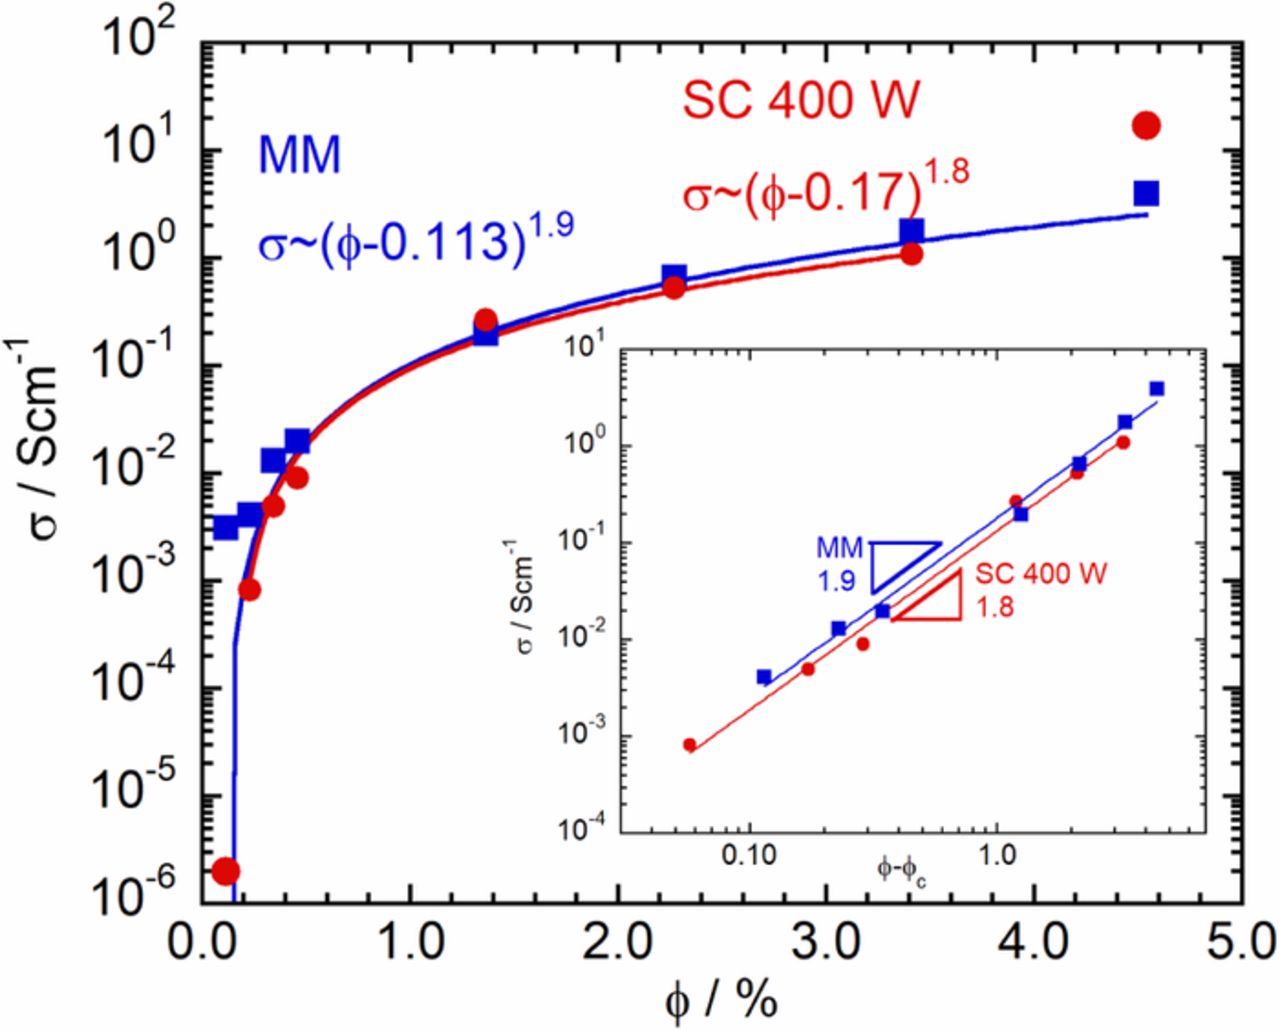
Figure 2. Fitting the variation of σ with ϕ to a power-law: comparison between melt mixing (MM, ) and solution casting at 400 W (SC 400 W, ). The values of ϕc and t obtained from the fit are indicated in the Figure. Inset: Log-log plot of σ against ϕ-ϕc. Note that, in this representation, the power-law exponent is the slope of the straight line.
The ϕc obtained from the fits is between 0.1 and 0.2% and the σ increases rapidly thereafter. According to percolation theory, the origin of the low ϕc, can be attributed to the high-aspect ratio of the MWCNTs used. While both methods of sample preparation yielded similarly small values of ϕc, the ϕc obtained using melt mixing was smaller than that obtained using solution casting at 400 W. This becomes clear by focusing on the dependence of σ on ϕ in the low ϕ region, see Figure 1, inset. From the inset it is clear that while the initial increase in the σ is significantly rapid to appear almost as a jump in the case of melt mixing, the increment is more gradual in the case of solution casting at 400 W. However, as the ϕ increases, the σ in the case of solution casting at 400 W rapidly approaches that of the samples prepared by melt mixing such that already at ϕ≈0.5, there is little difference between the σ of the nanocomposites prepared by the two methods. While the origin of this difference in the ϕc and the low ϕ dependence of σ is presently unclear, some hints can be obtained from the frequency dependence of the linear viscoelastic storage modulus to be discussed later.
As mentioned earlier, solution casting is expected to yield excellent dispersion of the MWCNT in the ABS matrix.36 Besides the dissolution of the matrix polymer in a solvent, one can expect the homogenization performed using the ultrasonicator to be an important contributor to the effectiveness of the dispersion of the MWCNT.36 As the effectiveness of the homogenization step will depend on the power applied by the ultrasonicator, we investigated the σ of samples prepared by reducing the power setting of the ultrasonicator to 200 W, half the power mentioned earlier. As can be seen from Figure 1, inset, the initial increase in σ is significantly more rapid in the case of 200 W when compared to the increase in the case of 400 W and is similar to that seen in the samples prepared by melt mixing. Beyond ϕ≈0.5 however, the σ of the samples prepared by solution casting at 200 W begin to deviate significantly from that of the samples prepared by both solution casting at 400 W and by melt mixing. In the range 1⩽ϕ(%)⩽4, the σ of the 200 W samples is lower by almost two orders of magnitude. In addition, the dependence of σ on ϕ for ϕ>ϕc cannot be described by the power-law function predicted by percolation theory. This failure and the lower σ values obtained suggest the hypothesis that the lower power (200 W) is not adequate to sufficiently break up the MWCNT aggregates and ensure satisfactory dispersion of the MWCNT. Combining this hypothesis with the experimental observation that the ϕc for the samples prepared by solution casting at 200 W appears to be lower than that prepared at 400 W, suggests that the value of ϕc does not bear a simple relationship to the effectiveness of the dispersion of the MWCNT in the polymer matrix.
Linear rheology and percolation
Figure 3 shows the angular frequency, ω, dependence of the linear viscoelastic storage modulus, G', at 200°C for several values of ϕ. Data for the samples prepared by both melt mixing and solution casting at 400 W are shown. Depending on the actual copolymer composition, neat ABS can exhibit a variety of ω dependence, especially at low ω.15 The G' of the neat ABS used in this work exhibits ω dependence qualitatively similar to that of typical polydisperse linear polymer melts, likely related to the fact that filaments of this ABS are used for 3d printing. For the samples prepared by melt mixing, upon increasing the MWCNT content to ϕ≈ϕc, the high frequency G' remains essentially identical to that of neat ABS. This suggests that the rheology is still dominated by the polymer and the dynamics of the polymer chains has not been affected by the presence of the MWCNT. In polymer composites, an increase in the low ω G' can usually be attributed to structure formation by the filler, such as aggregation, agglomeration or network formation. The form of the ω dependence will depend on the actual structure formed. At this ϕ, the low ω G' exhibits only a mild increase indicating an increase in the longest relaxation time. If we consider the relaxation of the stress as due to colloidal scale Brownian motion of the filler aggregates, the mild increase suggests that significant aggregate formation has not occurred. For the samples prepared by solution casting at 400 W, while the high ω G' exhibits a small increase when compared to neat ABS, the low ω G' is larger by almost an order of magnitude. The larger increase at low frequencies suggests the formation of aggregates larger than those obtained by melt mixing at this ϕ. If better dispersion leads to higher σ, the difference in the measured σ seen at low ϕ between melt mixing and solution casting at 400 W could be attributed to the poorer dispersion achieved by the latter method. The difference, in both the σ and the G', disappears at larger ϕ and suggests the formation of similar aggregate networks. The ω independence of G' seen at low ω, indicating solid-like response, can be attributed to such network formation.

Figure 3. Variation of G' with ω at 200°C for several ϕ: melt-mixing (solid symbols) and solvent casting at 400 W (hollow symbols). The data for neat ABS is also shown.
To consider the variation of the low ω G', the G' at ω = 0.0215 rads−1 was plotted against ϕ in Figure 4. While the observed increase in G' is not as large as the increase seen in σ, the curves appear to be qualitatively similar. Therefore, similarly to the data fits performed earlier, the variation of the G' with ϕ was fit using a power-law function. As can be seen from Figure 4, including the inset, the power-law function provides an excellent description of the dependence of G'(ω = 0.0215 rads−1) on ϕ. The values of t obtained from the fit, t≈2.3 for melt mixing and t≈1.9 for solution casting at 400 W. The obtained t values are significantly larger than t≈0.7 found for single wall carbon nanotubes in Poly(methyl methacrylate)25 but are significantly smaller than t≈7 reported for MWCNT/Poly(styrene).45 Note that the obtained t values are close to that obtained from the dependence of σ, on ϕ. The ϕc for rheology percolation obtained from G' is lower than that obtained for electrical percolation from σ, consistent with some past work25 but inconsistent with others who found the rheological ϕc to be larger than that of electrical ϕc.45,46 The wide range of values reported in the literature for t and ϕc and the often inconsistent relationship between the electrical ϕc and the rheological ϕc suggests that much remains to be understood regarding the relationship between electrical and rheological percolation.
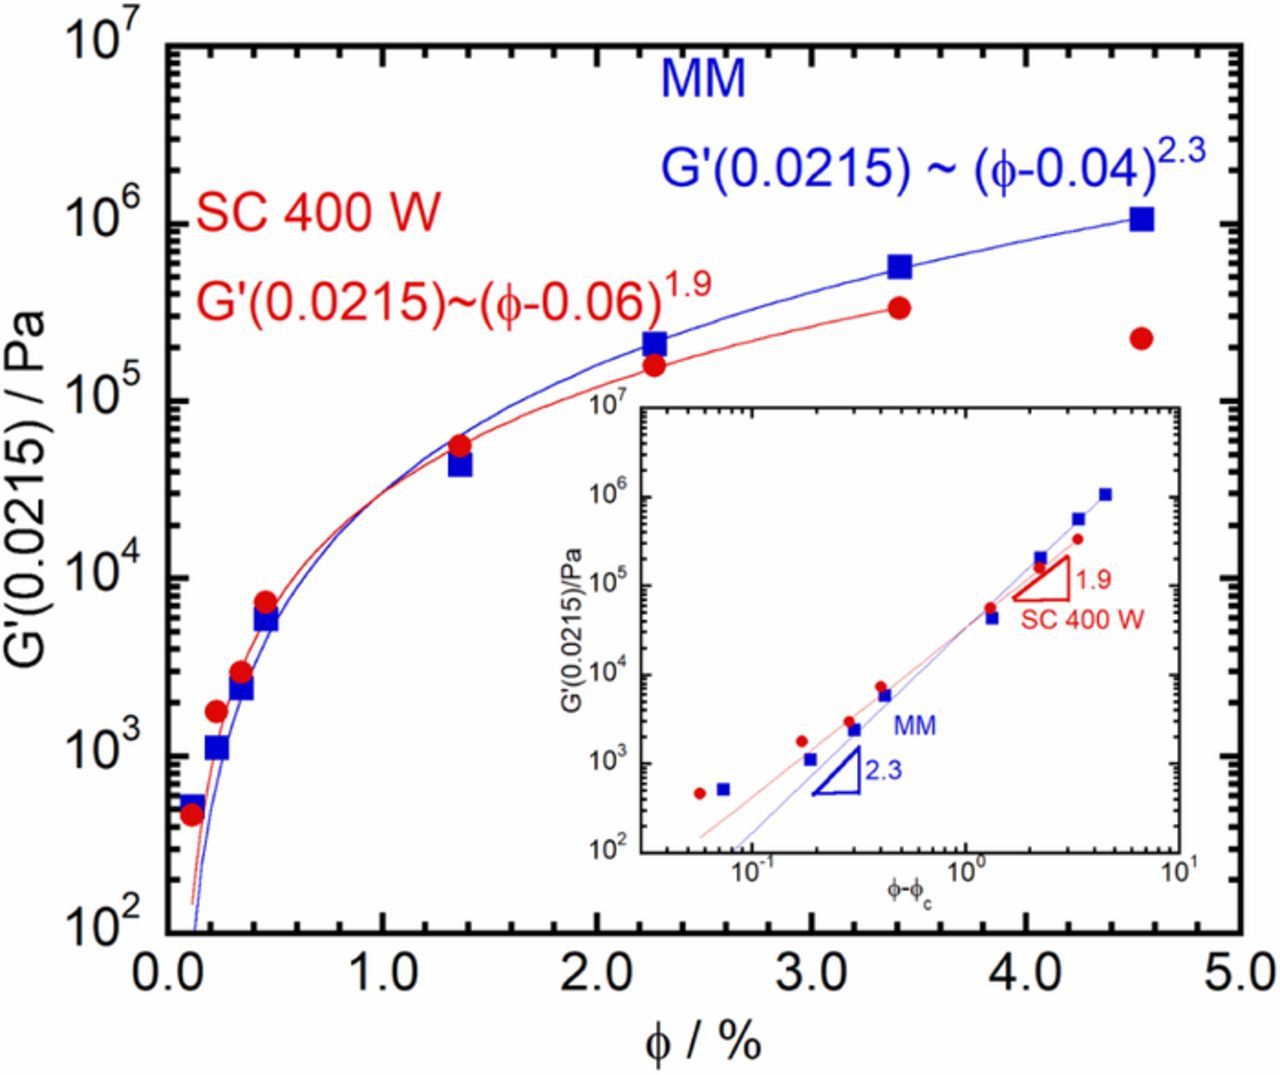
Figure 4. Fitting the variation of G'(ω = 0.0215 rad/s) with ϕ to a power-law: comparison of melt mixing (MM, ) and solution casting at 400 W (SC 400 W, ). The values of ϕc and t obtained from the fit are indicated in the Figure. Inset: Log-log plot of G'(0.0215) against ϕ-ϕc. Note that, in this representation, the power-law exponent is the slope of the straight line.
Conclusions
MWCNT/ABS nanocomposites prepared by both melt mixing and solution casting exhibited a rapid increase in σ at low values of ϕc≈0.1%. The values of t obtained by fitting the σ dependence on ϕ to a power-law function are similar for both sample preparation methods and close to the predictions of percolation theory. Further work is needed to clarify if the above finding necessarily implies that the origin of electrical conductivity is by conducting paths whose structure, presumably fractal, can also be described by percolation theory. The G' also exhibited behavior qualitatively similar to that of σ and the obtained t values for the two preparation methods were close to each other. The electrical ϕc for the samples prepared by melt mixing was smaller than that for solution casting at 400 W. The ω dependence of the corresponding G', especially at low ω could be used to suggest that the lower ϕc could be related to smaller aggregates or equivalently, better dispersion in the samples prepared by melt mixing. This is counter-intuitive as solution casting is believed to yield better dispersion. The above difference notwithstanding, the σ achievable at high ϕ by both preparation methods was rather similar and in this ϕ regime, the preparation method can be chosen according to convenience.
We found that even simple melt mixing can achieve σ values comparable to that obtained in the literature, often using special techniques to disperse the MWCNT in the polymer matrix. This raises the question if further increase in σ can be achieved by further optimizing the experimental conditions under which the melt mixing is performed. Therefore, a more careful investigation of the relationship between the melt mixing parameters such as roller speed, mixing time and mixing temperature, and the maximum achievable σ is planned for the future.
Acknowledgments
The authors are grateful to the manufacturers for the generous provision of the ABS filaments and the MWCNT used in this work.
ORCID
Sathish K. Sukumaran 0000-0002-5665-4535
Ajit Khosla 0000-0002-2803-8532